Data Graphics in Visio Plan 2 and Visio Professional is great, but it only enables us to use them with 2D shapes in Visio, i.e. not on connectors. So, what if you want to change the line colour of the connectors between the 2D shapes because of the data flowing between them? Well, it is possible … with a little preparation!
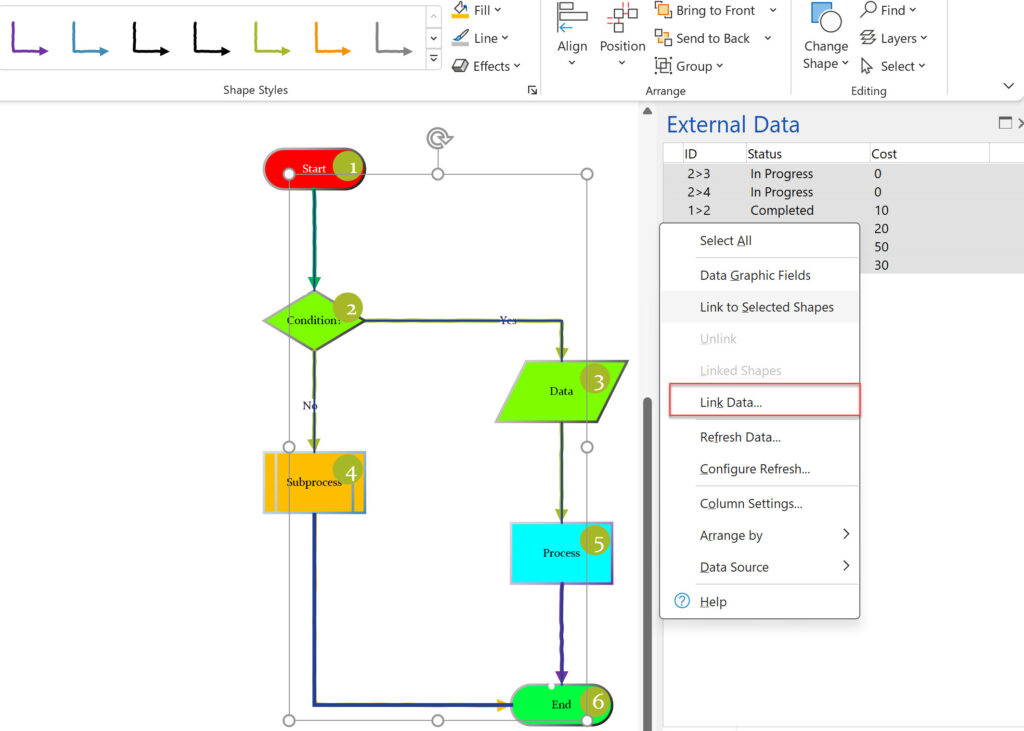
Firstly, you need data on your connectors … now that can be added manually, but more likely, you want to add the data from a data source like an Excel table. The good news is that you use Data | External Data | Custom Import … but you will want to have a unique identifier for each connector between shapes, unless you want to drag and drop each row from the External Data window on to each line … one by one. The smarter way is to create a Shape Data row value with unique id for each connector, and use this to import the data automatically.
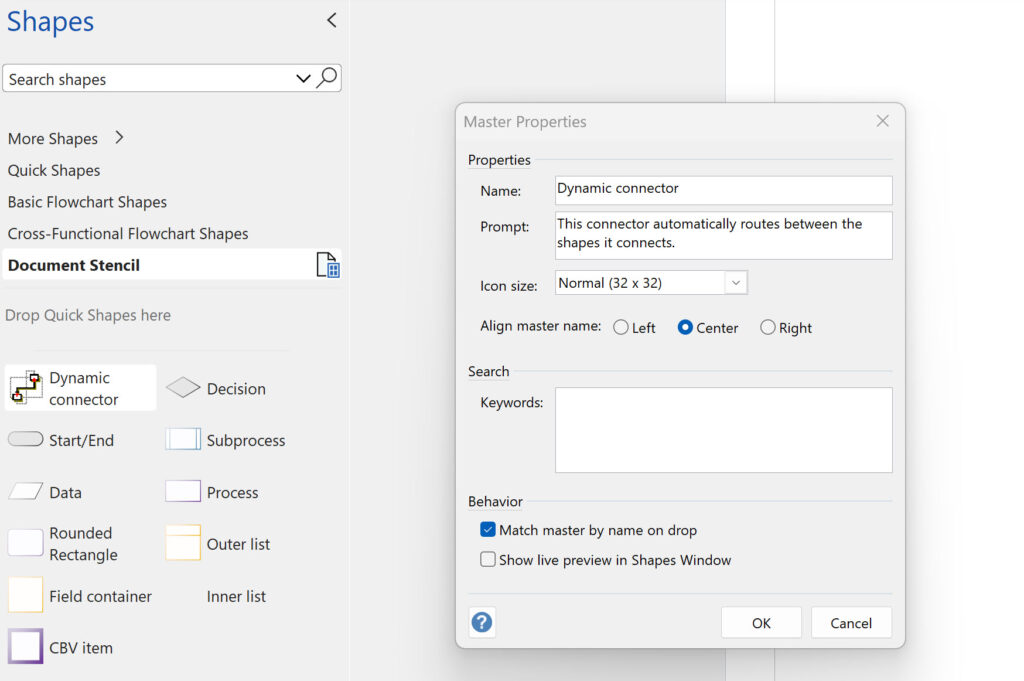
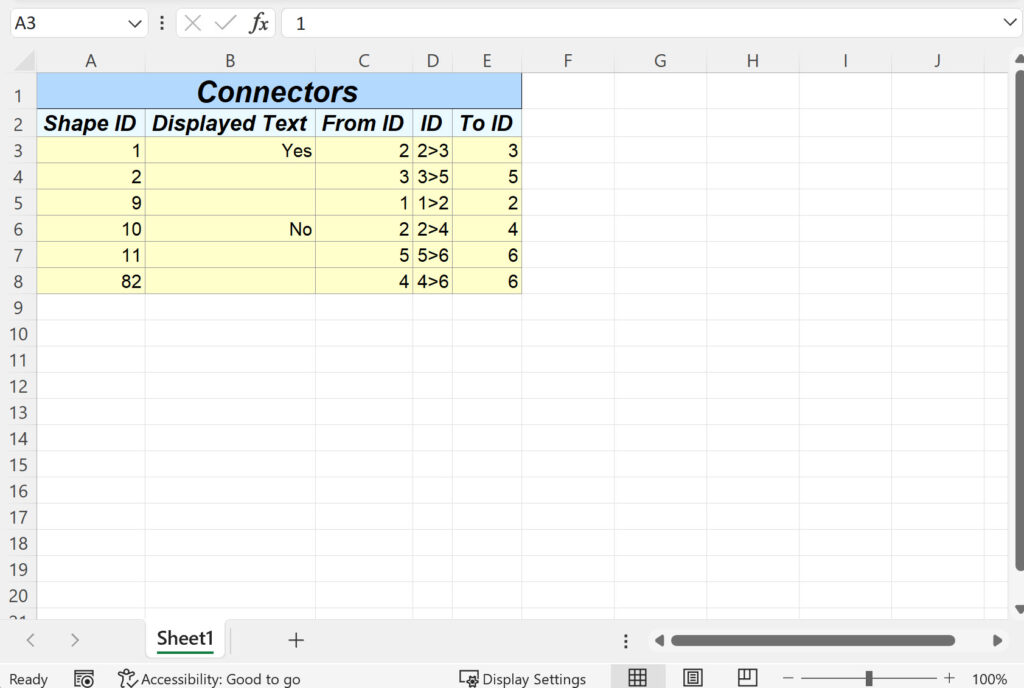
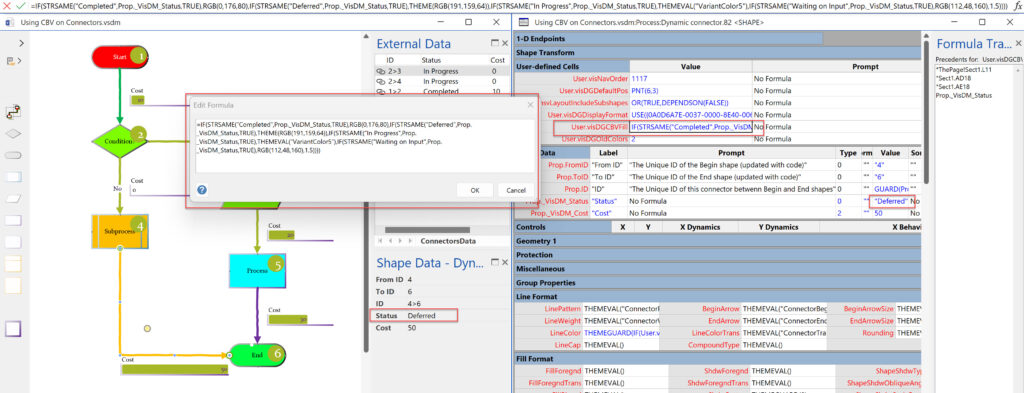
The Dynamic connector master shape is the default connector in most Visio templates, and some of them already include a customised version of it. If you start a new blank diagram, then the Connector tool will automatically create the Dynamic connector master in the Document Stencil … and tick the Match master by name on drop option. Simply use Edit Master | Edit Master Shape from the right-mouse context menu of the master in the Document Stencil. Then add something like the FromID, ToID and ID Shape Data rows, as in the following screenshot.
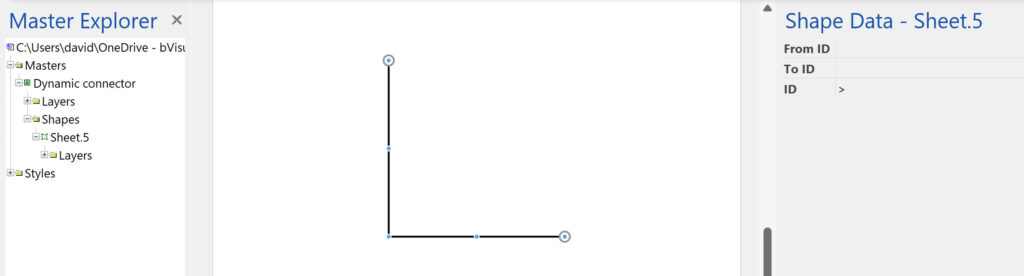
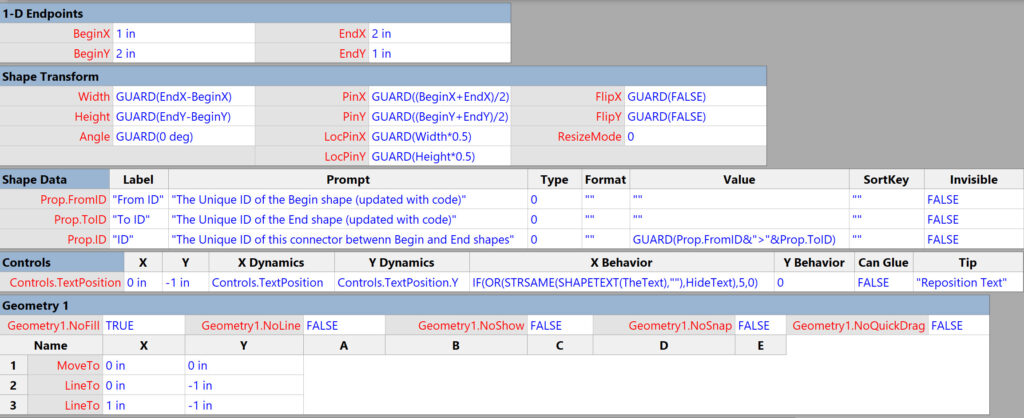
The FromID and ToID rows could be Invisible=True, and the Prop.ID.Value is set to the following formula:
=GUARD(Prop.FromID&”>”&Prop.ToID)
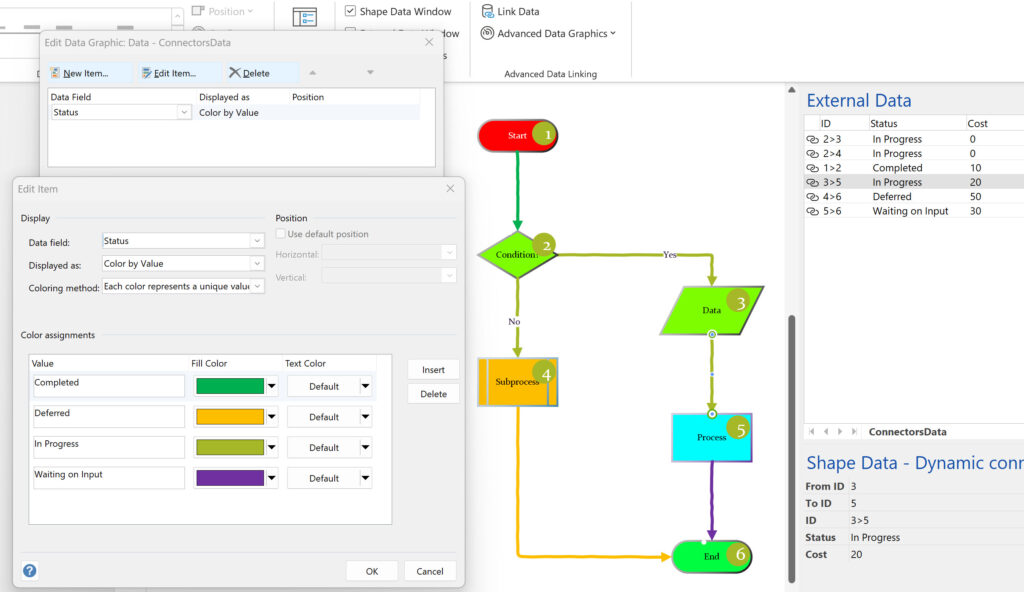
This Prop.ID.Value is the unique ID of the connector shape, and will be automatically created from the Prop.FromID and Prop.ToID values. Unfortunately there is no ShapeSheet formula to automatically get the value of a Shape Data row in the shapes that the connector is glued to at either end, so you will need a little code to update them. In this example, the Process shapes at either end of the connectors shapes have a Prop.ProcessNumber value, as shown by the numbers in the green Data Graphic Text callouts in the first screenshot. So, all that is needed is to transfer these values to the Prop.FromID and Prop.ToID Shape Data rows of each Dynamic connector shape. I wrote a little VBA to do this, but it could be in any suitable language.
I like to create some global constants to specify the names of the 1D connector master, the source Shape Data row of the 2D shapes, and the FromID and ToID Shape Data rows on the connector shapes.
Public Const MASTER_CONNECTOR As String = “Dynamic connector”
Public Const SHAPEDATA_SOURCEID As String = “ProcessNumber”
Public Const SHAPEDATA_FROMID As String = “FromID”
Public Const SHAPEDATA_TOID As String = “ToID”
Then you need a function to get the value of the source Shape Data row or an empty string if nothing found.
'Get the value of the named Shape Data row on a specified shape
'If numeric, then format it according to the format expression
Private Function GetIDFromShape( _
    ByVal shp As Visio.Shape, _
    ByVal propName As String) As String
On Error GoTo errHandler
    GetIDFromShape = ""
    If shp Is Nothing Then
        GoTo exitHere
    End If
    If shp.CellExistsU("Prop." & propName, _
            Visio.VisExistsFlags.visExistsAnywhere) Then
        If shp.CellsU("Prop." & propName & ".Type").ResultIU = 2 Then
            GetIDFromShape = format(shp.CellsU("Prop." & propName).ResultStrU(""), _
                shp.CellsU("Prop." & propName & ".Format").ResultStrU(""))
        Else
            GetIDFromShape = shp.CellsU("Prop." & propName).ResultStrU("")
        End If
    End If

exitHere:
    Exit Function
errHandler:
    MsgBox Err.description, vbExclamation, "GetIDFromShape"
    Resume exitHere
    Resume
End Function
Now, you are ready to loop through every connector shape on the active page to update the FromID and ToID values.
'Update every Dynamic connector on the active page with
'the specific Shape Data row values of each glued shape
'Clear the value if not glued
Public Sub UpdateDynamicConnectors()
On Error GoTo errHandler
Dim shpConnector As Visio.Shape
Dim mstConnector As Visio.Master
Dim selConnectors As Visio.Selection
Dim pag As Visio.Page
Dim cnxn As Connect
Dim fromID As String
Dim toID As String
If MasterExists(MASTER_CONNECTOR) Then
Set mstConnector = ActiveDocument.Masters(MASTER_CONNECTOR)
Else
GoTo exitHere
End If
Set selConnectors = ActivePage.CreateSelection(visSelTypeByMaster, 0, mstConnector)
For Each shpConnector In selConnectors
fromID = ""
toID = ""
For Each cnxn In shpConnector.Connects
If cnxn.FromCell.Name = "BeginX" Then
fromID = GetIDFromShape(cnxn.ToSheet, SHAPEDATA_SOURCEID)
ElseIf cnxn.FromCell.Name = "EndX" Then
toID = GetIDFromShape(cnxn.ToSheet, SHAPEDATA_SOURCEID)
End If
Next cnxn
If shpConnector.CellExistsU("Prop." & SHAPEDATA_FROMID, _
Visio.VisExistsFlags.visExistsAnywhere) <> 0 Then
shpConnector.CellsU("Prop." & SHAPEDATA_FROMID).FormulaForceU = _
"=""" & fromID & """"
End If
If shpConnector.CellExistsU("Prop." & SHAPEDATA_TOID, _
Visio.VisExistsFlags.visExistsAnywhere) <> 0 Then
shpConnector.CellsU("Prop." & SHAPEDATA_TOID).FormulaForceU = _
"=""" & toID & """"
End If
Next shpConnector
exitHere:
Exit Sub
errHandler:
MsgBox Err.description, vbExclamation, _
"UpdateDynamicConnectors"
Resume exitHere
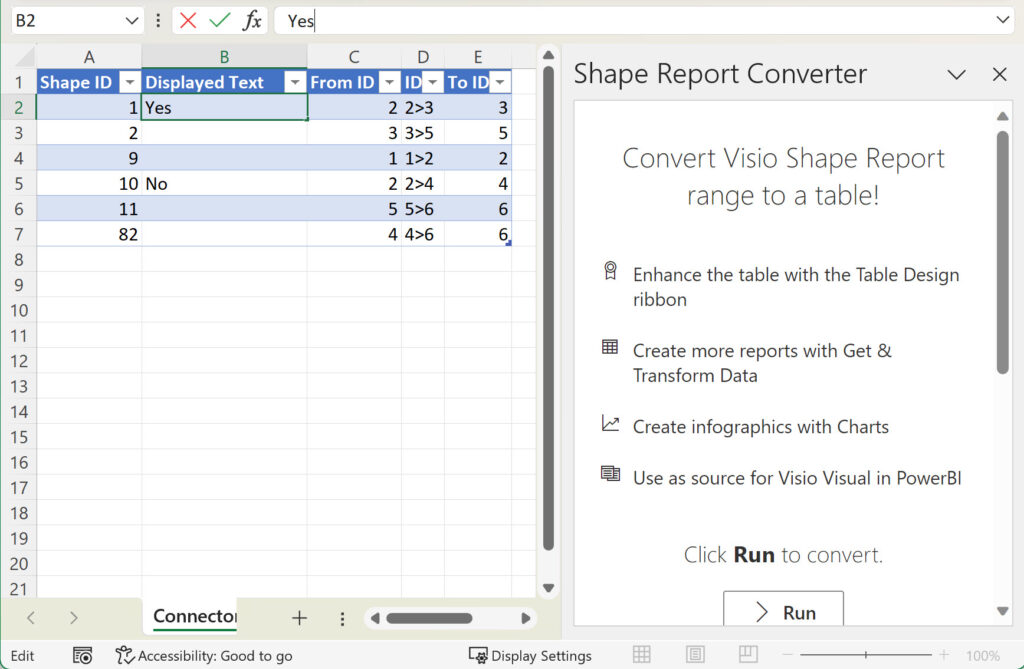
End SubYou may already have data for each connector, but you can also create a basic table that contains each connection using a Shape Report, and then maybe use my free Shape Report Converter to turn the export into a proper table, suitable for enhancing with more data.
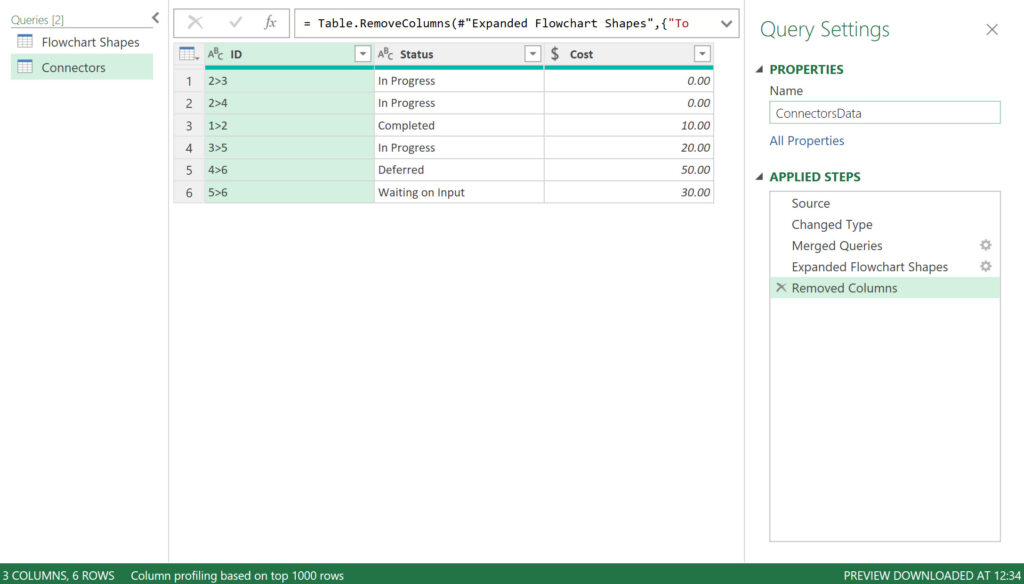
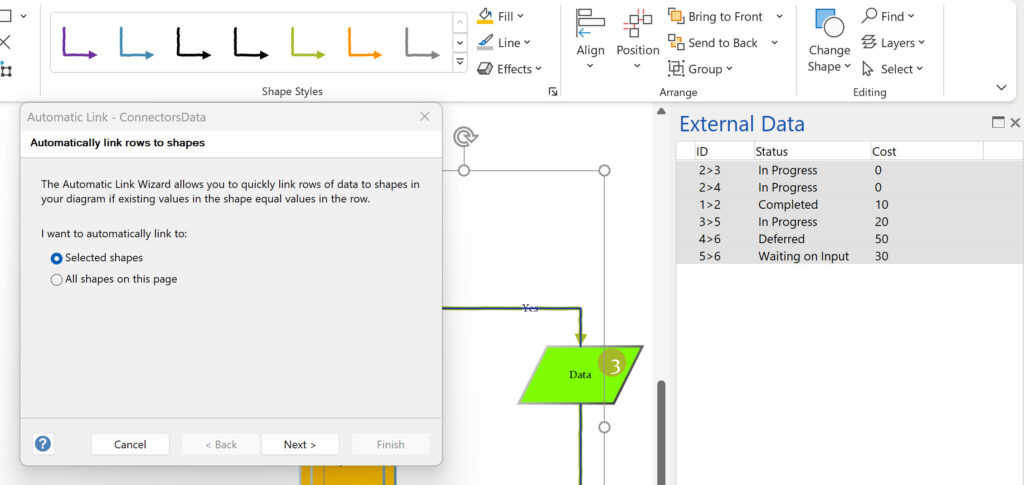
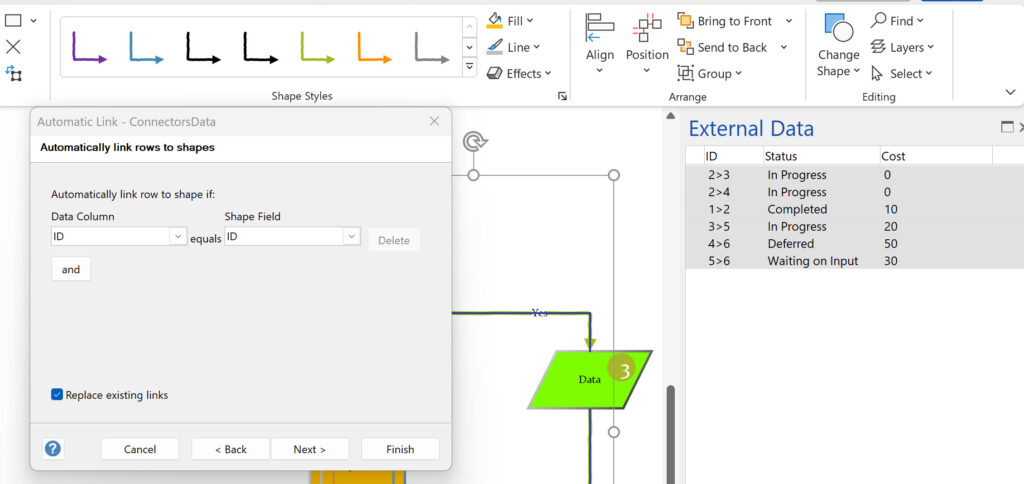
The next task is to use Data | External Data | Custom Import to link a table to Visio, and link to the connector shapes, as shown below.
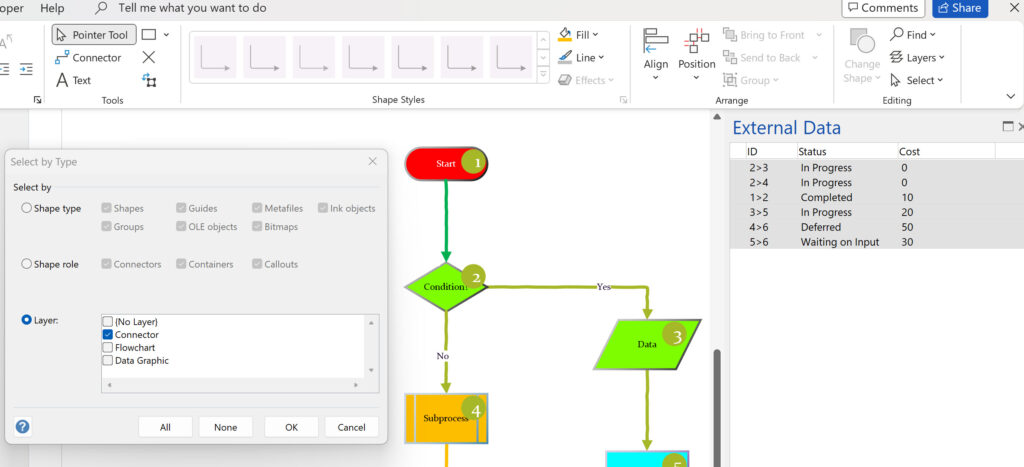
Now, you will find that Visio may automatically create some Data Graphics when it adds Shape Data to each connector, but you can configure them to suit your circumstance.
So, what has happened? Visio automatically added some User-Defined Cells and Shape Data rows to each data-linked connector. It creates a ShapeSheet formula in the User.visDGCBVFill cell to evaluate the values in the Color By Value settings, and then the LineColor cell gets the resultant colour value from this cell. Note that the contents of the cells that have values just for the instance of the master shape are displayed in blue automatically.
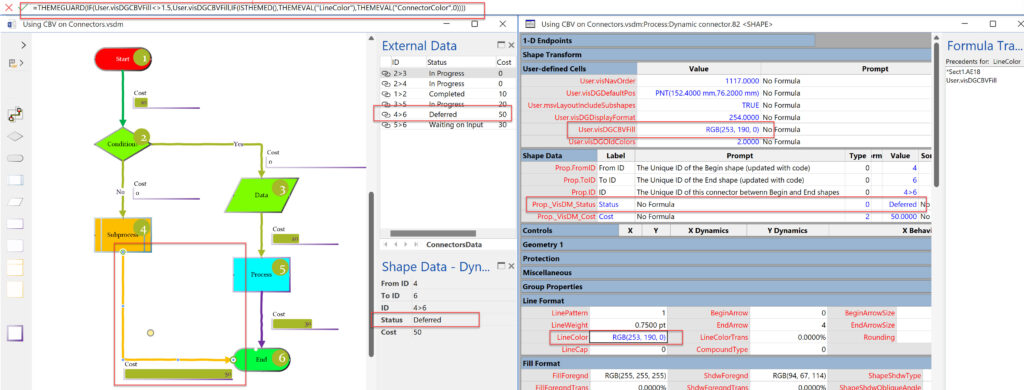
As you can see, Color By Value is not the only Data Graphic that can be applied to connector lines … you can also use the Data Bars, Icon Sets and Text callouts too….
So, as you can see, Data Graphics can be applied to connectors too!
A word of caution for Data Visualizer users: You cannot use the data linking technique explained in this article to do add more links to the connectors under the control of Data Visualizer. However, there is a work around, which I will explain in a future article.
Related articles

A visual exploration of Penrose Tiling in Visio
Maybe it is because I used to be a building architect, but I have always been fascinated by the relationship between numbers and visualisations. Perhaps the most famous one is the Golden Ratio which has been used as the basis of many building designs and art pieces. It is often recognised to create a harmony…
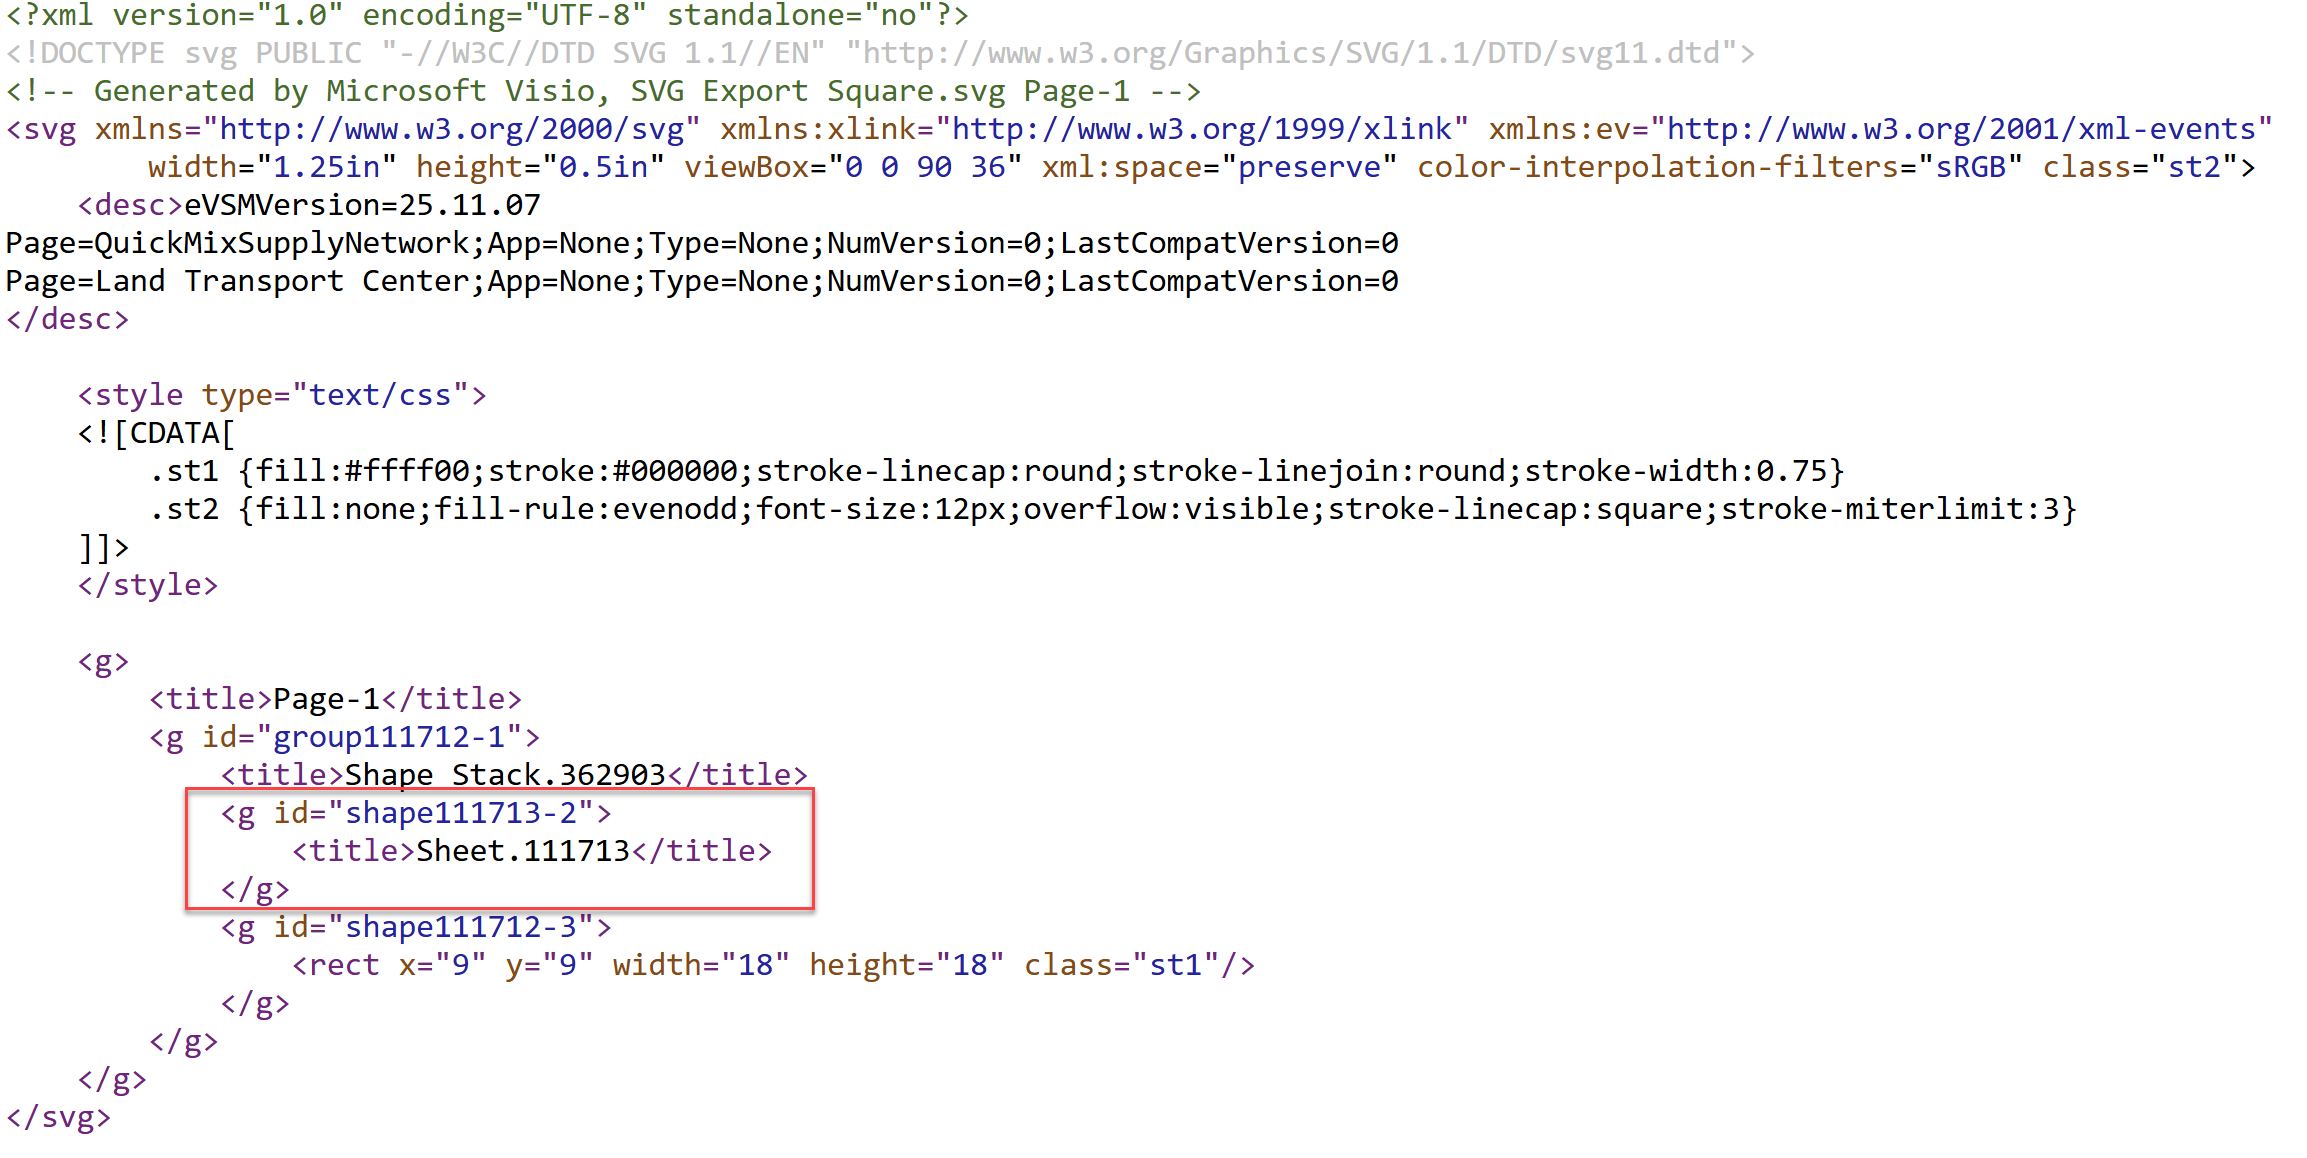
How SVG in Visio can cause a Shape.BoundingBox(…) error
I have used Visio’s Shape.BoundingBox(…) for many, many years and I cannot ever recall it failing, but I have now managed to create some shapes that cause it to error. This caused many hours of confusion, so I nearly abandoned using the method, until I discussed it with my fellow Visio MVP, John Goldsmith (see…
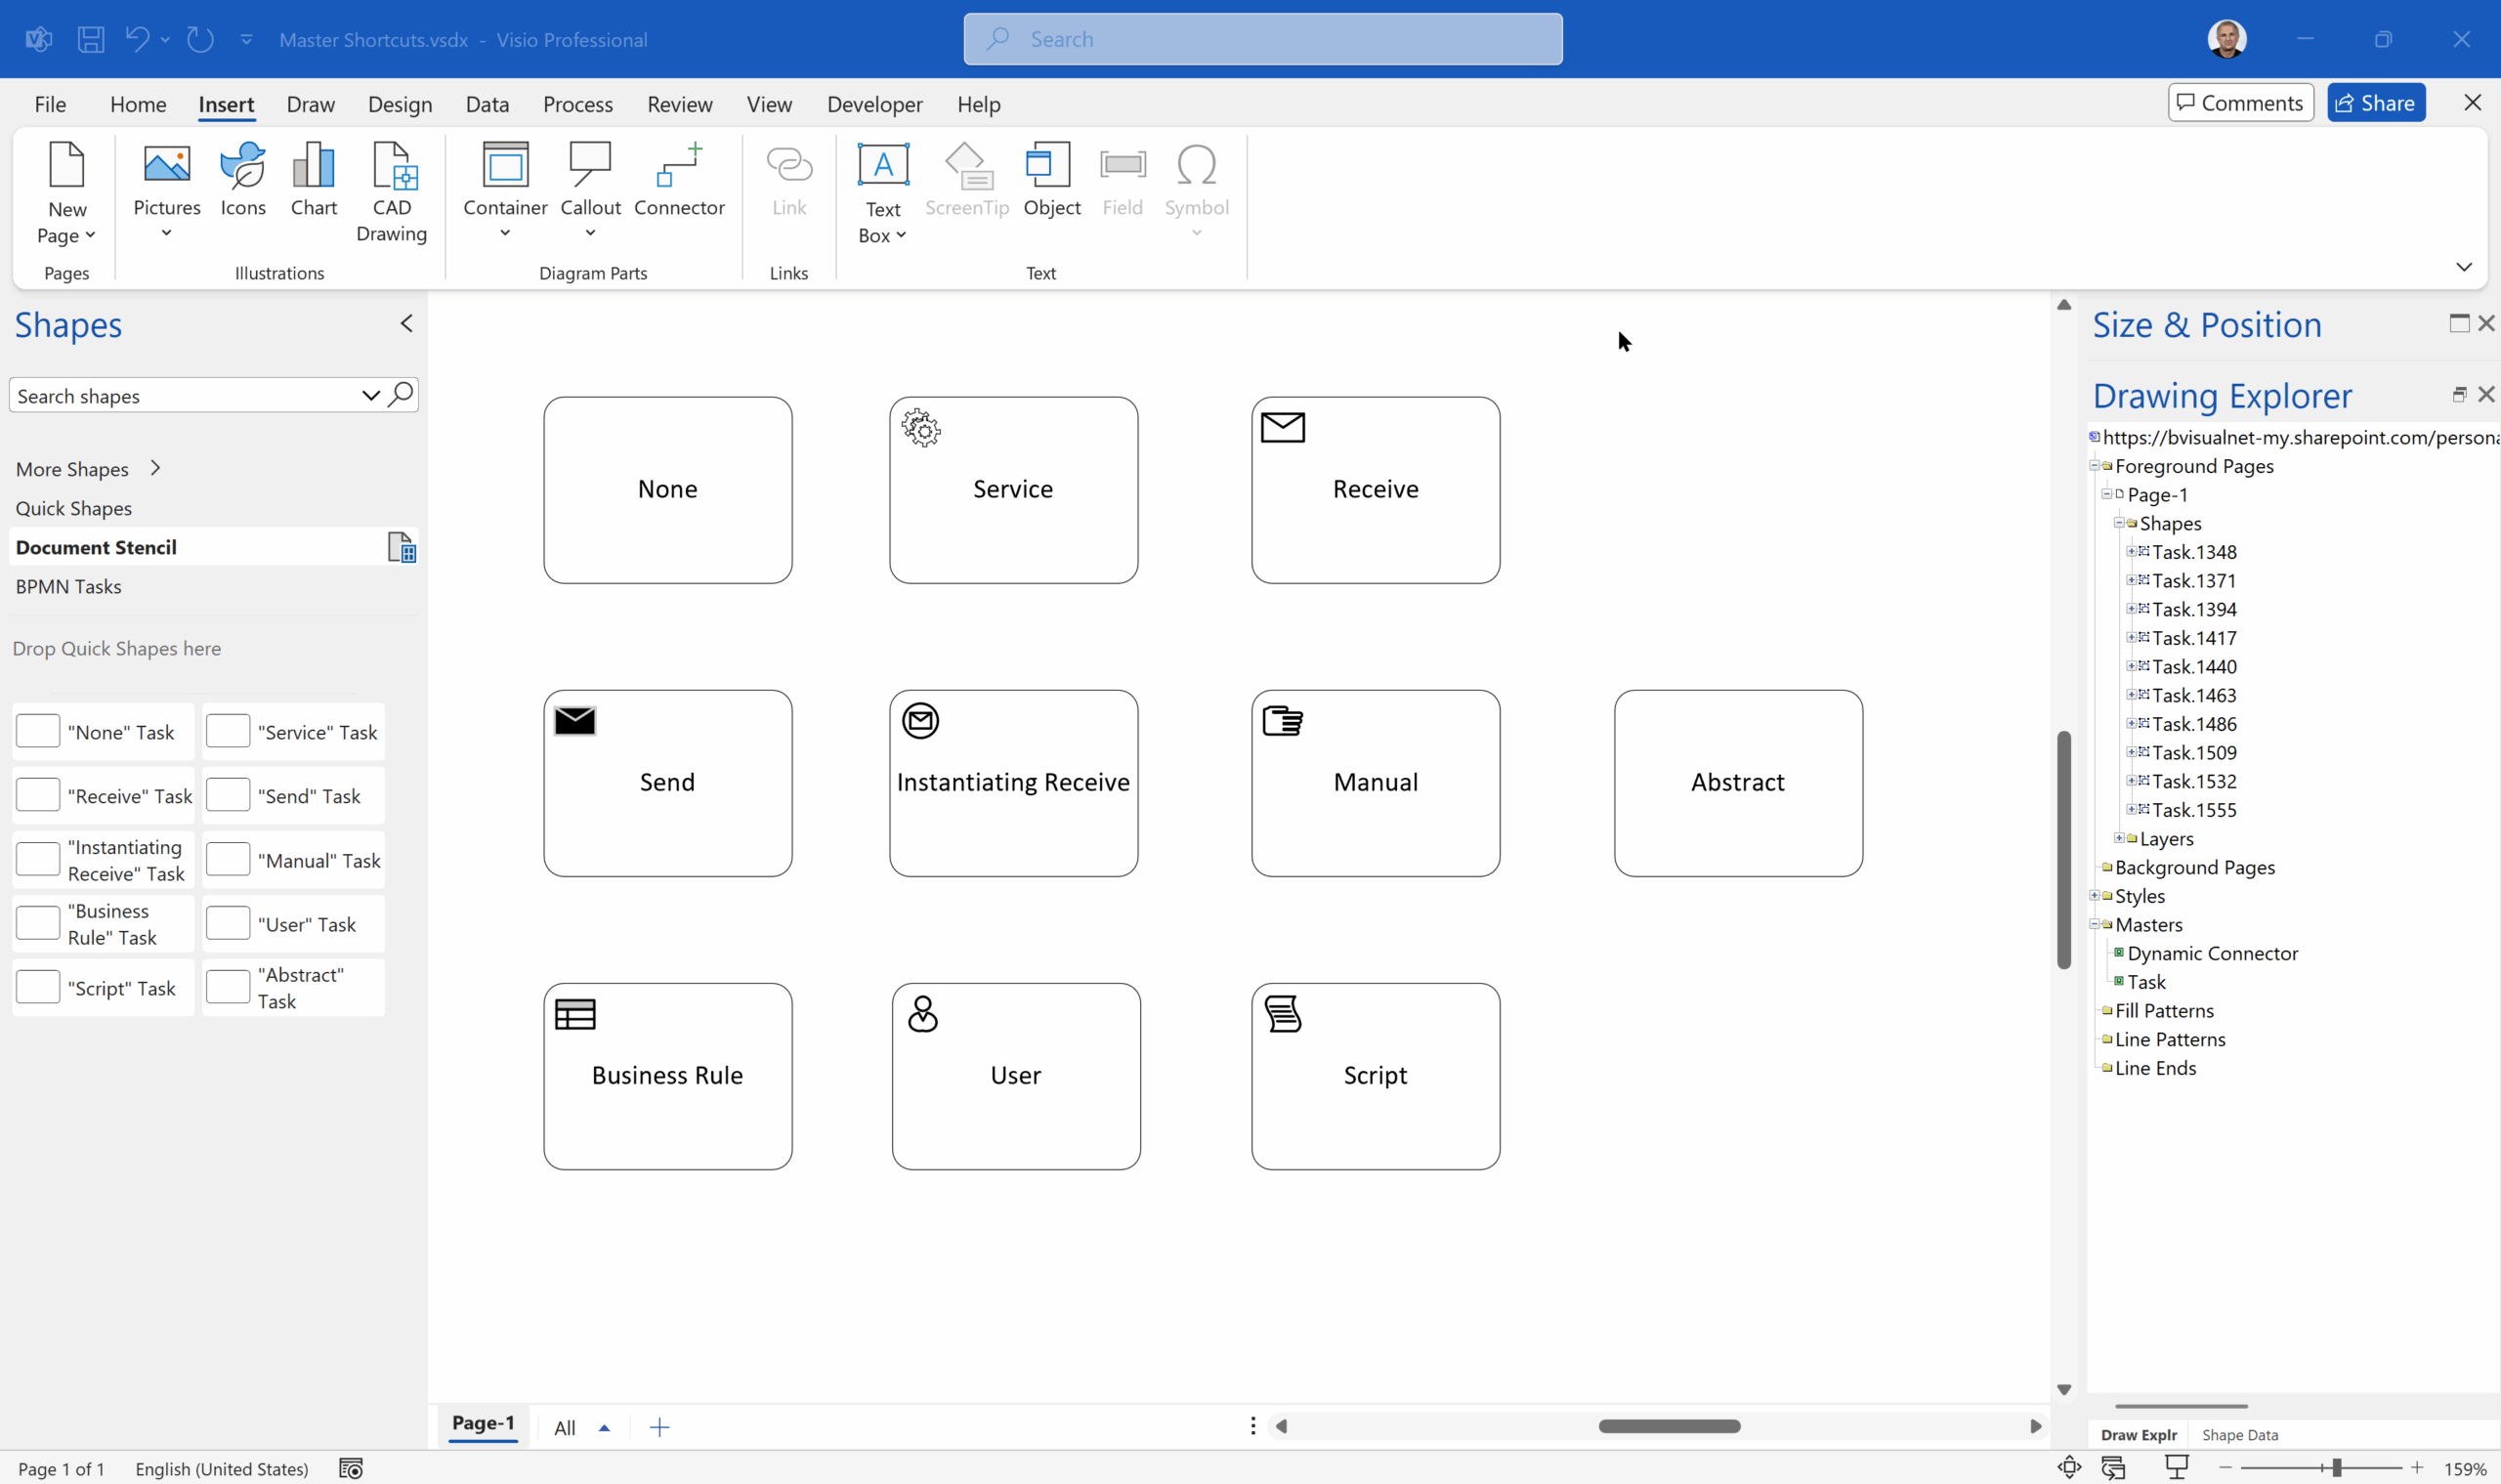
Are Master Shortcuts useful in Visio?
Many Visio users may not even understand the question, but this almost hidden feature has been available for many years. A Master Shortcut looks like a normal Master in a stencil, but it is merely holds a reference to another Master in a Stencil, not necessarily the same one, and has an option to add…

Jumping between Shapes in Visio
Many Visio diagrams get quite large, and sometimes it is useful to provide the ability to jump to another shape quickly in the same document, either on a different page or on the same one. Although there is an add-on provided in desktop Visio that is used by the Off-Page Reference shape provided in the…

Co-authoring and Commenting with Visio Documents
Microsoft Visio can be used in the web browser and on the desktop, but there are several licensing options available, so which ones can be used concurrently whilst supporting co-authoring and commenting? This article tests the various scenarios but assumes that the Visio documents are stored in OneDrive for Business or SharePoint Online\Teams. The Microsoft…
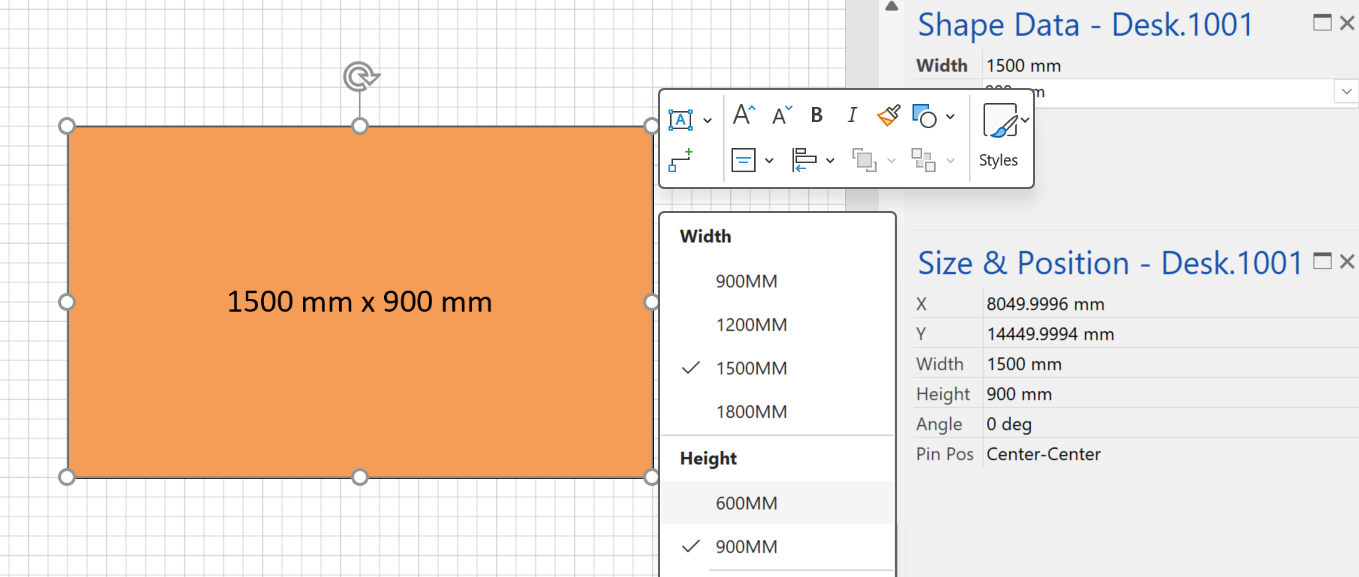
Fixing dimensions of 2D shapes
I am often asked what makes Visio unique and makes it stand out from the crowd, especially in today’s online world. Well, I think there are many reasons, but one of them is the ability to create scaled drawings with parametric components of specific dimensions. This was crucial for my adoption of Visio back in…
Leave a Reply
You must be logged in to post a comment.