• Skip to main content
  • Skip to primary sidebar
  • Skip to footer

bVisual

  • Home
  • Services
    • How Visio smartness can help your business
    • Visio visual in Power BI
    • Visio Consulting Services
    • Visio Bureau Services
    • Visio Training and Support Services
  • Products
    • Visio Shape Report Converter
    • SS Plus
    • LayerManager
    • visViewer
    • Metro Icons
    • Rules Tools for Visio
    • The Visio 2010 Sessions App
    • Multi-Language Text for Visio
    • Document Imager for Visio
    • multiSelect for Visio
    • pdSelect for Visio
  • Case Studies
    • Case studies overview
    • Using Visio in Education for GIS
    • Visualizing Construction Project Schedules
    • Visio Online Business Process Mapping
    • Nexans Visio Template
    • CNEE Projects, WorldCom
    • Chase Manhattan Bank
  • News
    • Recent news
    • News archive
  • Resources
    • Articles➡
      • ShapeSheet Functions A-Z
      • Comparing Visio for the Web and Desktop
      • Customising Visio Shapes for the Web App
      • Key differences between the Visio desktop and web apps
      • Using the Visio Data Visualizer in Excel
      • Using Visio in Teams
      • Creating Visio Tabs and Apps for Teams with SharePoint Framework (SPFx)
      • Designing Power Automate Flows with Microsoft Visio
      • Innovative uses of Visio Lists
    • Webcasts ➡
      • Visio in Organizations
      • My session and other Visio sessions at MSIgnite 2019
      • Power up your Visio diagrams
      • Vision up your Visio diagrams
      • The Visio 2010 MVP Sessions
    • Visio Web Learning Resources
    • Books➡
      • Visualize Complex Processes with Microsoft Visio
      • Mastering Data Visualization with Microsoft Visio
      • Microsoft Visio Business Process Diagramming and Validation
      • Visualizing Information with Microsoft Visio
  • Blog
    • Browse blog articles
    • Visio Power BI articles
    • Visio for Web articles
    • A history of messaging and encryption
  • About us
    • About bVisual
    • Testimonials
    • Bio of David Parker
    • Contact Us
    • Website Privacy Policy
    • Website terms and conditions
    • Ariba Network
You are here: Home / Visio / Using EVALCELL() in Visio to calculate Workdays

Published on June 15, 2018 by David Parker

Using EVALCELL() in Visio to calculate Workdays

I recently agreed to calculate the number of workdays between two dates in Visio, without realising how difficult it is. Excel users are lucky because it has the NETWORKDAYS() function, but Visio users are not so fortunate. However, Visio does have the EVALCELL function which can be extremely useful in cases like this. I got the inspiration from one of the answers in StackOverflow for a SQL user who also needed a solution.

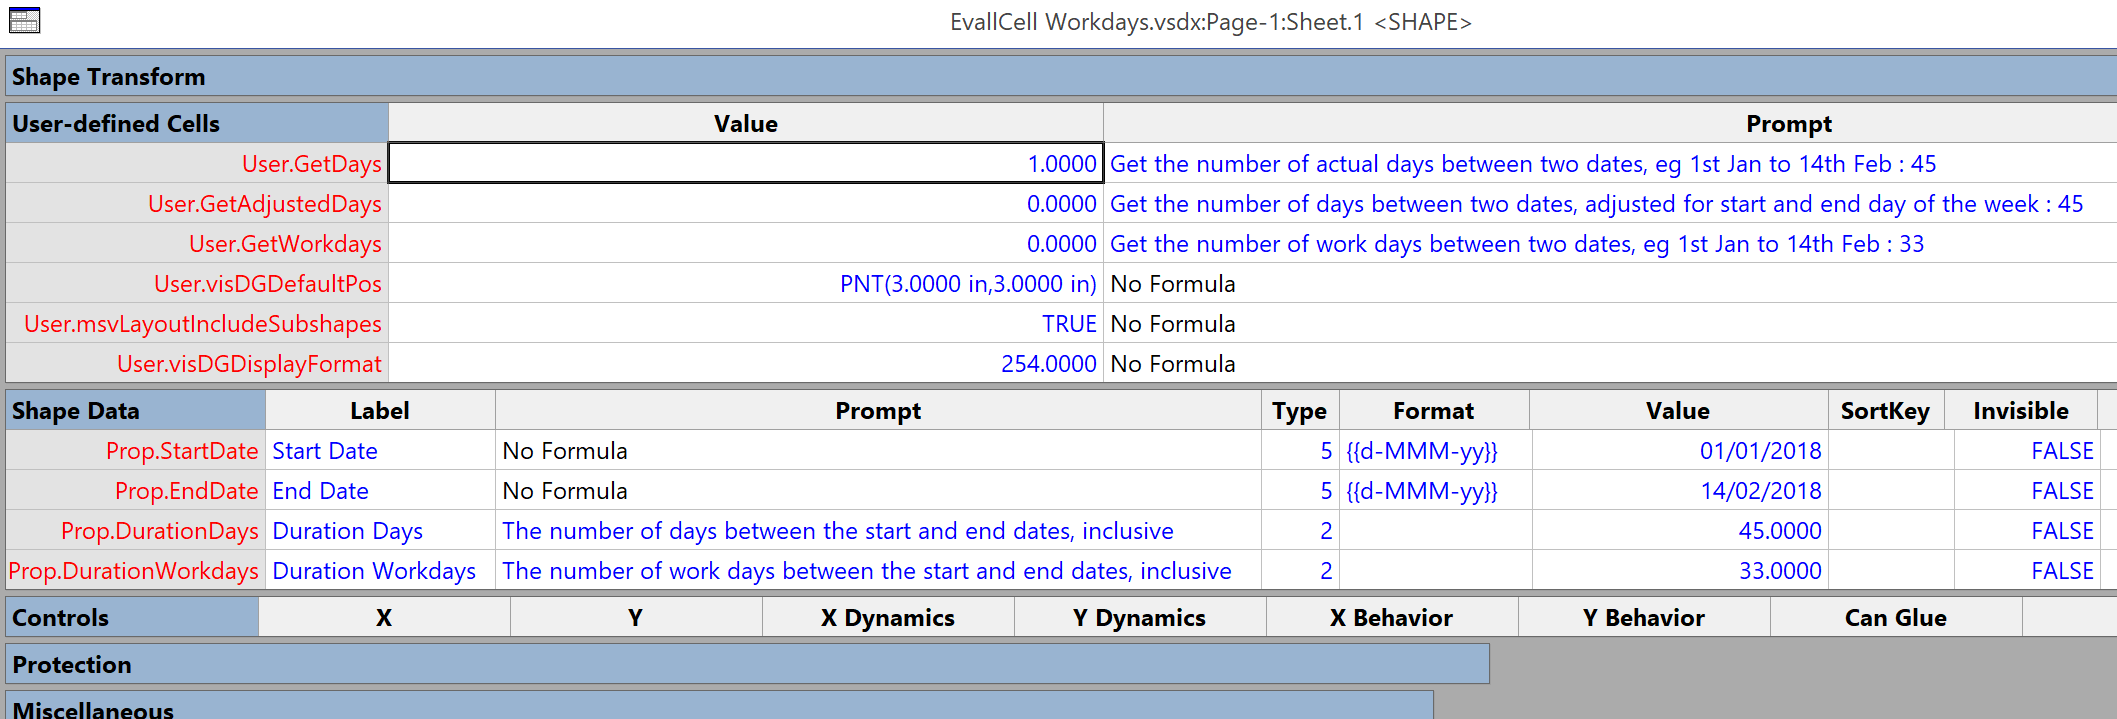
First, I created a GetDays User-defined Cell row to calculate the number of inclusive days between two dates. This function requires two dates passed through as the start and end arguments.

User.GetDays

=INT(((DATEVALUE(ARG("e"))+1)-DATEVALUE(ARG("s")))/1 ed)
User.GetDays.Prompt
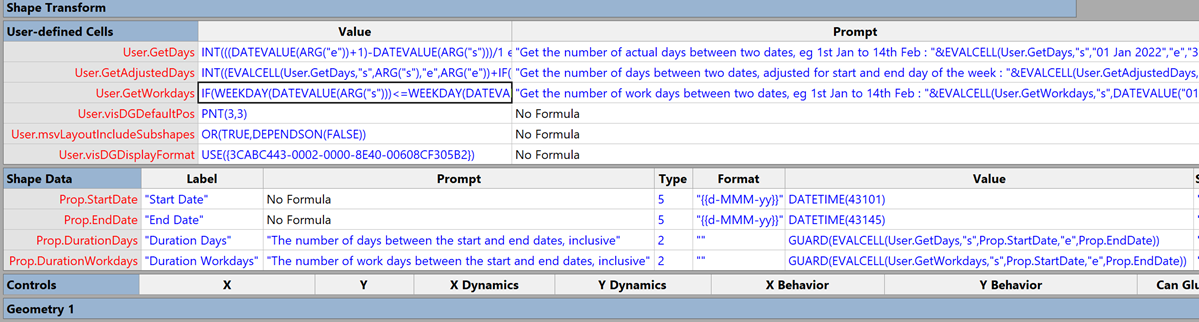
="Get the number of actual days between two dates, eg 1st Jan to 14th Feb : "&EVALCELL(User.GetDays,"s","01 Jan 2018","e","14 Feb 2018")

Second, I created a GetAdjustedDays User-defined cell row to provide the necessary addition of 1 day if the start date falls on a Sunday, and the subtraction of 2 days or 1 days if the end date falls on a Sunday or Saturday respectively.

User.GetAdjustedDays

=INT((EVALCELL(User.GetDays,"s",ARG("s"),"e",ARG("e"))+IF(WEEKDAY(DATEVALUE(ARG("s")))=7,1,0)-IF(WEEKDAY(DATEVALUE(ARG("e")))=7,2,IF(WEEKDAY(DATEVALUE(ARG("e")))=6,1,0))))

User.GetAdjustedDays.Prompt

="Get the number of days between two dates, adjusted for start and end day of the week : "&EVALCELL(User.GetAdjustedDays,"s","01 Jan 2018","e","14 Feb 2018")

Thirdly, I used the formula from my earlier article,Prototyping Visio ShapeSheet Formulas in Excel , the GetWorkdays User-defined Cell row to fully calculate the number of workdays (weekdays) between two dates.

User.GetWorkdays

=IF(WEEKDAY(DATEVALUE(ARG("s")))<=WEEKDAY(DATEVALUE(ARG("e"))),(FLOOR(INT(DATEVALUE(ARG("e"))-DATEVALUE(ARG("s")))/7)*5)+MAX(MIN(WEEKDAY(DATEVALUE(ARG("e")))+1,6)-WEEKDAY(DATEVALUE(ARG("s"))),0),(FLOOR(INT(DATEVALUE(ARG("e"))-DATEVALUE(ARG("s")))/7)*5)+MIN((WEEKDAY(DATEVALUE(ARG("e")))+6)-MIN(WEEKDAY(DATEVALUE(ARG("s"))),6),5))/1 ed

User.GetWorkdays.Prompt

="Get the number of work days between two dates, eg 1st Jan to 14th Feb : "&EVALCELL(User.GetWorkdays,"s","01 Jan 2018","e","14 Feb 2018")

This means that I can now include these User-defined Cell rows in any shape that I need to calculate the number of workdays for.
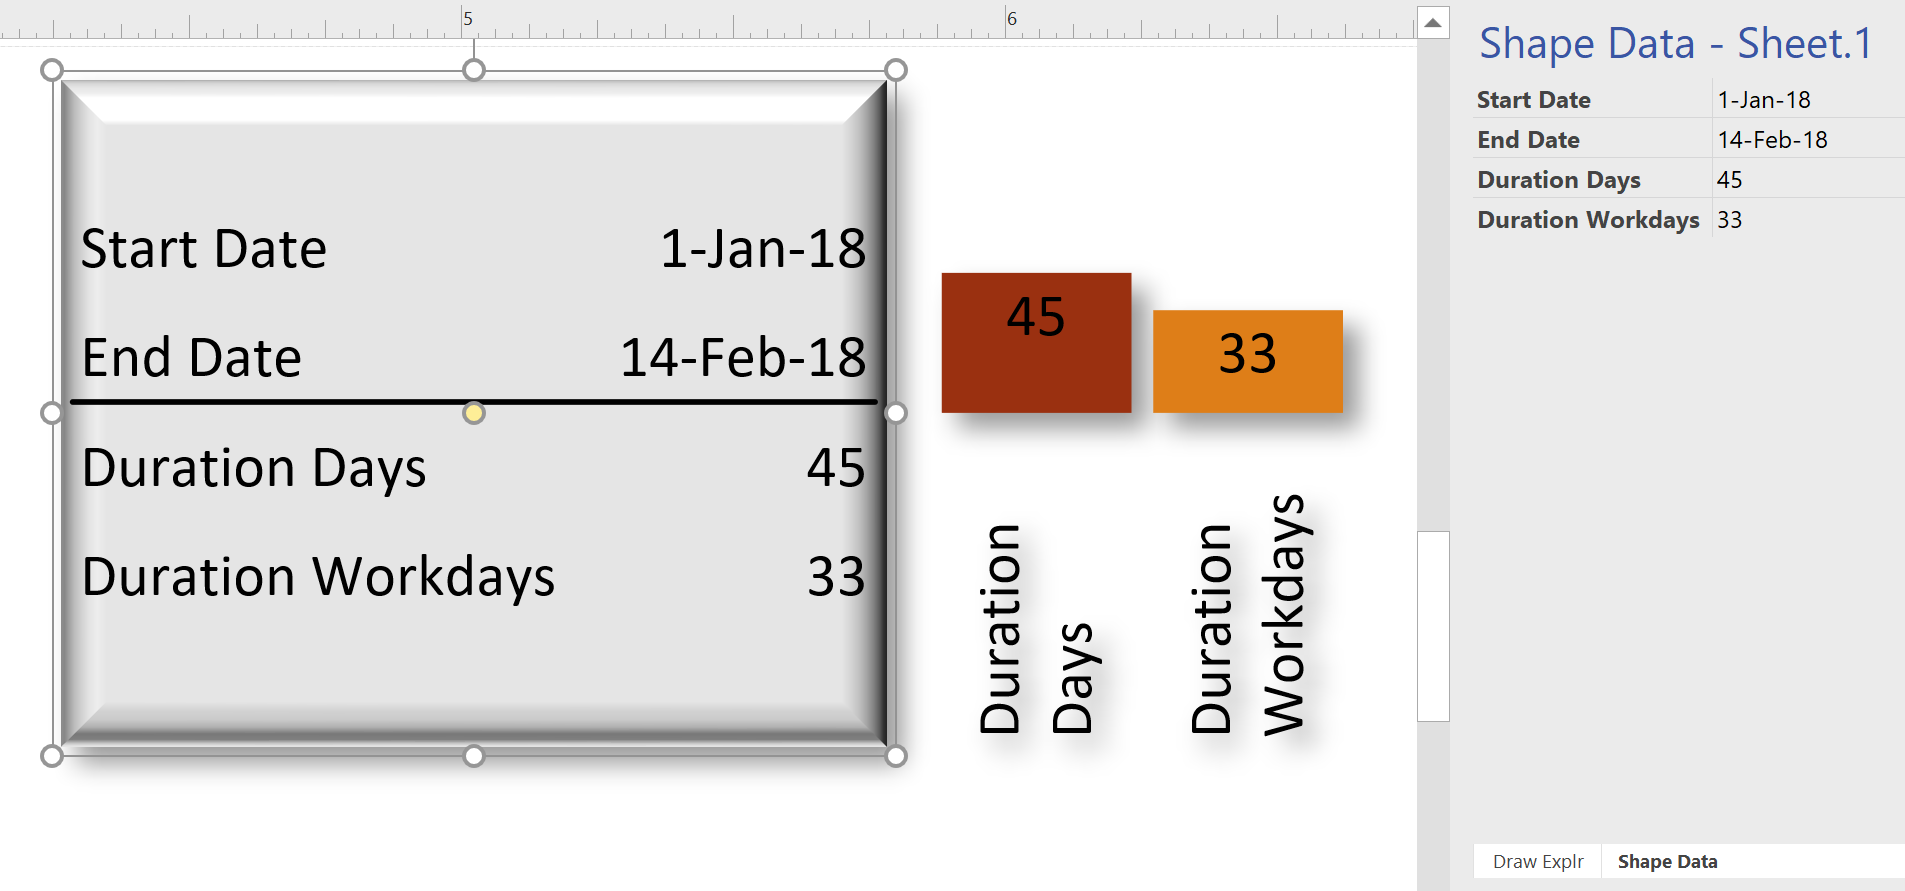
For example, if I have a shape with Start Date and End Date Shape Data rows, I can call either the User.GetDays or User.GetWorkdays functions using the EVALCELL() function.

Prop.DurationDays.Value

=GUARD(EVALCELL(User.GetDays,"s",Prop.StartDate,"e",Prop.EndDate))

Prop.DurationWorkdays.Value

=GUARD(EVALCELL(User.GetWorkdays,"s",Prop.StartDate,"e",Prop.EndDate))

Of course, I guarded these formulas because I do not want a user to accidently overwrite them.
 

Related

Filed Under: ShapeSheet Formulas, TimeTable, Visio Tagged With: ShapeSheet Functions

About David Parker

David Parker has 25 years' experience of providing data visualization solutions to companies around the globe. He is a Microsoft MVP and Visio expert.

Reader Interactions

Comments

  1. Dom says

    August 7, 2023 at 4:30 pm

    Hi,

    I’m trying to create a swim-lane-esque visual in Visio to show project data on shapes. The first swim-lane will show a timeline and the subsequent swim-lanes will be categories with each project sitting on a shape in one of these lanes.

    Project managers will update project data which will sit in a SharePoint list.

    I want to know if it’s possible to link the list to all the shapes (there will be 100+) and move dynamically based on the start and end date (so the shape length will be dictated by the length of the project). I have these dates under Start Date and End Date in the SharePoint list.

    I know how to get the dates to show as text on the shape itself, but unsure how to get them to dynamically move based off these dates, kind of like a gantt view.

    Is this possible?

    Thanks

    Dom

    Log in to Reply
    • David Parker says

      August 30, 2023 at 10:38 am

      I do this by setting the X Grid to be Fixed width, and each X grid = 1 day. Then the Start Date can be calculated from a Page Start Date property and the Width = (End Date – Start Date). I set the LocPinX of the shapes to 0, so they always drop at the Start date position.

      Log in to Reply

Leave a Reply Cancel reply

You must be logged in to post a comment.

Primary Sidebar

  • LinkedIn
  • Twitter

Recent Posts

  • Co-authoring and Commenting with Visio Documents
  • Fixing dimensions of 2D shapes
  • Merging Linked Data from Similar Tables
  • Smart Radio Buttons and Check Boxes in Visio
  • Using Button Face Ids in Visio

Categories

Tags

Accessibility Add-Ins Connectors Containers Data Export Data Graphics Data Import Data Visualizer Educational Excel GraphDatabase Hyperlinks Icon Sets JavaScript LayerManager Layers Legend Link Data to Shapes Lists MSIgnite MVP Office365 Org Chart PowerApps PowerBI PowerQuery Processes Setup and Deployment Shape Data Shape Design ShapeSheet ShapeSheet Functions SharePoint 2013 SQL Teams Validation VBA Video Visio Visio 2007 Visio for the Web Visio Online Visio Services Visio Viewer Webinar

Footer

bVisual Profile

The UK-based independent Visio consultancy with a worldwide reach. We have over 25 years experience of providing data visualization solutions to companies around the globe.

Learn more about bVisual

  • Amazon
  • E-mail
  • Facebook
  • LinkedIn
  • Twitter
  • YouTube

Search this website

Recent posts

  • Co-authoring and Commenting with Visio Documents
  • Fixing dimensions of 2D shapes
  • Merging Linked Data from Similar Tables
  • Smart Radio Buttons and Check Boxes in Visio
  • Using Button Face Ids in Visio

Copyright © 2025 · Executive Pro on Genesis Framework · WordPress · Log in