• Skip to main content
  • Skip to primary sidebar
  • Skip to footer

bVisual

  • Home
  • Services
    • How Visio smartness can help your business
    • Visio visual in Power BI
    • Visio Consulting Services
    • Visio Bureau Services
    • Visio Training and Support Services
  • Products
    • Visio Shape Report Converter
    • SS Plus
    • LayerManager
    • visViewer
    • Metro Icons
    • Rules Tools for Visio
    • The Visio 2010 Sessions App
    • Multi-Language Text for Visio
    • Document Imager for Visio
    • multiSelect for Visio
    • pdSelect for Visio
  • Case Studies
    • Case studies overview
    • Using Visio in Education for GIS
    • Visualizing Construction Project Schedules
    • Visio Online Business Process Mapping
    • Nexans Visio Template
    • CNEE Projects, WorldCom
    • Chase Manhattan Bank
  • News
    • Recent news
    • News archive
  • Resources
    • Articles➡
      • ShapeSheet Functions A-Z
      • Comparing Visio for the Web and Desktop
      • Customising Visio Shapes for the Web App
      • Key differences between the Visio desktop and web apps
      • Using the Visio Data Visualizer in Excel
      • Using Visio in Teams
      • Creating Visio Tabs and Apps for Teams with SharePoint Framework (SPFx)
      • Designing Power Automate Flows with Microsoft Visio
      • Innovative uses of Visio Lists
    • Webcasts ➡
      • Visio in Organizations
      • My session and other Visio sessions at MSIgnite 2019
      • Power up your Visio diagrams
      • Vision up your Visio diagrams
      • The Visio 2010 MVP Sessions
    • Visio Web Learning Resources
    • Books➡
      • Visualize Complex Processes with Microsoft Visio
      • Mastering Data Visualization with Microsoft Visio
      • Microsoft Visio Business Process Diagramming and Validation
      • Visualizing Information with Microsoft Visio
  • Blog
    • Browse blog articles
    • Visio Power BI articles
    • Visio for Web articles
    • A history of messaging and encryption
  • About us
    • About bVisual
    • Testimonials
    • Bio of David Parker
    • Contact Us
    • Website Privacy Policy
    • Website terms and conditions
    • Ariba Network
You are here: Home / Visio / Visio Map of the World Update

Published on January 27, 2014 by David Parker

Visio Map of the World Update

My earlier post about the world in Visio shapes, see http://blog.bvisual.net/2013/08/16/visio-map-of-the-world/ , has been one of my most popular, and a reader recently asked about changing the colour of countries by data not in my original worksheet, and another asked about adding labelled dots.

Well, at first, I thought it would be quite simple to add more Data Graphics with the Color By Value that I already had, but then I realised that I needed to adjust some of the shapes that I had created from SVG in my previous article.

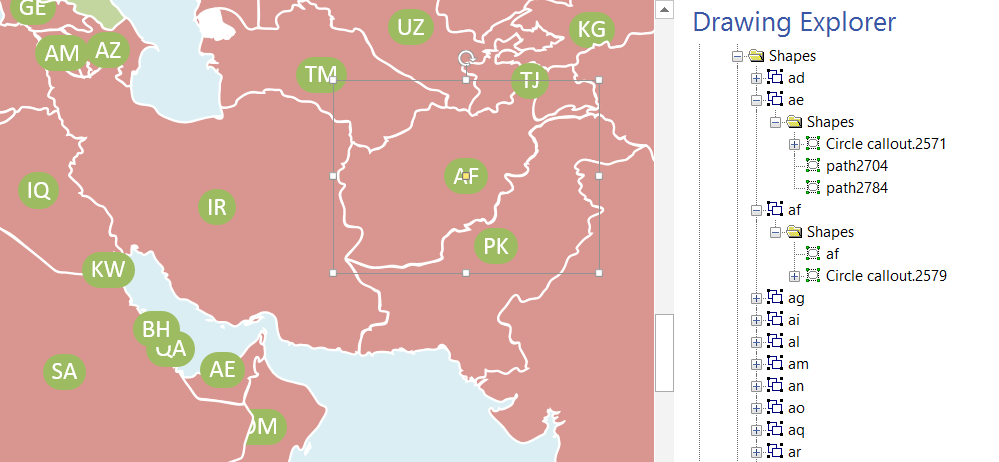
The problem is that some of the country shapes which were converted from SVG have geometry at the top group level. This means that any Data Graphic items, other than Color By Value, are actually sub-shapes of the group and will be hidden by the country shape itself. That is probably why the Data Graphics task, on the selected Afghanistan shape below, sent the AF label over to the right of it, whereas all the group shapes with all their geometry in sub-shapes, such as the AE (United Arab Emirates) shape, placed the label in its centre.

image

Therefore, I wrote some VBA code to move the geometry out of the top-level group shape into a new sub-shape, which then allowed the Data Graphic task to position the graphic items over the group shape. Notice that the af shape in the Drawing Explorer below now has a subshape, also called af.

image

I have listed the code below, and it can be run against the earlier version of the world map that I posted.

Public Sub FixSVGGroups()
Dim shpGroup As Visio.Shape
Dim shpNew As Visio.Shape
Dim iSect As Integer
Dim iRow As Integer
Dim iCell As Integer
Dim iNewSect As Integer
Dim iNewRow As Integer
Dim iNewCell As Integer
Dim lastSect As Integer
'Check all shapes on the page
For Each shpGroup In Visio.ActivePage.Shapes
    If shpGroup.Type = Visio.VisShapeTypes.visTypeGroup Then
        'Ensure that it is a valid country shape
        If shpGroup.CellExists("Prop._VisDM_ID", _
            Visio.VisExistsFlags.visExistsAnywhere) _
            And shpGroup.SectionExists(Visio.visSectionFirstComponent, _
                Visio.VisExistsFlags.visExistsAnywhere) Then
            'Need to move the geometry sections to a sub-shape
            'Draw a rectangle (easiest shape)
            Set shpNew = shpGroup.DrawRectangle( _
                0, 0, _
                shpGroup.Cells("Width").ResultIU, _
                shpGroup.Cells("Height").ResultIU)

            'Remove the dummy rectangle
            shpNew.DeleteSection Visio.visSectionFirstComponent
            For iSect = Visio.visSectionFirstComponent To _
                Visio.visSectionLastComponent
                If shpGroup.SectionExists(iSect, _
                    Visio.VisExistsFlags.visExistsAnywhere) = 0 Then
                    lastSect = iSect - 1
                    Exit For
                End If
                shpNew.AddSection iSect
                For iRow = 0 To shpGroup.RowCount(iSect) - 1
                    shpNew.AddRow iSect, iRow, shpGroup.RowType(iSect, iRow)
                    For iCell = 0 To shpGroup.RowsCellCount(iSect, iRow) - 1
                        shpNew.CellsSRC(iSect, iRow, iCell).FormulaU = _
                            shpGroup.CellsSRC(iSect, iRow, iCell).FormulaU
                    Next iCell
                Next iRow
            Next iSect
            
            iSect = Visio.visSectionObject
            iRow = Visio.VisRowIndices.visRowFill
            
            For iCell = 0 To shpNew.RowsCellCount(iSect, iRow) - 1
                shpNew.CellsSRC(iSect, iRow, iCell).FormulaU = _
                    "=" & shpGroup.NameID & "!" & _
                        shpNew.CellsSRC(iSect, iRow, iCell).Name
            Next iCell
            
            iRow = Visio.VisRowIndices.visRowLine
            For iCell = 0 To shpNew.RowsCellCount(iSect, iRow) - 1
                shpNew.CellsSRC(iSect, iRow, iCell).FormulaU = _
                    "=" & shpGroup.NameID & "!" & _
                        shpNew.CellsSRC(iSect, iRow, iCell).Name
            Next iCell
            
            'Delete geometry sections from the group
            For iSect = lastSect To Visio.visSectionFirstComponent Step -1
                shpGroup.DeleteSection iSect
            Next
            
            shpGroup.UpdateAlignmentBox
            
            If shpGroup.CellExists("Controls.msvDGPosition.X", _
                    Visio.visExistsAnywhere) Then
                shpGroup.Cells("Controls.msvDGPosition.X").Formula = _
                    shpGroup.Cells("Width").ResultIU * 0.5
                shpGroup.Cells("Controls.msvDGPosition.Y").Formula = _
                    shpGroup.Cells("Height").ResultIU * 0.5
            End If
            shpNew.Name = shpGroup.Name
            
        End If
    End If
Next
End Sub

So, now that I have a map that can utilise more than just Color By Value Data Graphics, I added extra columns of data from a second worksheet to the existing country Shape Data from my earlier post.

image

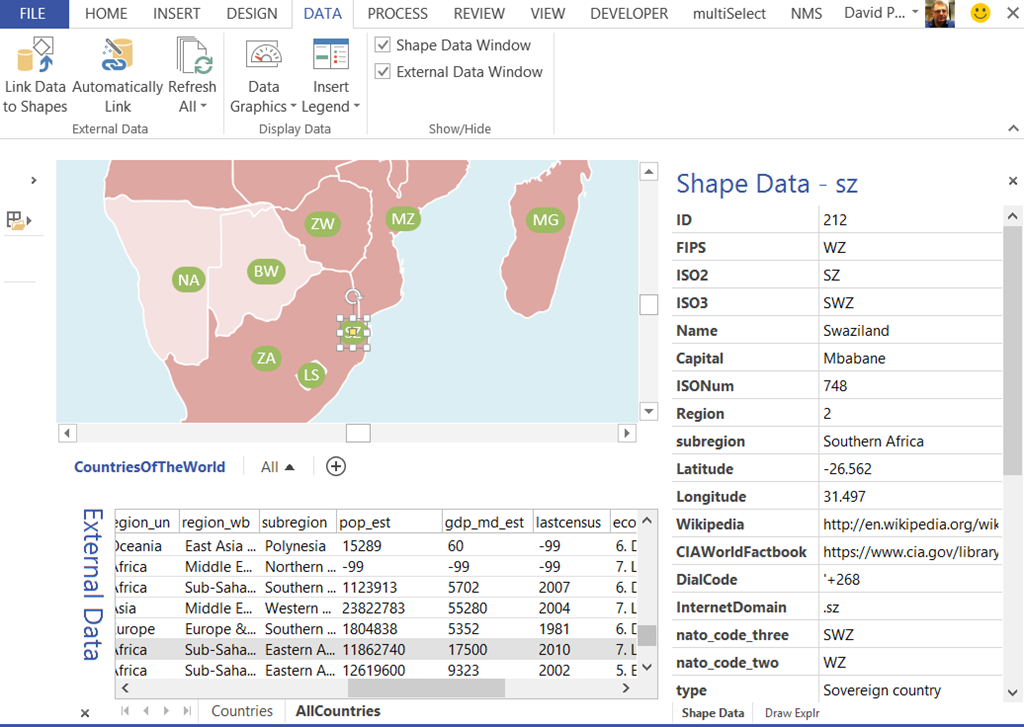
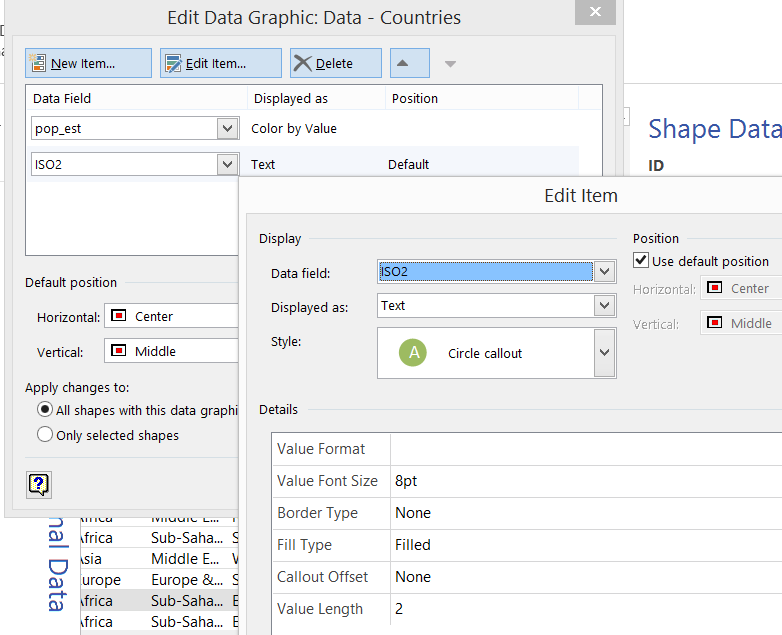
One of these extra columns contains the estimated population, so I changed the Data Graphics to display the population as Color By Value, and the ISO2 code as a Circle callout, with a Value Length = 2.

image

This results in a rather nice world display of population size per country.

image

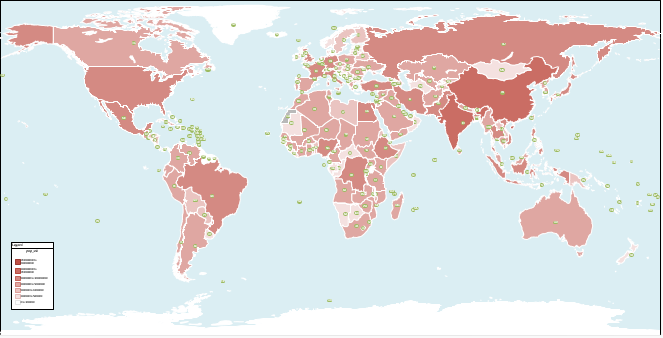
To complete the map, I added a legend using the DATA ribbon button, but was not thrilled with the default appearance, so I edited it, just by selecting the elements and overtyping.

image
image
Default LegendEdited Legend

This is a link to the WorldPopulation Visio 2013 document : WorldPopulation.vsdx

I have updated the original BlankWorld.vsdx file in the first article.

Related

Filed Under: Geographic, Visio Tagged With: Data Graphics, Link Data to Shapes, Visio 2010, Visio 2013

About David Parker

David Parker has 25 years' experience of providing data visualization solutions to companies around the globe. He is a Microsoft MVP and Visio expert.

Reader Interactions

Comments

  1. Fredrik Öhgren says

    April 16, 2014 at 10:12 am

    Hi David,

    Thank you for your blog. This is exactly what i was looking for. I’m working in Visio 2010 and I wonder if it is possible to extract the “External Data” from the vsd-file to an Excel-file and re-link it. How can I else edit/add data?

    best regards,
    Fredrik Öhgren

    Reply
  2. Sadettin says

    September 26, 2015 at 2:06 pm

    Hey David,

    I just wanted to thank you. This helped me a lot during my master’s thesis 🙂

    Kind regards

    Sadettin

    Reply
  3. Kevin says

    February 10, 2021 at 10:09 am

    Hi David,
    hope you are sound and safe.

    Nice work! Any chance you make this download available again?

    Cheers,
    Kevin

    Reply

Trackbacks

  1. Visio Map of the World | bVisual says:
    March 3, 2014 at 6:31 pm

    […] UPDATE : http://blog.bvisual.net/2014/01/27/visio-map-of-the-world-update […]

    Reply

Leave a Reply Cancel reply

Your email address will not be published. Required fields are marked *

Primary Sidebar

  • LinkedIn
  • Twitter

Recent Posts

  • Fixing dimensions of 2D shapes
  • Merging Linked Data from Similar Tables
  • Smart Radio Buttons and Check Boxes in Visio
  • Using Button Face Ids in Visio
  • Grid Snapping Revisited

Categories

Tags

Accessibility Add-Ins Connectors Containers Data Export Data Graphics Data Import Data Visualizer Educational Excel GraphDatabase Hyperlinks Icon Sets JavaScript LayerManager Layers Legend Link Data to Shapes Lists MSIgnite MVP Office365 Org Chart PowerApps PowerBI PowerQuery Processes Setup and Deployment Shape Data Shape Design ShapeSheet ShapeSheet Functions SharePoint 2013 SQL Teams Validation VBA Video Visio Visio 2007 Visio for the Web Visio Online Visio Services Visio Viewer Webinar

Footer

bVisual Profile

The UK-based independent Visio consultancy with a worldwide reach. We have over 25 years experience of providing data visualization solutions to companies around the globe.

Learn more about bVisual

  • Amazon
  • E-mail
  • Facebook
  • LinkedIn
  • Twitter
  • YouTube

Search this website

Recent posts

  • Fixing dimensions of 2D shapes
  • Merging Linked Data from Similar Tables
  • Smart Radio Buttons and Check Boxes in Visio
  • Using Button Face Ids in Visio
  • Grid Snapping Revisited

Copyright © 2025 · Executive Pro on Genesis Framework · WordPress · Log in