Those kind people at Packt have decided to offer my book for half-price from 16th until 24th September 2015!

Please visit www.visiorules.com for more information… and it is valid for Microsoft Visio 2016 too!
Published on by David Parker
Those kind people at Packt have decided to offer my book for half-price from 16th until 24th September 2015!

Please visit www.visiorules.com for more information… and it is valid for Microsoft Visio 2016 too!
Published on by David Parker
I have previously written blog articles about using, and extending, the Microsoft supplied Data Graphic Icons Sets, but I never explicitly listed their variations in a useful visual table. So, here is one:

Published on by David Parker
My earlier post about the world in Visio shapes, see http://blog.bvisual.net/2013/08/16/visio-map-of-the-world/ , has been one of my most popular, and a reader recently asked about changing the colour of countries by data not in my original worksheet, and another asked about adding labelled dots.
Well, at first, I thought it would be quite simple to add more Data Graphics with the Color By Value that I already had, but then I realised that I needed to adjust some of the shapes that I had created from SVG in my previous article.
The problem is that some of the country shapes which were converted from SVG have geometry at the top group level. This means that any Data Graphic items, other than Color By Value, are actually sub-shapes of the group and will be hidden by the country shape itself. That is probably why the Data Graphics task, on the selected Afghanistan shape below, sent the AF label over to the right of it, whereas all the group shapes with all their geometry in sub-shapes, such as the AE (United Arab Emirates) shape, placed the label in its centre.

Published on by David Parker
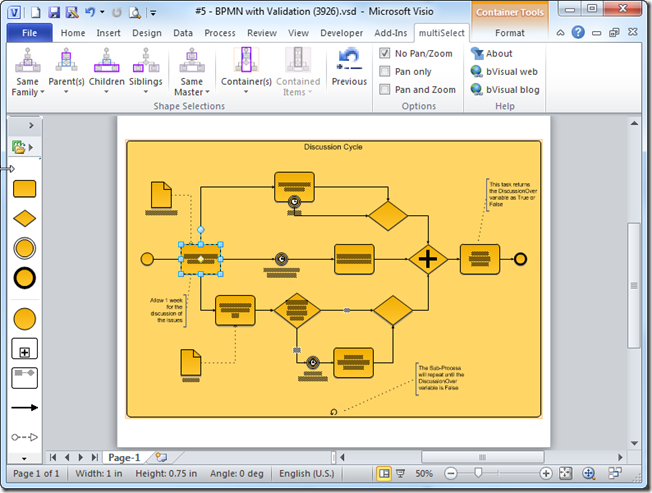
Much as I love using Visio, I have always felt that there are a few selection methods missing, and I often have to some extra buttons into solutions to make up for this. There are many types of diagrams that have shapes connected to each other, usually with a connector shape, and the user needs to be able to traverse these connections quickly and easily, so I have created a Visio 2010 add-in, multiSelect, that adds a lot of different selection methods that are accessible via an extra ribbon tab when ever a shape is selected.

The UK-based independent Visio consultancy with a worldwide reach. We have over 25 years experience of providing data visualization solutions to companies around the globe.