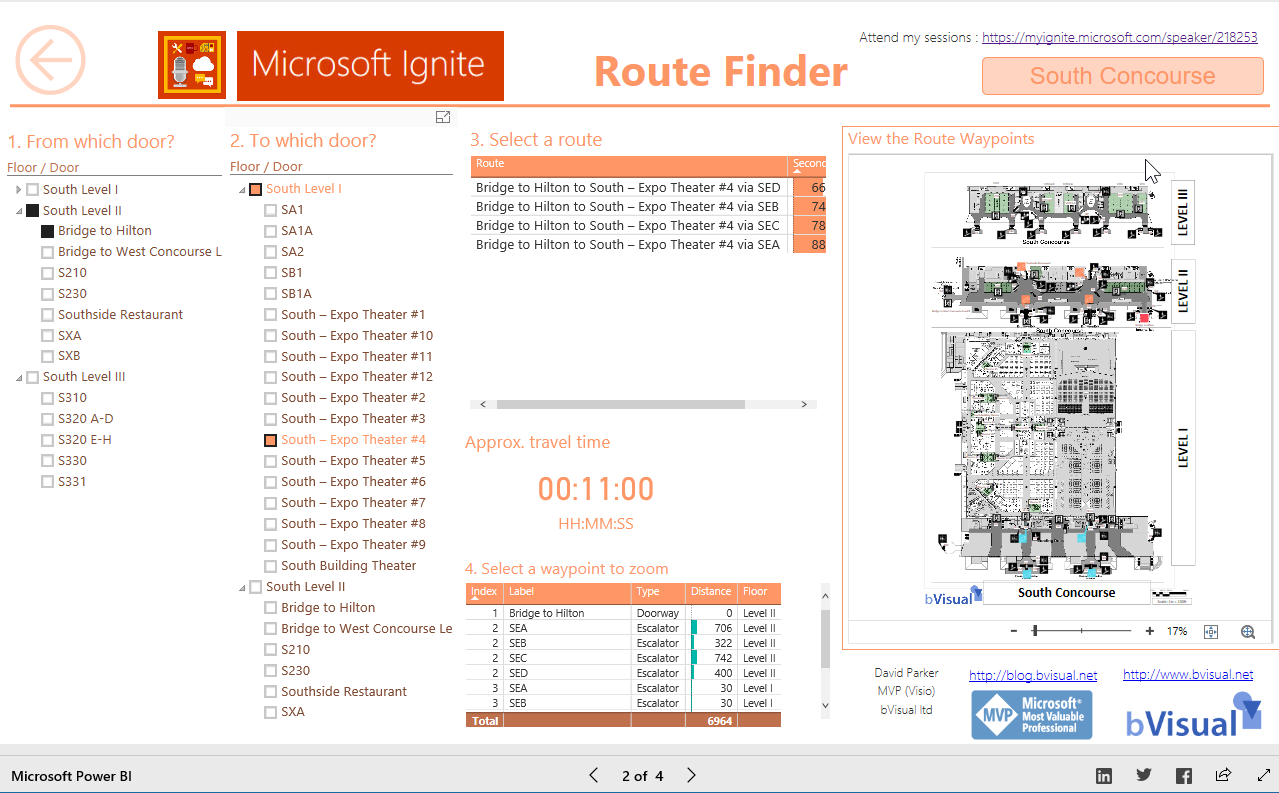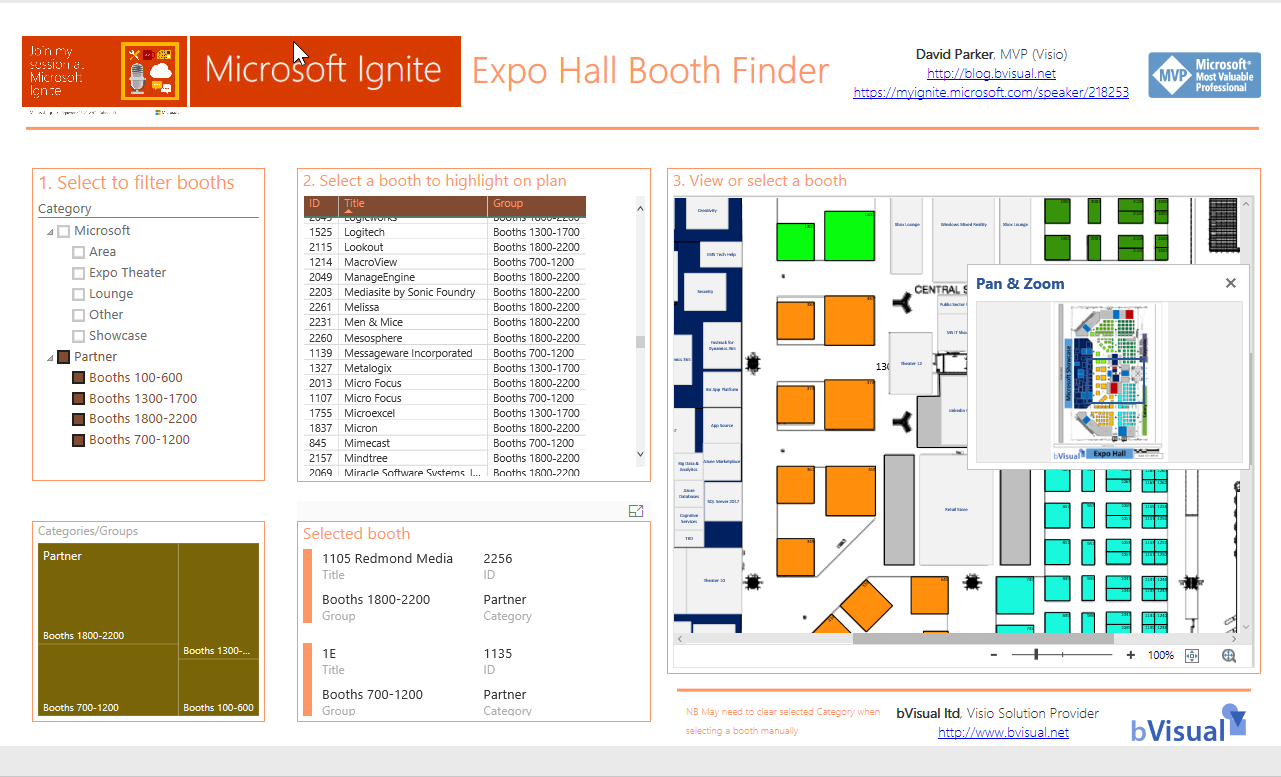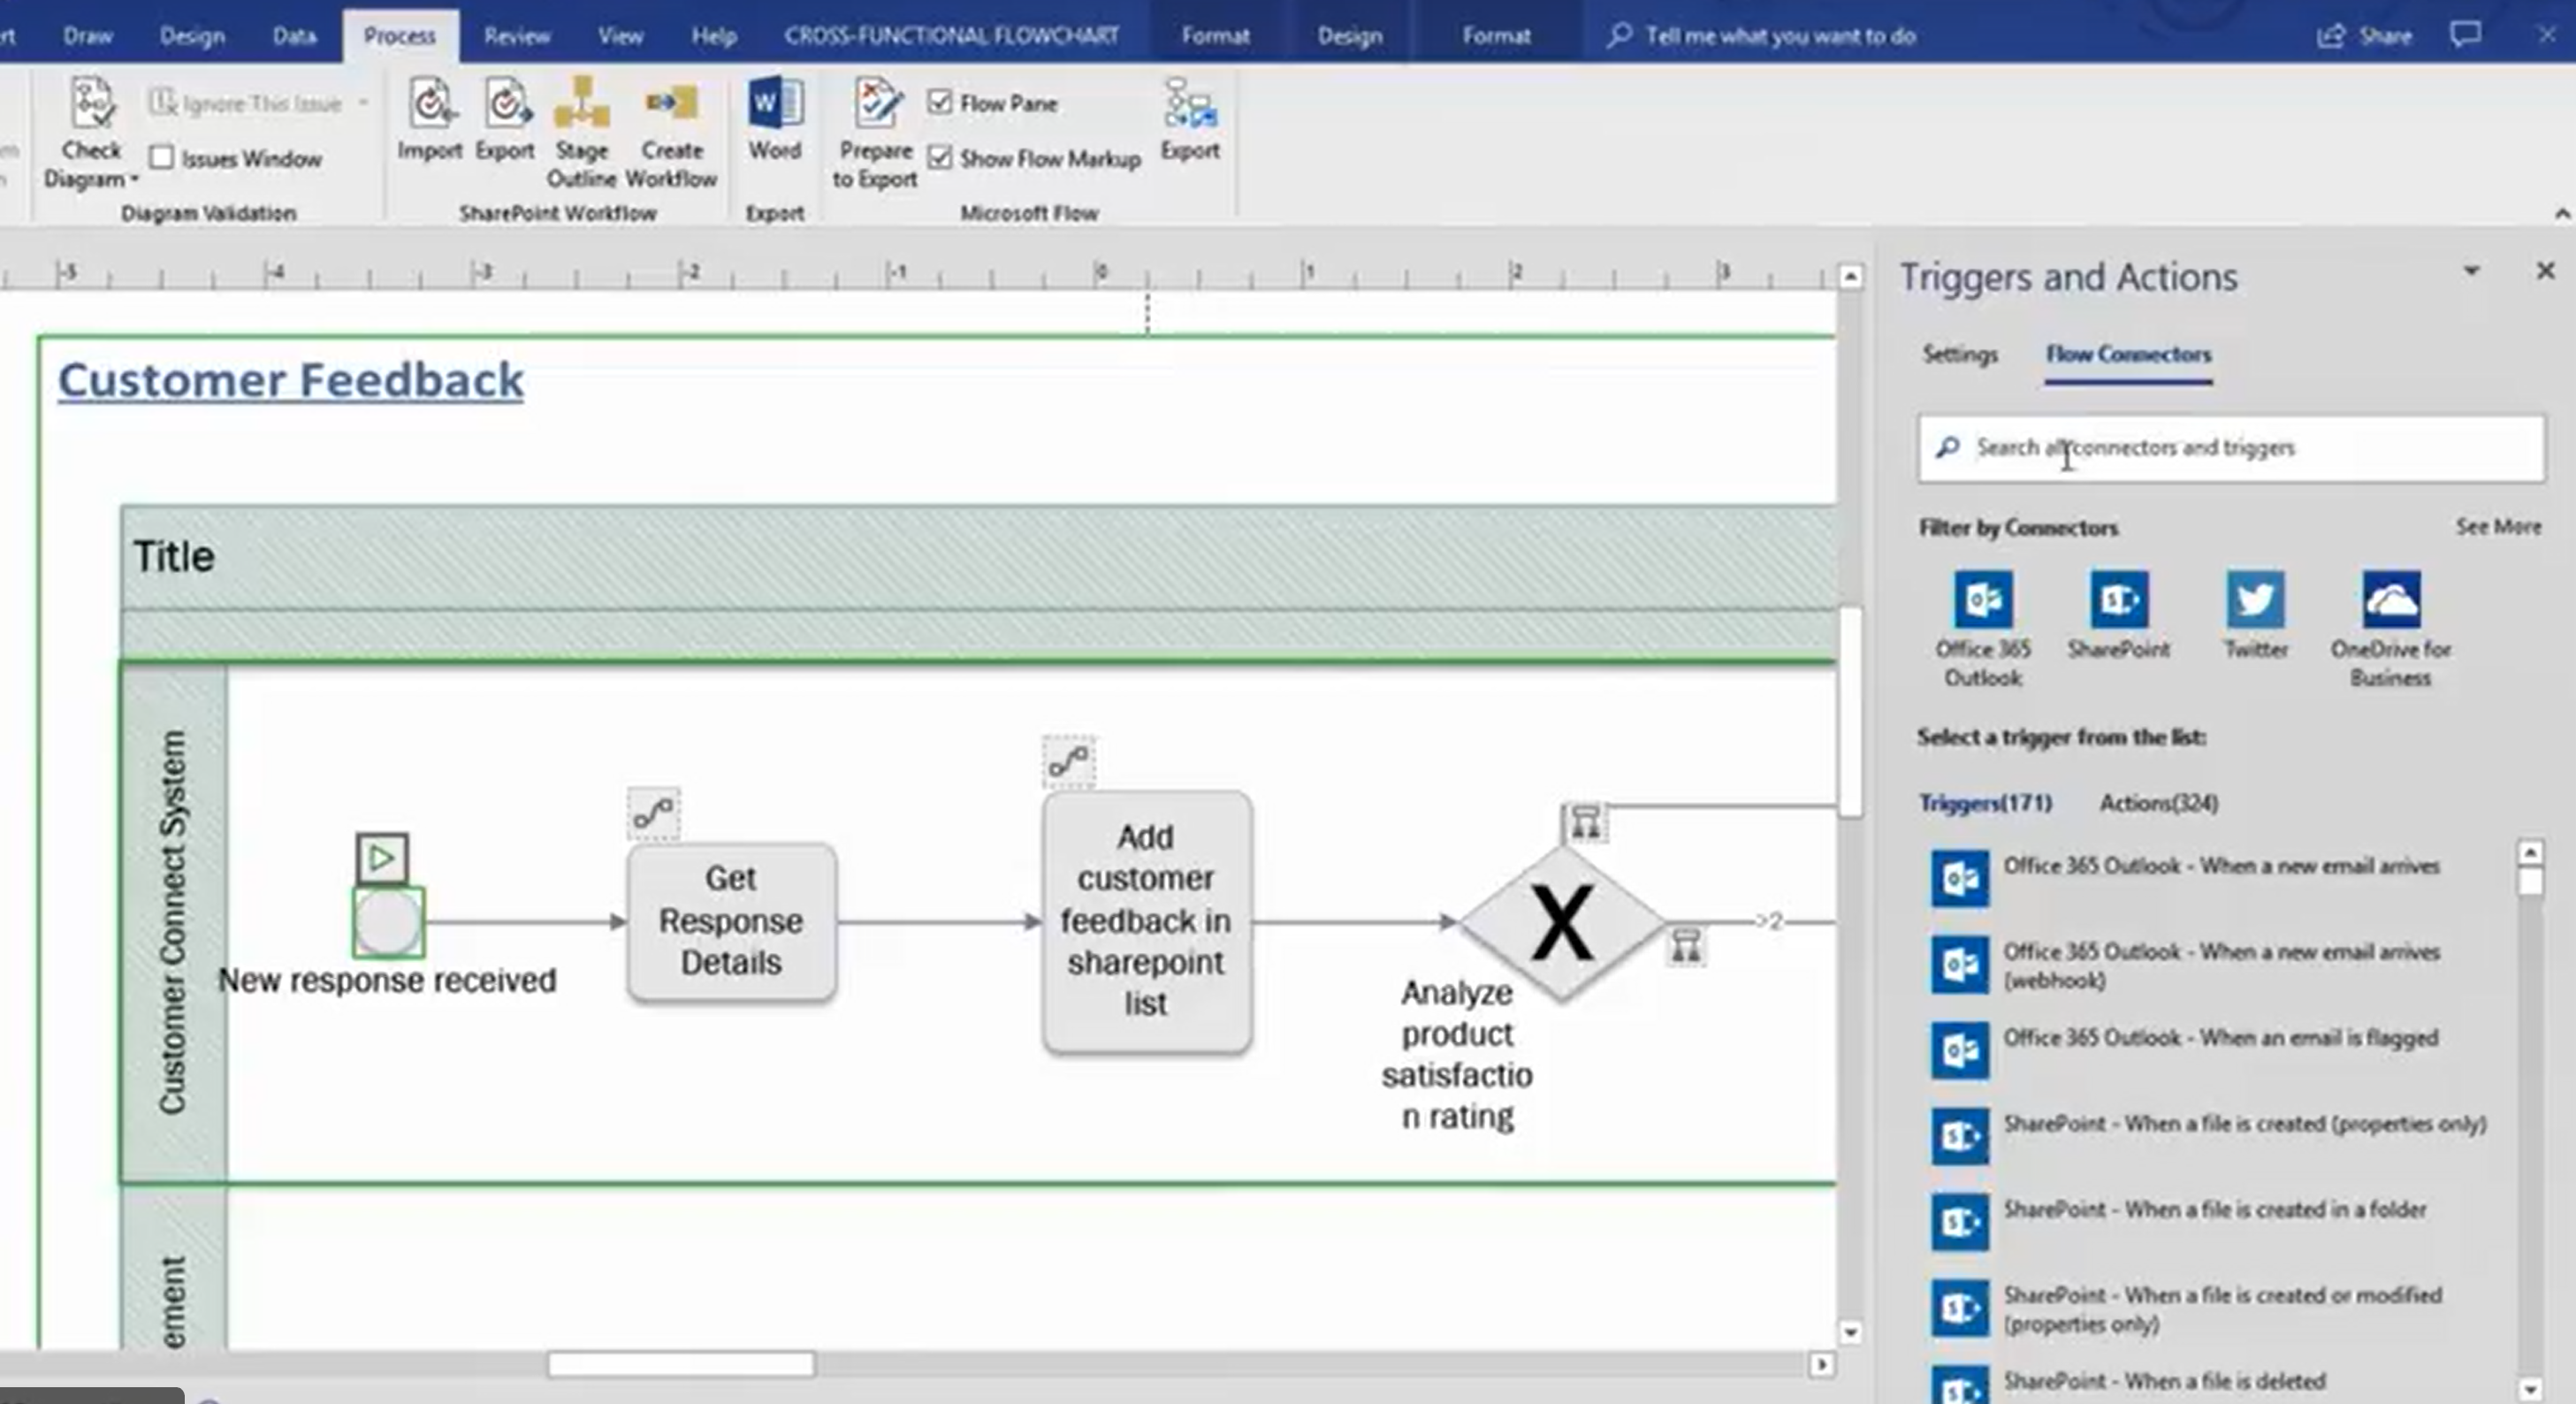
It will take me some time to review the content coming out at MSIgnite, but there is a re-occurring theme with the seemingly omni-presence of the Power Platform in all the user-facing applications that contain data. The Power Platform is PowerApps, Microsoft Flow, and Power BI ( view a session about this ) built on top of Azure. They work together, or separately, and they add an incredible amount of flexibility and democracy to applications. In the case of Visio, there is a tantalising view of what is coming shortly! Check out this video.
PowerApps
PowerApps in PowerBI with Visio!!!
I am very excited to see that the preview for PowerApps in PowerBI has been released ( see Announcing availability of PowerApps custom visual for Power BI (preview) ). I saw this demonstrated months ago, and have been waiting impatiently ever since. Every time I have embedded a Visio diagram into PowerBI, I have wanted to display the selected shape data in a detail view … and now I can!
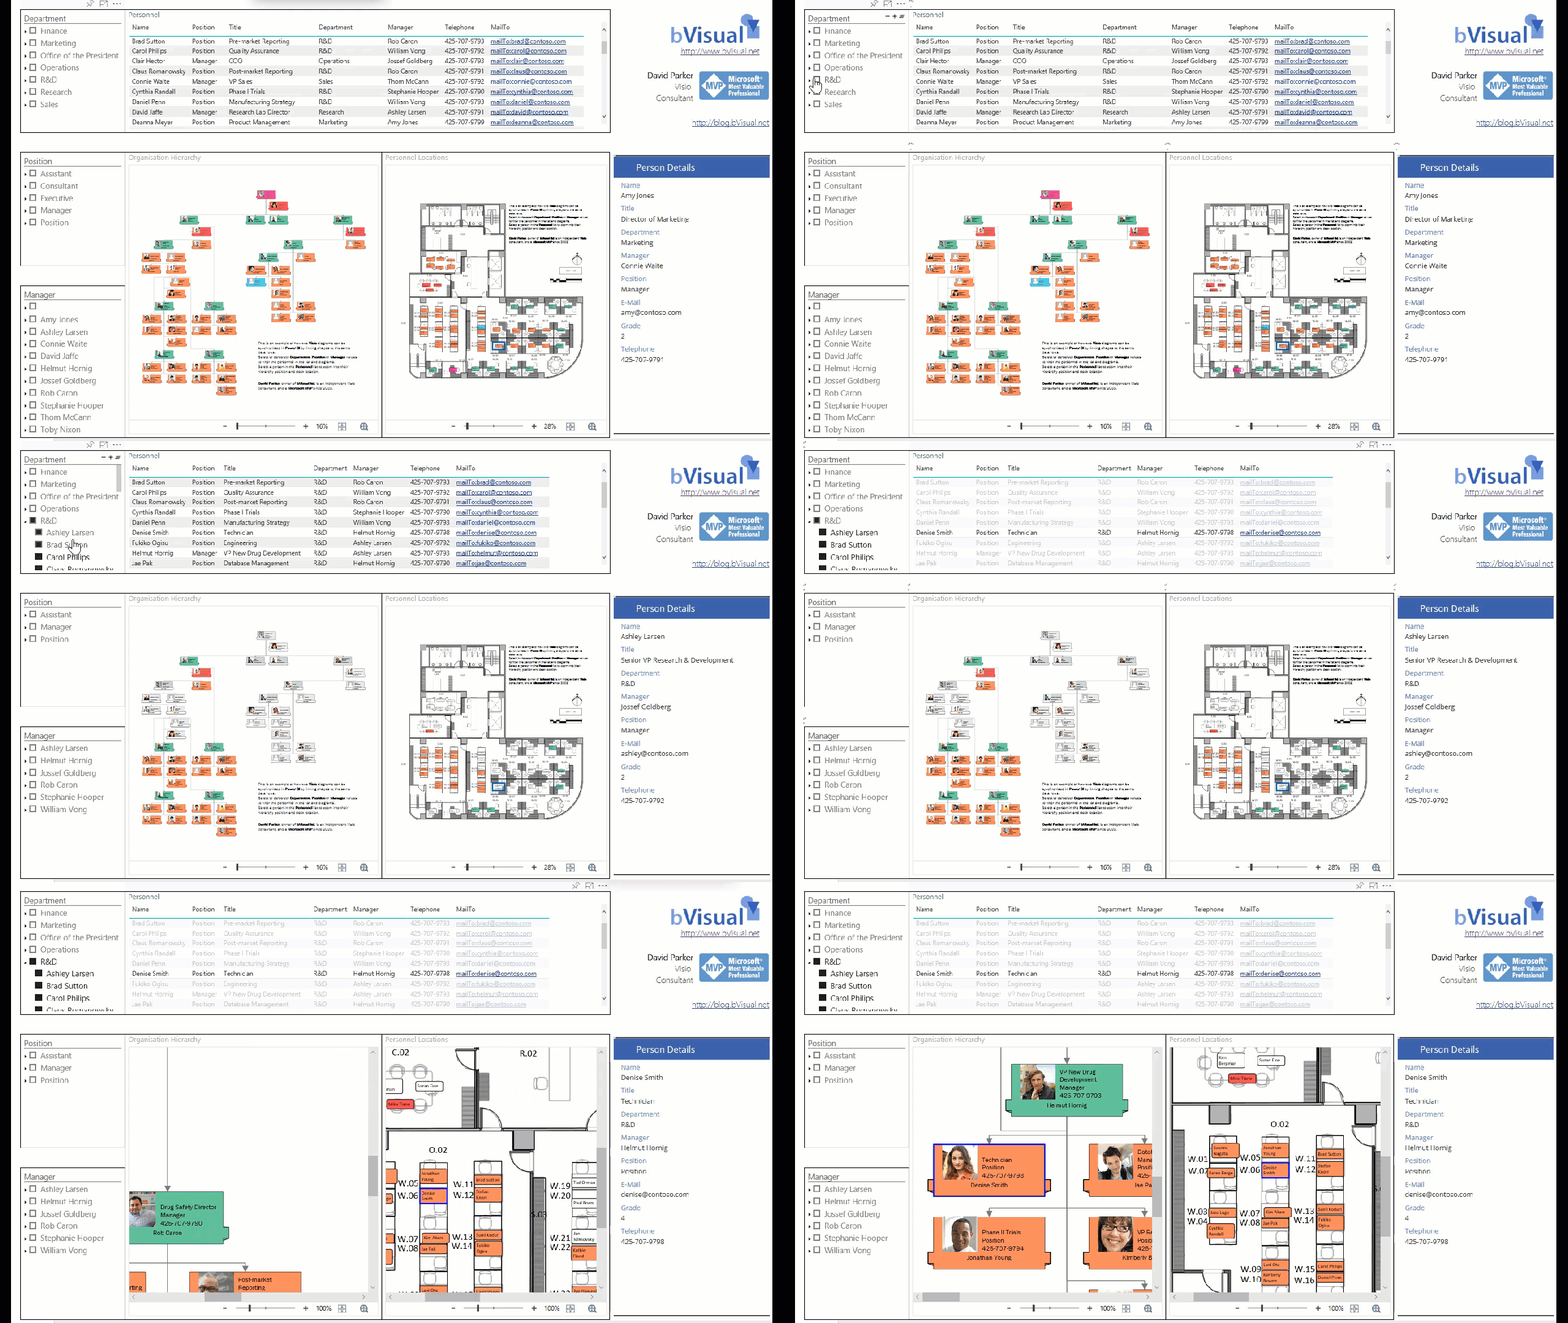
I cannot yet create a PowerBI report with the embedded PowerApps visual for consumption by the whole internet, but it should still solve many scenarios for organisations. I quickly added the new PowerApps visual to my example synchronised Org Chart and Desk Layout from my previous article ( #Visio in #PowerBI for viewing personnel hierarchies and locations ) , and recorded a simple selection in the following gif:
To do this, I simply created a default new PowerApps app from the queryOrg query in Excel workbook I created previously, and modified the Item value for the DetailForm of the DetailScreen. I removed the BrowseScreen and EditScreen because they were not required. Then, hey presto, the correct record is displayed whenever a shape is selected.
Countdown to MSIgnite for Visio sessions
Only a couple of days to go before Microsoft Ignite conference starts here in Orlando. Yes, I am here a week early to “acclimatize” 🙂 , but I have not been idle since I will be presenting in three sessions!
[Read more…] about Countdown to MSIgnite for Visio sessionsAdding clicks to infographics with Visio visual for PowerBI
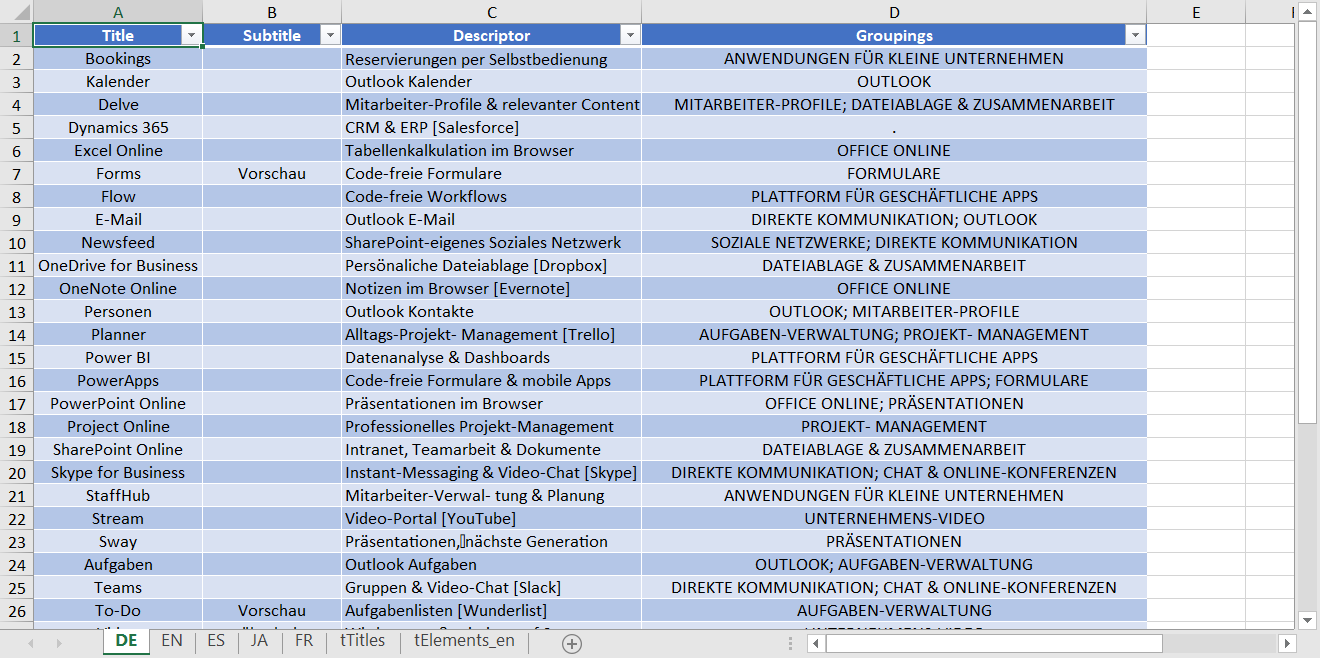
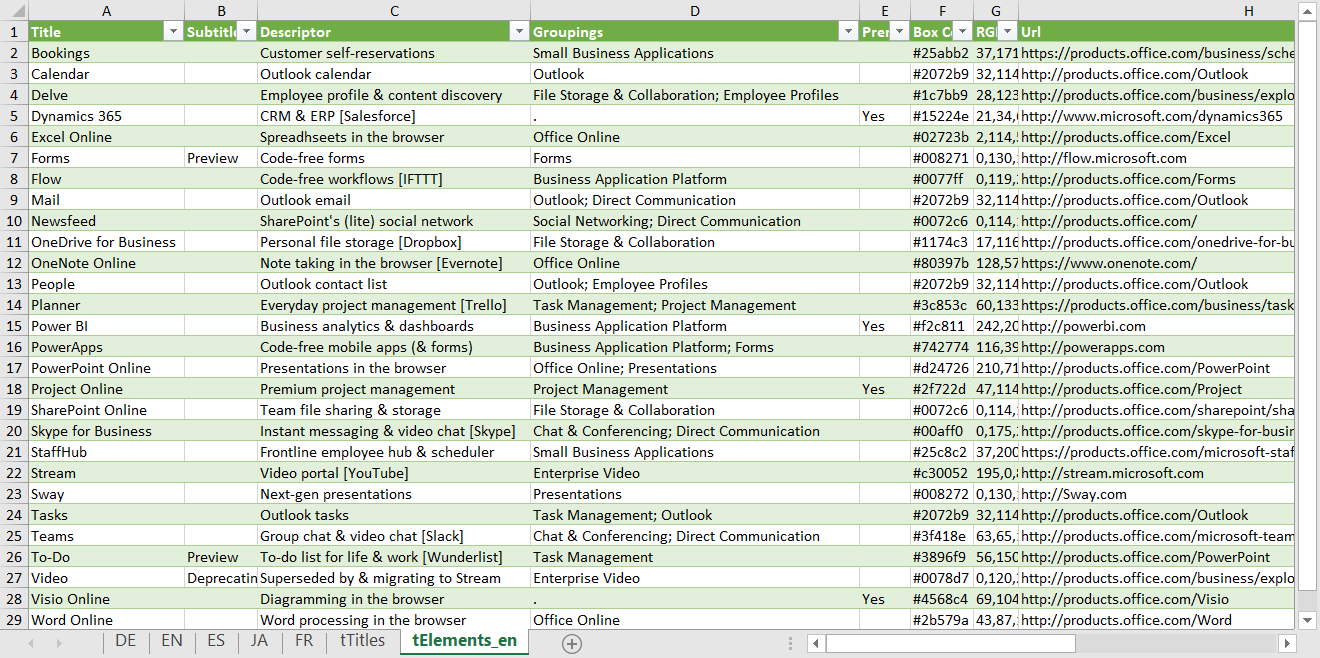
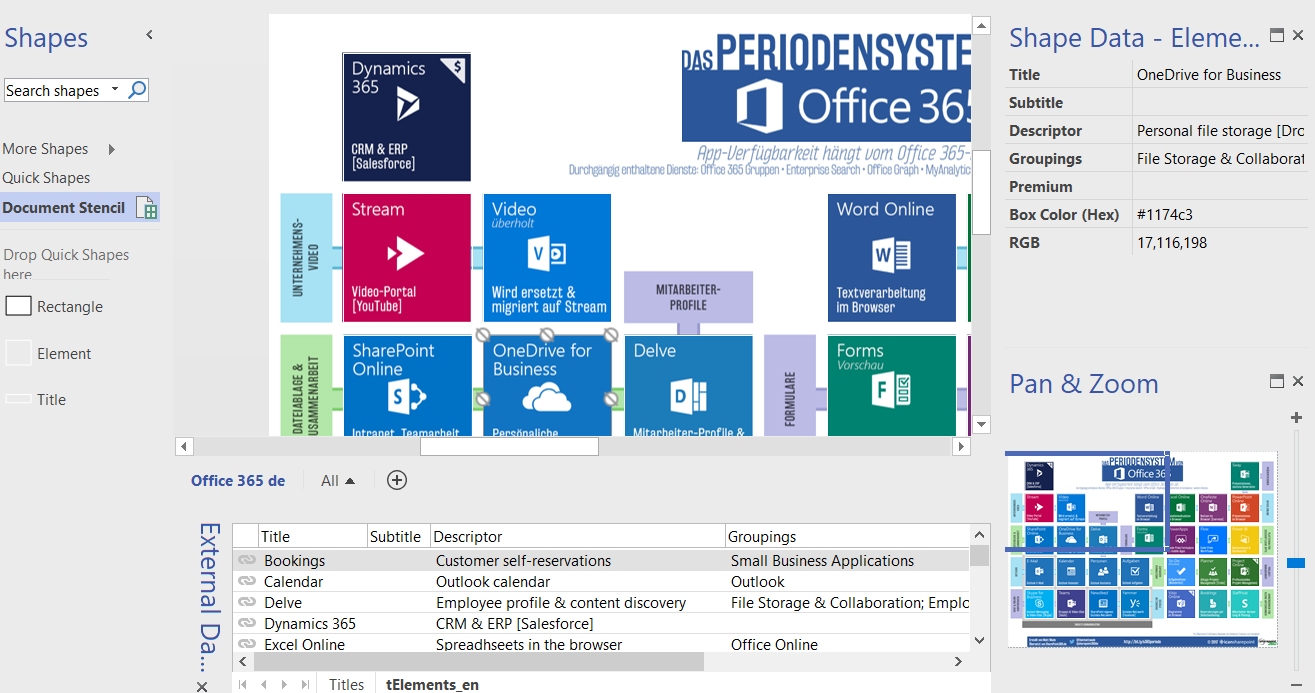
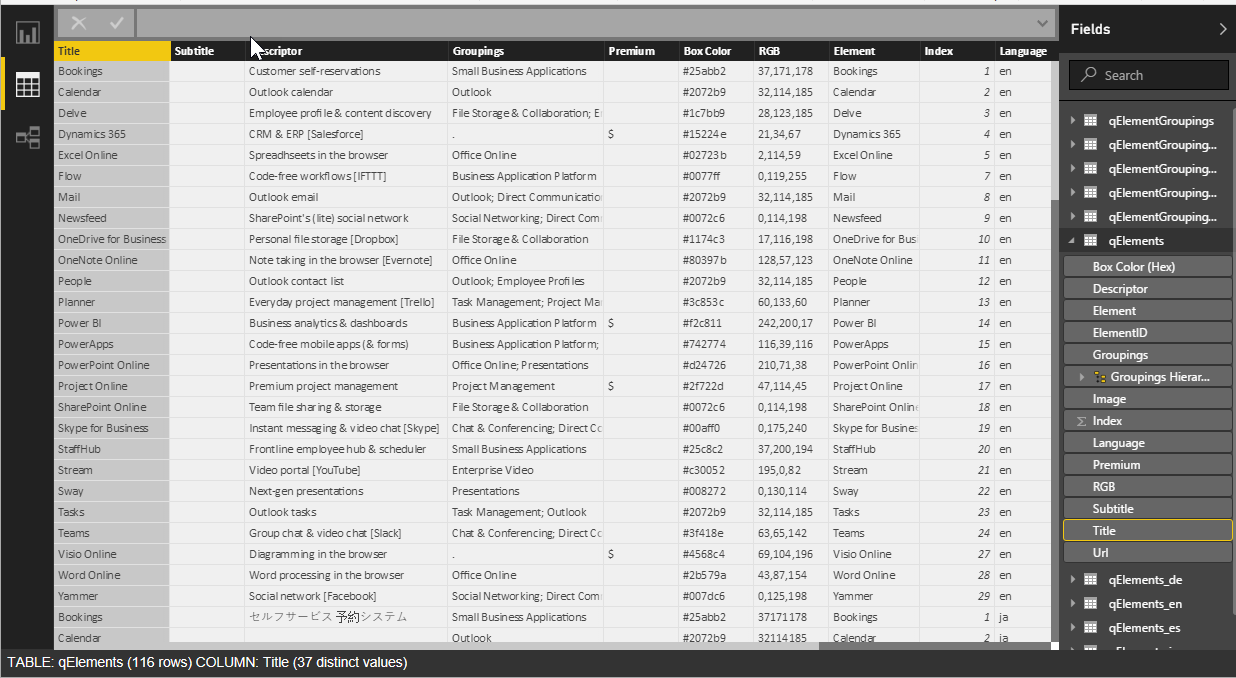
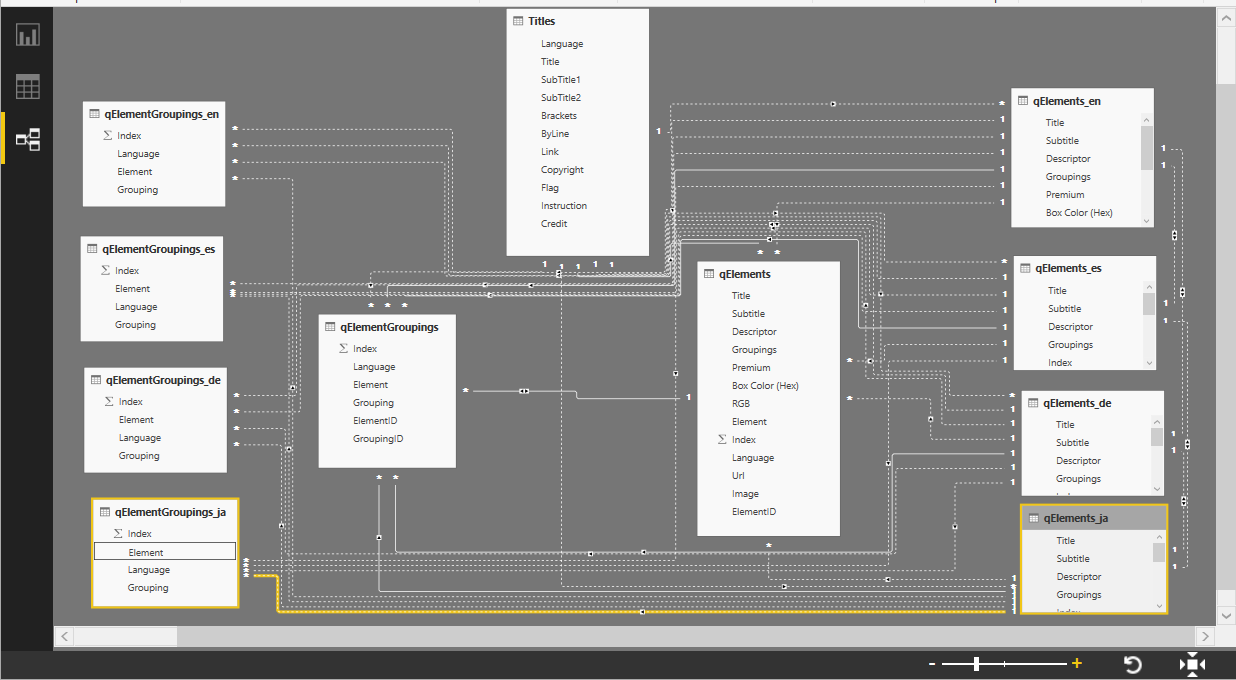
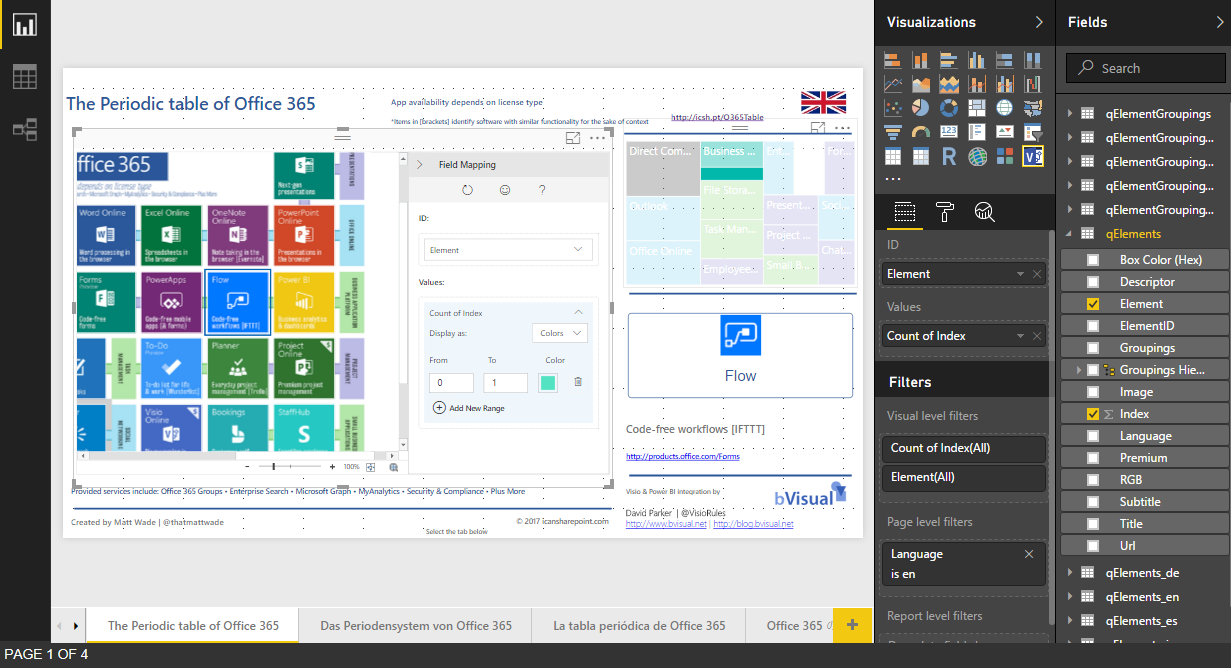
Office 365 is a truly remarkable success story, but it is often difficult to understand what each of the parts actually do, or what it is actually in each edition. Microsoft are always adding applications and services to the various editions, or retiring ones that have been superseded. If I can’t see it, I can’t understand it, so I was very interested to see the Periodic Table of Office 365 infographic created by Matt Wade, a SharePoint guru who keeps an eye on these changes ( see http://icsh.pt/O365Table ). It really helps in comprehending the current Office 365 applications and their purpose. Indeed, I have seen his graphic go through many iterations over the last few months, and it will continue to change. However, it was not clickable, and I am a visual data guy, so I contacted him, and offered to integrate his infographic into a Power BI now that the Visio custom visual is available. I then found out that there are several different language versions of his infographic out there on the web, translated by other SharePoint professionals in his network.
[Read more…] about Adding clicks to infographics with Visio visual for PowerBIMSIgnite Sessions to Watch in Visio
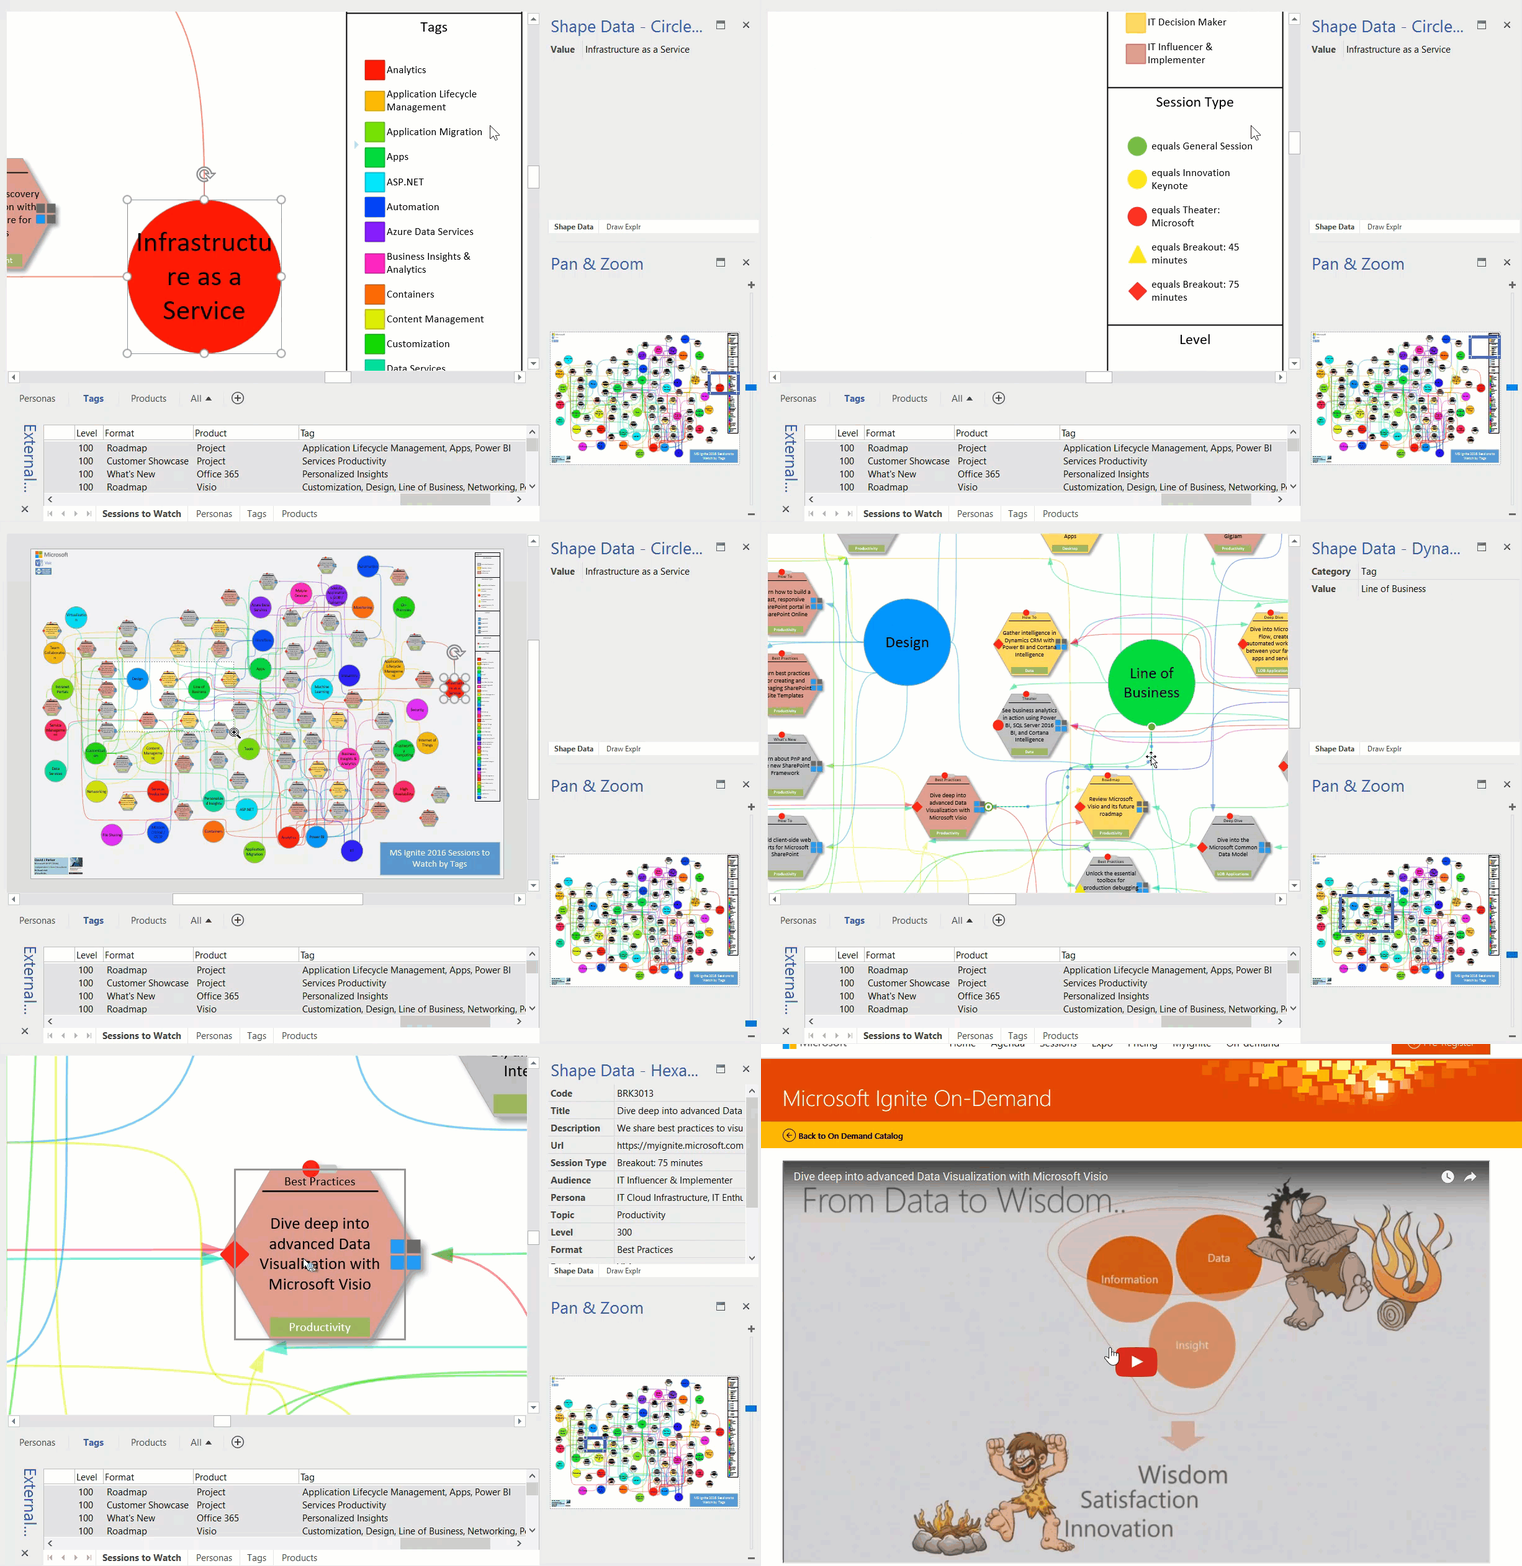
Well, MS Ignite is over for another year. I planned to visit loads of sessions, but the reality was that I spent many hours on the Visio booth. Fortunately, many of them were recorded, including ours, but I don’t have time to watch over 700 videos! So, I looked through them all and picked out 50-odd, and used Get & Transform in Excel again to create suitable queries to link to Visio.
The more I use PowerQuery, the more I like it. I was able to extract the unique values in the Personas, Tags, and Products columns which each contained comma separated lists. I data-linked these values to large circles on different pages, and data-linked the Sessions to Watch to hexagonal shapes. I then wrote a little VBA code to link the circles to the hexagons with data-linked connectors. Data Graphics was applied to all shapes, including the connectors, and a legend added. Each of the Session hexagons have an automatically created hyperlink to the On-Demand Video. I used a standard radial page layout so that I had minimal manual movement shapes.
The end result is a visual dashboard by Persona, Tag and Product to open the videos for the sessions I want to watch.