• Skip to main content
  • Skip to primary sidebar
  • Skip to footer

bVisual

  • Home
  • Services
    • How Visio smartness can help your business
    • Visio visual in Power BI
    • Visio Consulting Services
    • Visio Bureau Services
    • Visio Training and Support Services
  • Products
    • Visio Shape Report Converter
    • SS Plus
    • LayerManager
    • visViewer
    • Metro Icons
    • Rules Tools for Visio
    • The Visio 2010 Sessions App
    • Multi-Language Text for Visio
    • Document Imager for Visio
    • multiSelect for Visio
    • pdSelect for Visio
  • Case Studies
    • Case studies overview
    • Using Visio in Education for GIS
    • Visualizing Construction Project Schedules
    • Visio Online Business Process Mapping
    • Nexans Visio Template
    • CNEE Projects, WorldCom
    • Chase Manhattan Bank
  • News
    • Recent news
    • News archive
  • Resources
    • Articles➡
      • ShapeSheet Functions A-Z
      • Comparing Visio for the Web and Desktop
      • Customising Visio Shapes for the Web App
      • Key differences between the Visio desktop and web apps
      • Using the Visio Data Visualizer in Excel
      • Using Visio in Teams
      • Creating Visio Tabs and Apps for Teams with SharePoint Framework (SPFx)
      • Designing Power Automate Flows with Microsoft Visio
      • Innovative uses of Visio Lists
    • Webcasts ➡
      • Visio in Organizations
      • My session and other Visio sessions at MSIgnite 2019
      • Power up your Visio diagrams
      • Vision up your Visio diagrams
      • The Visio 2010 MVP Sessions
    • Visio Web Learning Resources
    • Books➡
      • Visualize Complex Processes with Microsoft Visio
      • Mastering Data Visualization with Microsoft Visio
      • Microsoft Visio Business Process Diagramming and Validation
      • Visualizing Information with Microsoft Visio
  • Blog
    • Browse blog articles
    • Visio Power BI articles
    • Visio for Web articles
    • A history of messaging and encryption
  • About us
    • About bVisual
    • Testimonials
    • Bio of David Parker
    • Contact Us
    • Website Privacy Policy
    • Website terms and conditions
    • Ariba Network

Data Graphics

Published on November 3, 2012 by David Parker

US Election Special–Vector Visio 2003 – 2010 Icons

Following on from my previous post, http://blog.bvisual.net/2012/11/02/us-election-special-vector-visio-2013-icons/, I have saved the stencil that was generated in Visio 2013 back to Visio 2003 – 2010 format … and, guess what? All of the new Bezier Curves got automatically translated to Nurbs, which means they work! (Except for themes … but they can be coloured)

image

They can be downloaded from : tp://sdrv.ms/TlzoEB

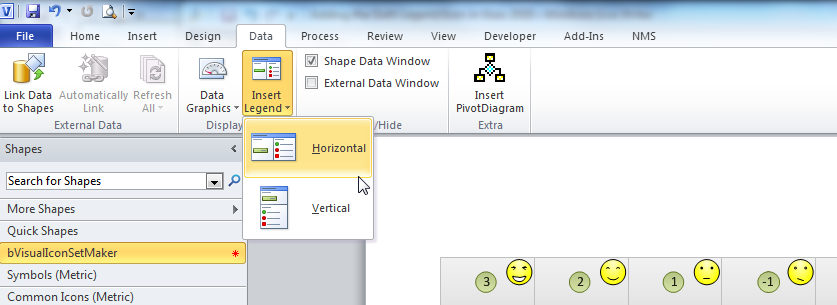
Perhaps someone would like to make Data Graphic icons from them ? : http://blog.bvisual.net/2012/04/19/make-your-own-visio-data-graphic-icons-sets-automatically/

Filed Under: Data Graphics, Visio, Visio 2010 Tagged With: Data Graphics, Icon Sets, Icons, Visio 2007

Published on September 3, 2012 by David Parker

Using Visio Stacked Bar Charts

A Visio user asked recently about data binding a table like the following as a stacked chart. The question was a little imprecise about how, so I shall present a few alternatives.

RegionQ1Q2Q3Q4
Rg145123545
Rg212244536
Rg378364571

Firstly, I entered the table in Sheet1 of a new Excel workbook and saved it.

[Read more…] about Using Visio Stacked Bar Charts

Filed Under: Visio 2010 Tagged With: Data Graphics

Published on July 11, 2012 by David Parker

Selecting Nodes in Visio PivotDiagrams

Microsoft Visio 2007 introduced PivotDiagrams to Visio Professional, and continues unchanged in Visio 2010 (see http://office.microsoft.com/en-us/visio-help/create-a-pivotdiagram-HA010357089.aspx ). These diagrams are a great way to analyse and visualize data by allowing you to breakdown data in a similar manner to PivotTables and PivotCharts in Excel. Any one who has both Microsoft Project and Visio installed will have seen that all of the extra diagram reports are in fact Visio PivotDiagrams. However, I have always found that selecting the nodes you want is difficult. In this article I will explain the problem and provide a solution … a new free add-in called PdSelect.

Update : Added new features 20 Jul 2012

In the following example PivotDiagram, I used the built-in OrgData Excel workbook as the data source. This example workbook is normally used to demonstrate the OrgChart Wizard, but I have used it to provide an alternative breakdown by Department / Reports_To / Name.

image
[Read more…] about Selecting Nodes in Visio PivotDiagrams

Filed Under: pdSelect, Selections, Visio 2010, Visio 2013 Tagged With: Data Graphics, PivotDiagrams

Published on July 5, 2012 by David Parker

Automating Page.DropLegend in Visio 2010

Visio 2007 introduced Data Graphics but, in my opinion, didn’t provide any automatic legends for the icons and colour by value options. That is why I wrote DataLegends (see http://www.bvisual.net/Products/DataLegends.aspx ) as an add-in for Visio 2007 several years ago. This oversight was remedied in Visio 2010 when Microsoft introduced their own legends (which were not totally dissimilar to my own), and also added a method (Page.DropLegend) for programmers to automate this task.

image

[Read more…] about Automating Page.DropLegend in Visio 2010

Filed Under: Visio 2010 Tagged With: Data Graphics, Legend

Published on June 29, 2012 by David Parker

MVP Sessions wheel

I wasn’t sure whether to call it a wheel or a clock-face, but since there are 24 MVP Visio 2010 sessions (see http://visio.microsoft.com/mvpsessions )  I decided on a wheel … so in this blog I present my alternative interface into these sessions, created in Visio of course!

I created an Excel workbook in which I listed all of the sessions, their descriptions, and links to the video and any supporting files. I then created the wheel diagram, and used Link Data to Shapes to automatically add Shape Data rows and hyperlinks to each shape, and Data Graphics to automatically colour each shape.

Finally, I saved the Visio page as web pages (VML, XAML and SVG format output), and as pdf.

MVPSessions

Open the VML web output : http://www.bvisual.net/resources/mvpsessionsIE.htm

Open the SVG web output : http://www.bvisual.net/resources/mvpsessions.htm

Open the XAML web output : http://www.bvisual.net/resources/mvpsessionsX.htm

Open the Visio file : http://sdrv.ms/NYHH8V

Open the Excel file : http://sdrv.ms/OI3EKU

Open the pdf : http://sdrv.ms/OI2i2I

UPDATE : see http://blog.bvisual.net/2013/07/08/mvp-sessions-for-getting-started-with-visio-2010/

Filed Under: Visio 2010 Tagged With: Data Graphics, Excel 2010, Link Data to Shapes

Published on April 22, 2012 by David Parker

Adding the Sixth Legend Icon in Visio 2010

In my previous two articles, I described how to have 6 icons in a Data Graphic Icon Set, and provided some VBA code to make your own icons sets from existing Visio shapes or images. One thing that I overlooked was the Insert Legend command in Visio 2010, because it does not add the sixth icon automatically, so this blog describes how to add it. As a side effect, the code also enables the legend labels of icon and CBV (Color By Value) items to be edited.

image


When you use the Insert Legend command, it examines the Data Graphics used on the active page, to create legends for each Icon Set or Color By Value settings that it finds. Closer examination of the legend shapes, shows that an instance of the Icon Set master shape is added for each of the icons found.

[Read more…] about Adding the Sixth Legend Icon in Visio 2010

Filed Under: Data Graphics, Shape Data, ShapeSheet Formulas, VBA, Visio 2010 Tagged With: Data Graphics, Icon Sets, Legend

  • « Go to Previous Page
  • Page 1
  • Page 2
  • Page 3
  • Page 4
  • Go to Next Page »

Primary Sidebar

  • LinkedIn
  • Twitter

Recent Posts

  • Fixing dimensions of 2D shapes
  • Merging Linked Data from Similar Tables
  • Smart Radio Buttons and Check Boxes in Visio
  • Using Button Face Ids in Visio
  • Grid Snapping Revisited

Categories

Tags

Accessibility Add-Ins Connectors Containers Data Export Data Graphics Data Import Data Visualizer Educational Excel GraphDatabase Hyperlinks Icon Sets JavaScript LayerManager Layers Legend Link Data to Shapes Lists MSIgnite MVP Office365 Org Chart PowerApps PowerBI PowerQuery Processes Setup and Deployment Shape Data Shape Design ShapeSheet ShapeSheet Functions SharePoint 2013 SQL Teams Validation VBA Video Visio Visio 2007 Visio for the Web Visio Online Visio Services Visio Viewer Webinar

Footer

bVisual Profile

The UK-based independent Visio consultancy with a worldwide reach. We have over 25 years experience of providing data visualization solutions to companies around the globe.

Learn more about bVisual

  • Amazon
  • E-mail
  • Facebook
  • LinkedIn
  • Twitter
  • YouTube

Search this website

Recent posts

  • Fixing dimensions of 2D shapes
  • Merging Linked Data from Similar Tables
  • Smart Radio Buttons and Check Boxes in Visio
  • Using Button Face Ids in Visio
  • Grid Snapping Revisited

Copyright © 2025 · Executive Pro on Genesis Framework · WordPress · Log in