What a week we just had! Microsoft invited three Visio MVPs and book authors to record 24 short videos on Visio. They will be published gradually over the next few months. We converged on Microsoft’s studios in Redmond from Boston, Germany and the UK for two days of intensive filming. It was enlightening, enriching and exhausting. The videos will only be a few minutes long each (apparently most online viewers can only last 90 seconds), but they cover a wide area of Visio uses, and contain a few good productivity tips.
[Read more…] about Visio Video Filming for Future ViewingVisio
Deploying a Visio 2007 or 2010 VSTO add-in with Visual Studio 2010
I like extending Visio with custom code, and I have been doing it a long time. I progressed from VBA within Visio documents, to VB executable, using a C++ wrapper to register as Visio Add-ons, through VB.net COM add-ins to C# VSTO add-ins. Which ever language and method I use, it seems to me that deployment is always far more more difficult than it should be. Even though it has got simpler with VS 2010, there are still some gotchas…
[Read more…] about Deploying a Visio 2007 or 2010 VSTO add-in with Visual Studio 2010
Linking Excel Named Ranges in Visio
I have been using worksheets and ranges in Excel with Visio’s Link Data to Shapes (in the Pro and Premium editions) for several years, but recently encountered a problem with the recently added structured references in Excel. Fortunately, with the help of my colleague John Goldsmith, we found a solution.
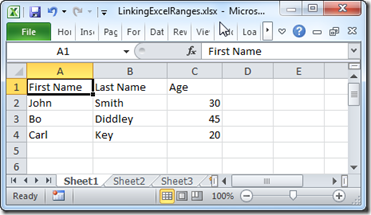
Normally, I create tables in Excel worksheets with the column headings in the first row, so I could use the worksheet name in the Link Data to Shapes function in Visio. However, I wanted to have an extra row above the table headers for a recent project, so I wanted to use named ranges, defined with any rows above the table headers omitted. When I went to connect these ranges using the Data Selector in Visio, I found that all of my named ranges, except one (StepIds), were missing from the list of worksheets and ranges:
Formatting Custom Units in Visio
A recent reader asked how can you use custom units in Visio when the only number formats available appear to be currencies, lengths and percentage. In his case he would like to display Kgs and the symbol for degrees Celsius. Well, I will explain how you can do this for Shape Data, at source, or in Data Graphics.
Displaying Custom Units in Shape Data
In the following example, I have taken a normal Server master and added four extra Shape Data rows – MaxOperatingTemp, MinOperatingTemp, Weight, and TempRange:
Page Grids and Off Page References
A recent question in the Visio 2010 Forums asked how to create a Complicated Off Page Reference; one that displays the page name and grid reference of the target shape. The questioner assumed that a macro would be needed, so I couldn’t resist seeing how much could be done without using macros.
This particular user wants his page to be divided into ten rows from 0 to 9, and eight columns, from A to H. In his case the rows are numbered from top to bottom, and the columns are from left to right. I decided to allow from 1 to 26 (the number of letters in the alphabet) rows and columns in my solution, and to allow for the row and column header text to be customizable.
My starting point is the useful Off-page reference master on the Basic Flowcharts Shapes stencil. This provides the ability to utilize a standard Visio add-on, OPC, so that two shapes on different pages can have reciprocal links.
Visio 2010 Container Problems
Update : I have received a corrected response from my friends at Microsoft regarding the use of Spatial Neighbors and Containers, so I have to revise this post from its original. The changes are marked in Red.
The Structured Diagramming API in Visio 2010 is really neat, but there are a couple of problems that I think you should be aware of. The first one is about how shapes can appear to be in a container, but aren’t really; and the second is how the Container type prevents SpatialNeighbors from working … unless you use a new constant.
Let’s start with an example diagram that contains three Process shapes on a Cross Functional Flowchart. Notice that I have select the Process shape labelled A and this has caused the swimlane Function 2 to display a brown highlight … this is a good indication that the Structured Diagramming
API is working, and that Function 2 is a container shape. I have placed two more Process shapes below the swimlanes, and one of them (C) is on top of a SubProcess shape.