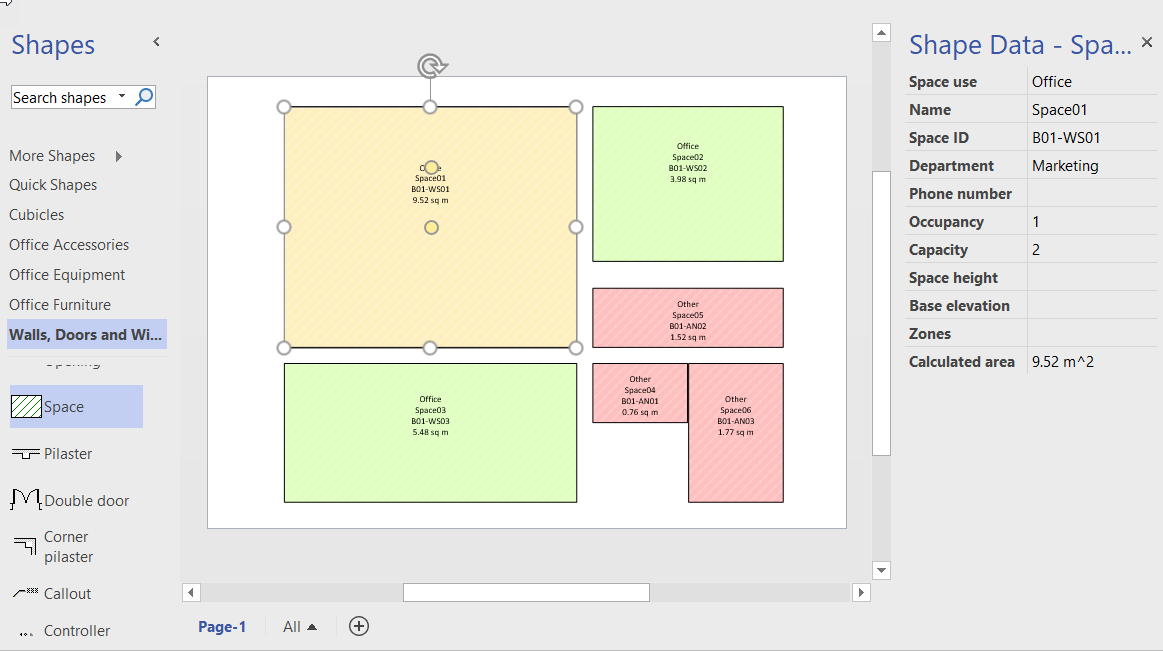
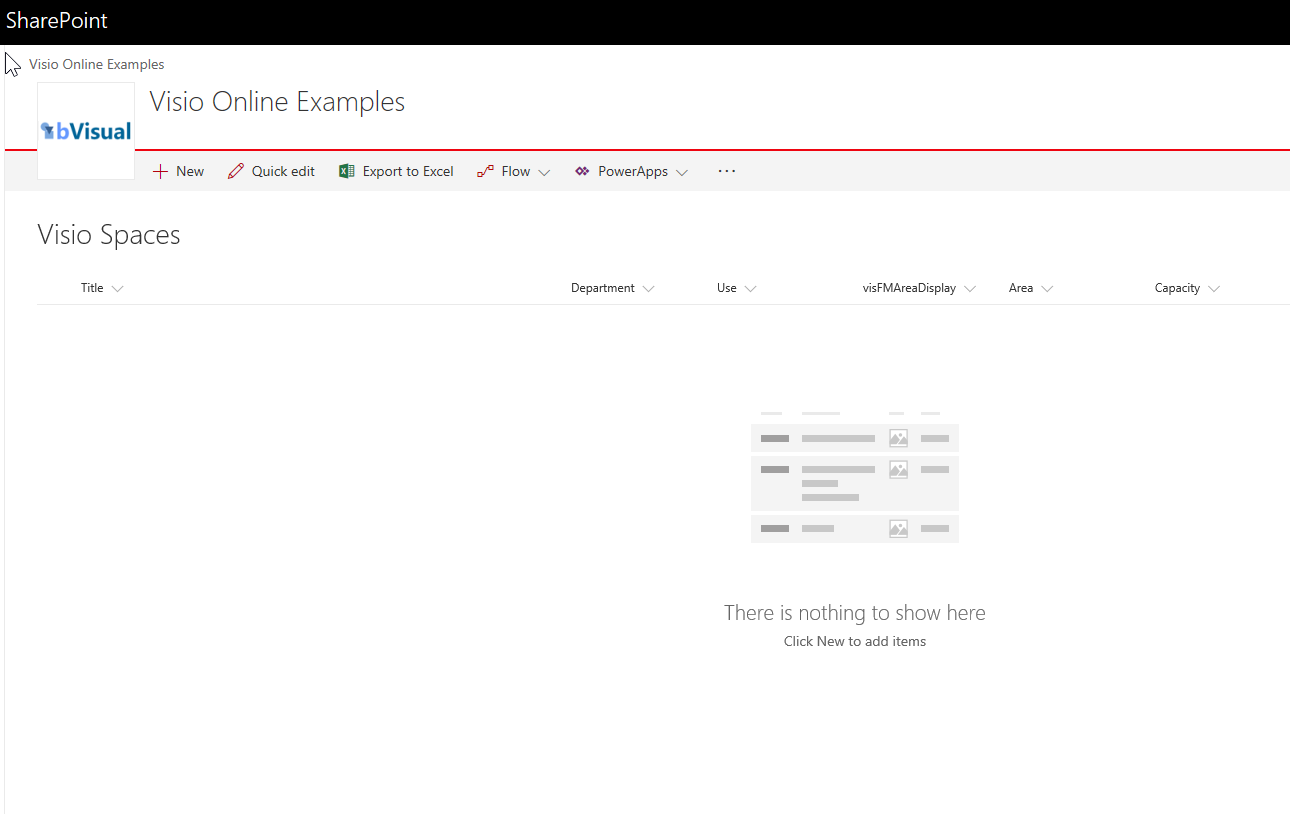
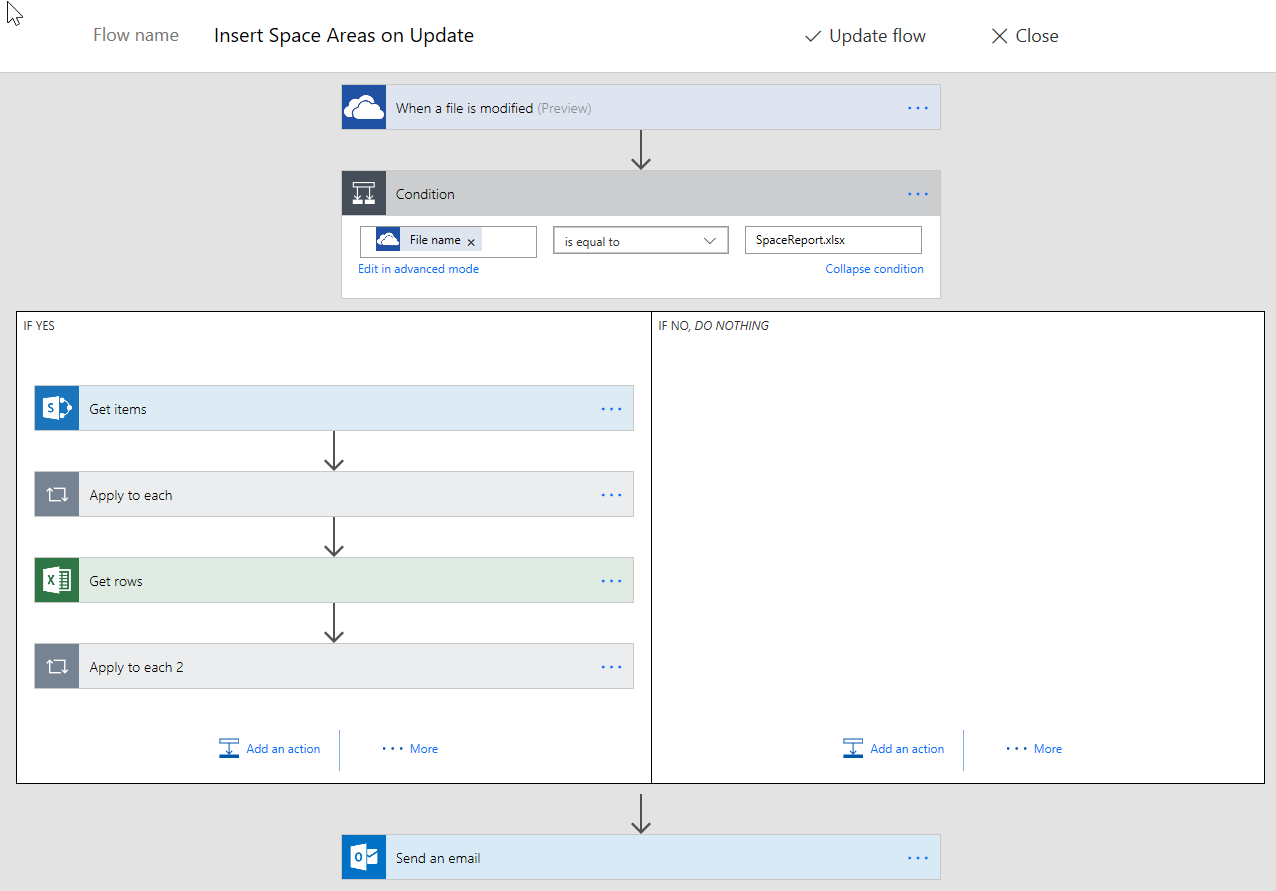
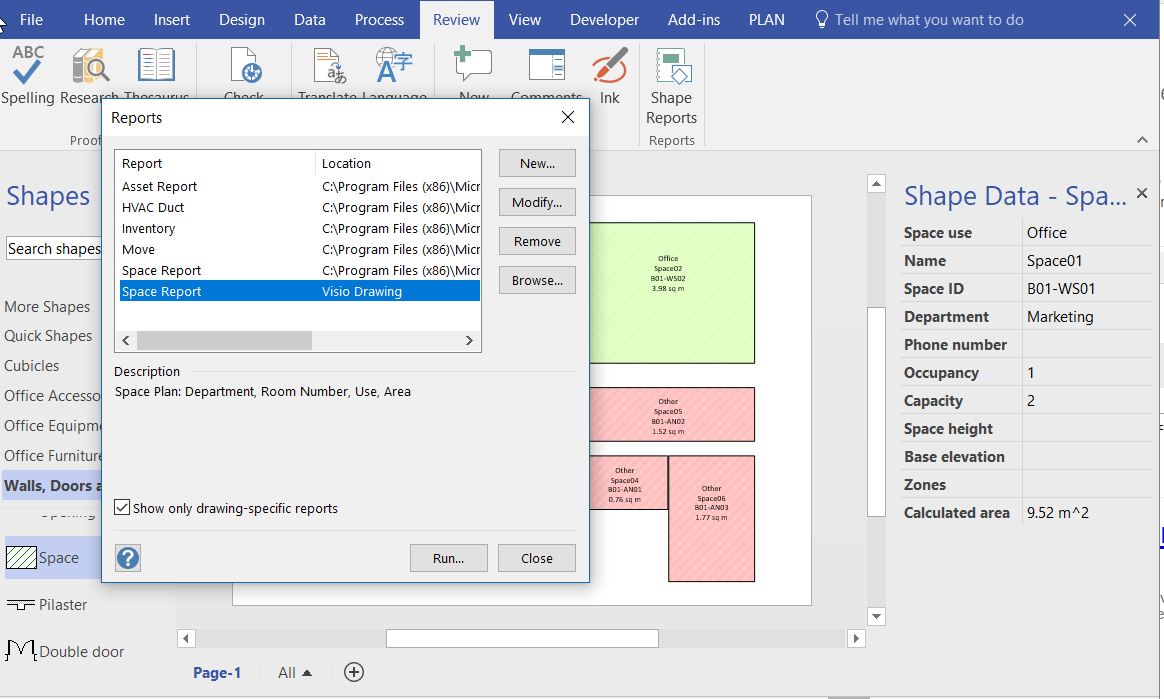
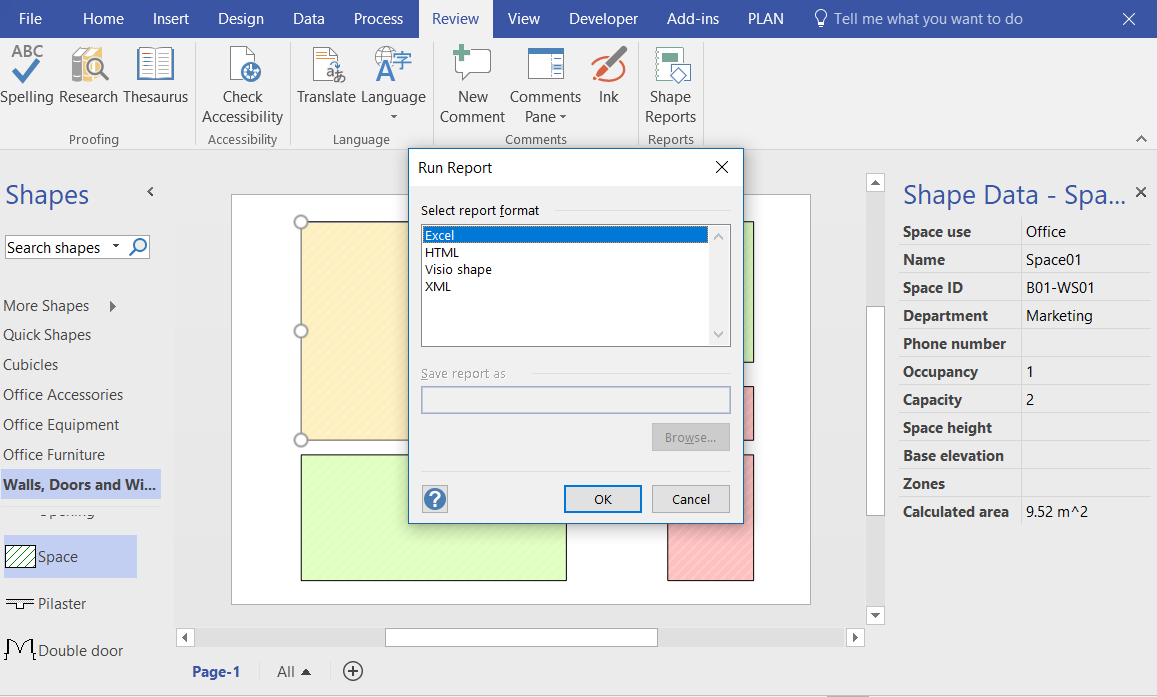
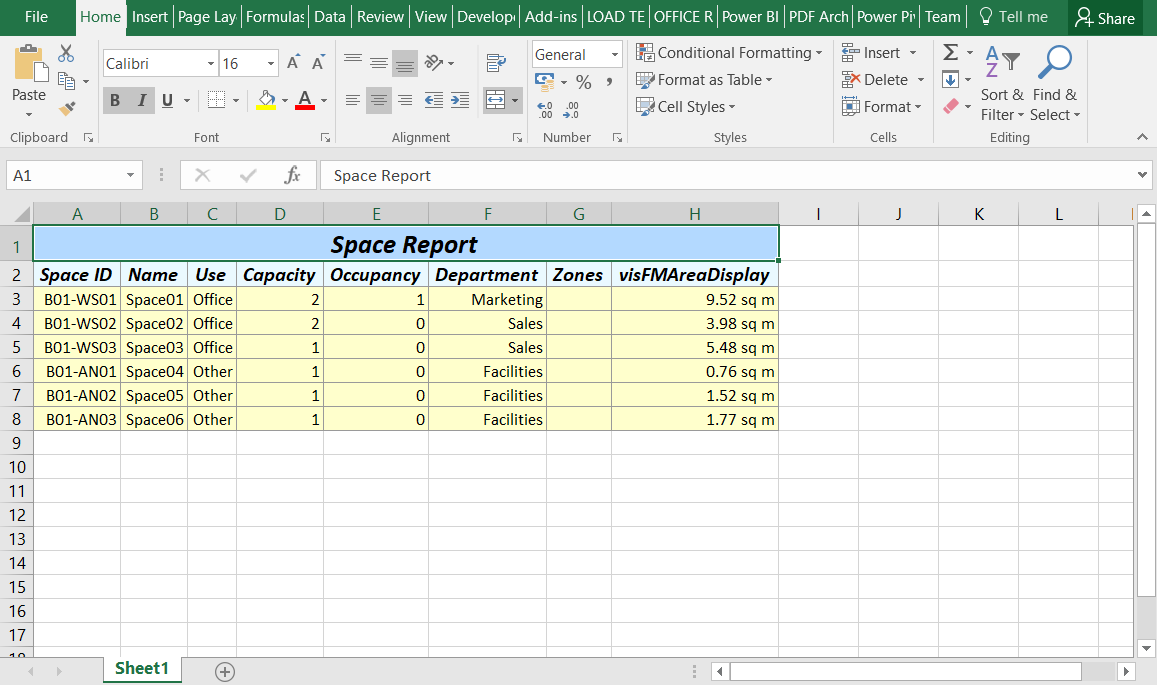
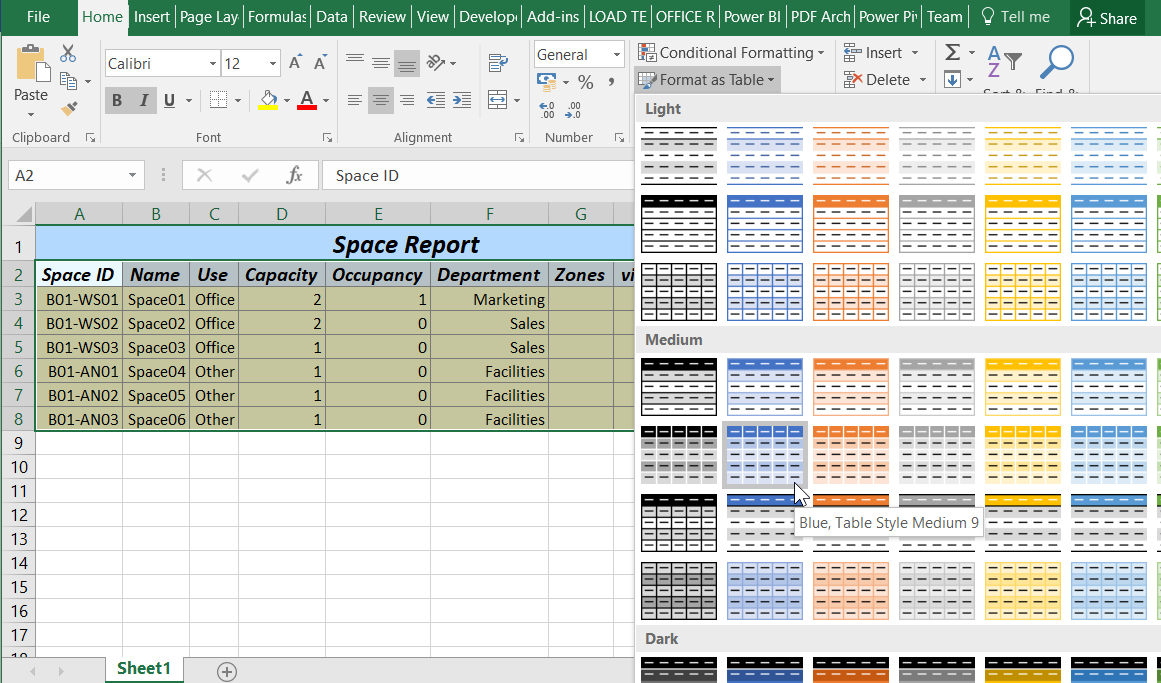
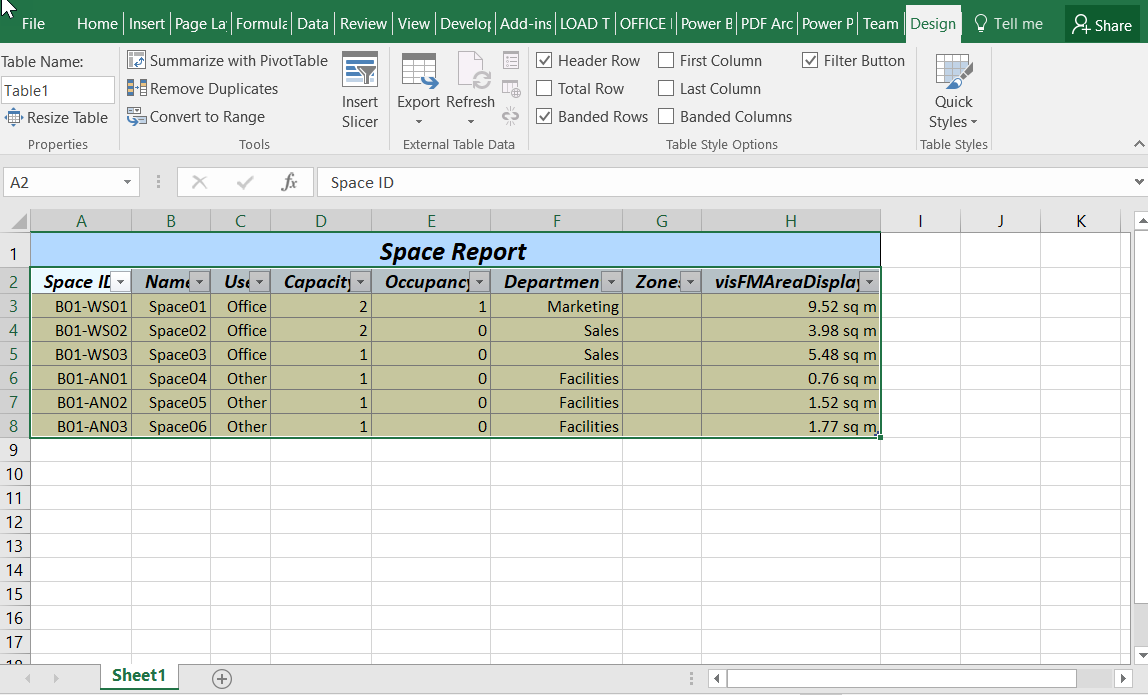
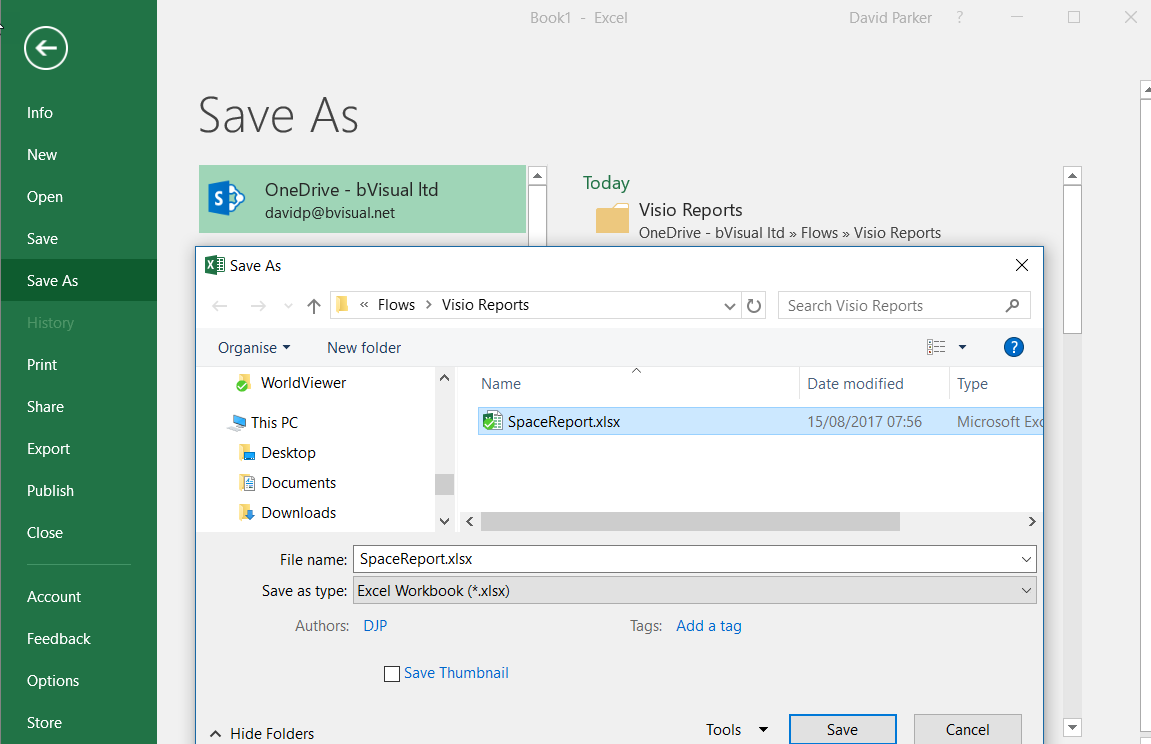
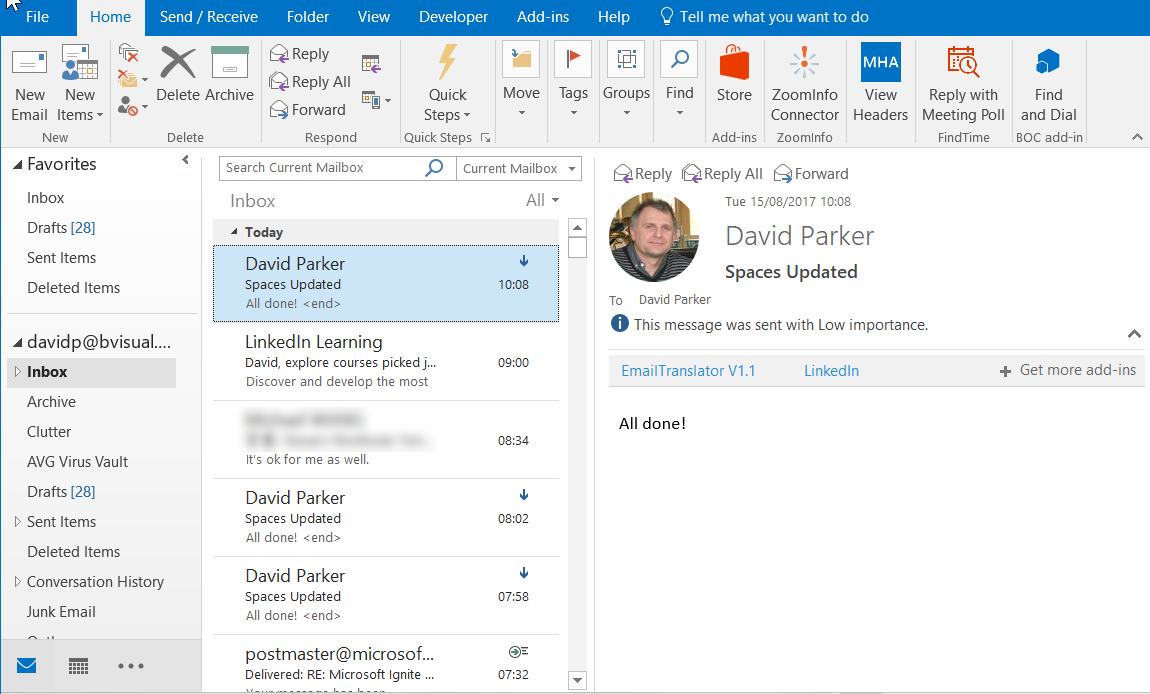
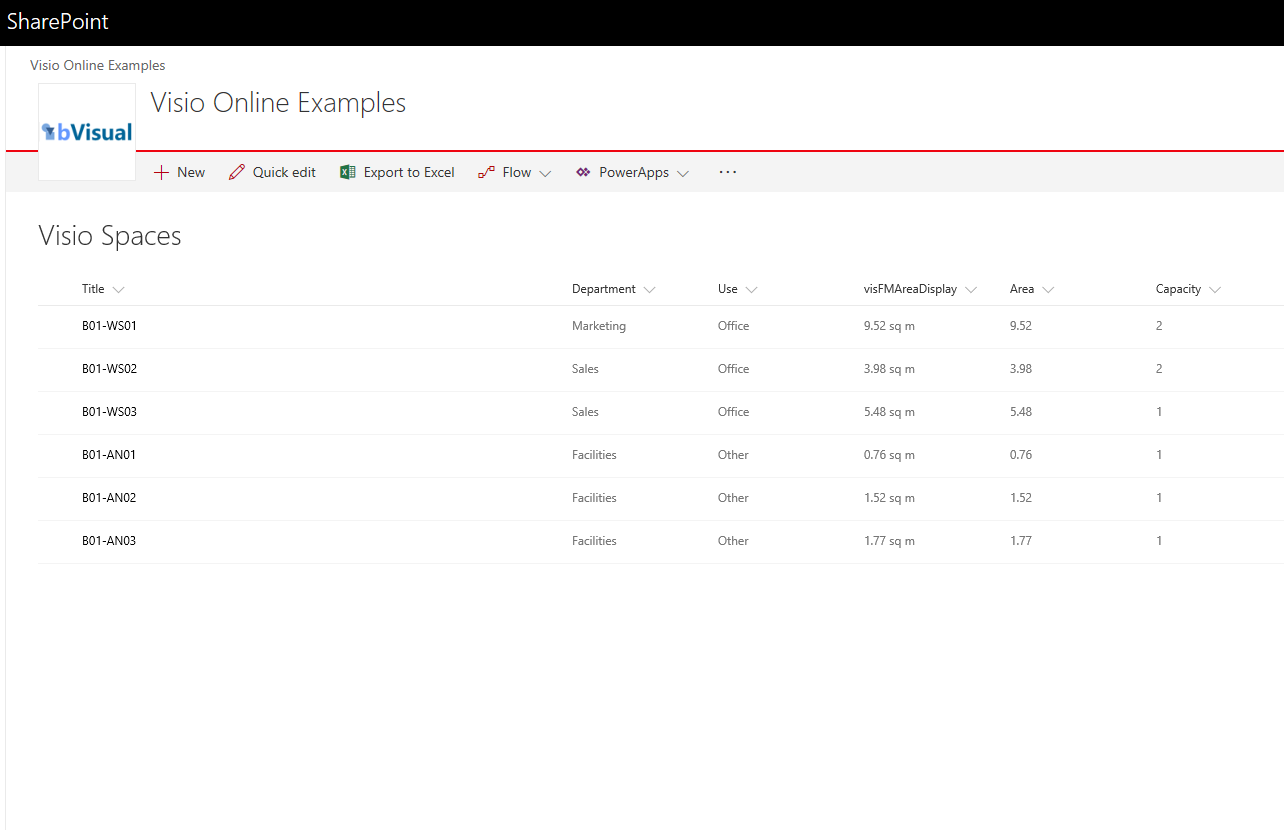
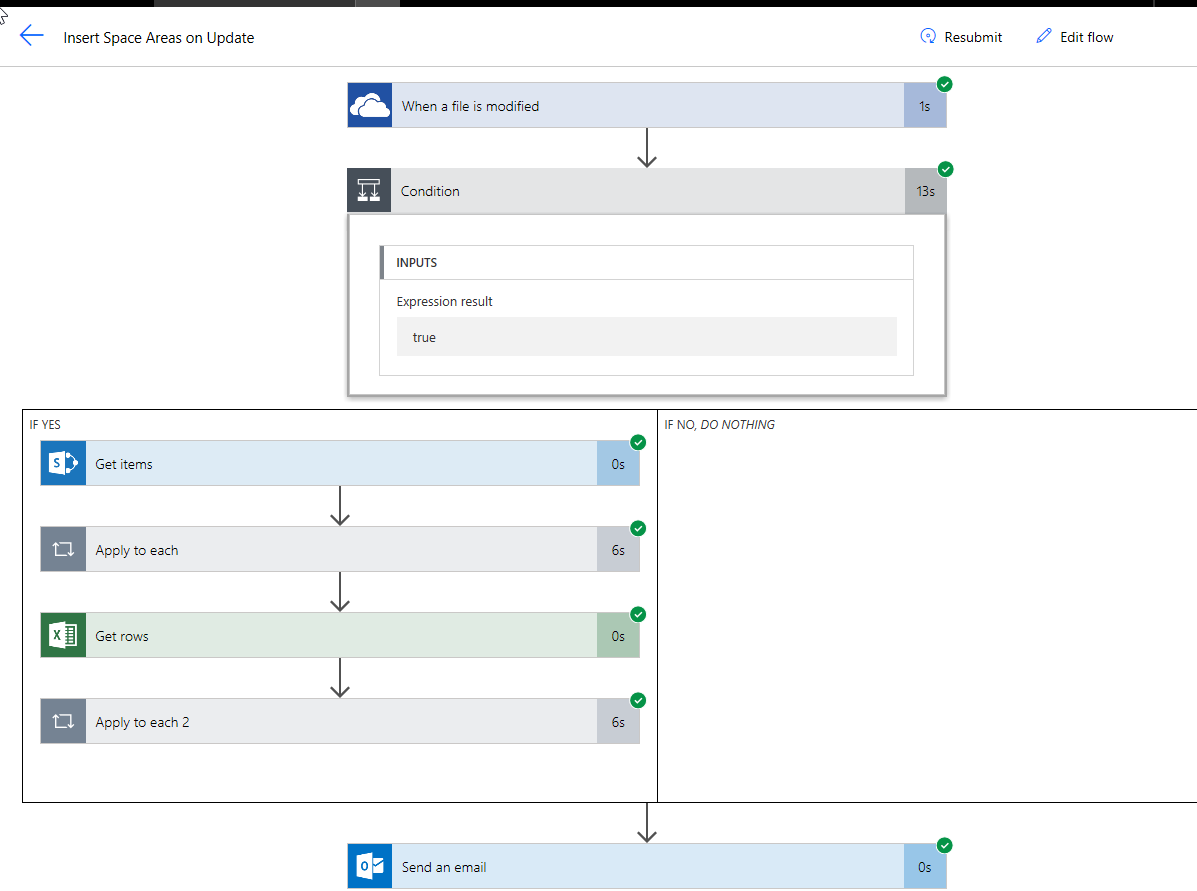
Most of my posts have been about using Visio as a data consumer by linking Visio shapes to data, but Visio can be the best place to create some data from. For example, an office layout can have personnel or equipment shapes within a workstation area, or space shapes are used to define areas which are used for calculating the space usage chargeback reports. There are non-facilities management related examples too, as the only consideration is what is the best way to create relationships, measure lengths, or calculate areas. These are all tasks that are best done by just moving, resizing, connecting or containing shapes interactively in the Visio interface. In this article I will explain how Microsoft Flow can be used update a data source simply from a Visio document.
[Read more…] about Updating data sources from Visio using MSFlow … easily!Power Platform
Previewing the Visio Custom Visual in PowerBI
It is time to talk about the new Visio custom visual for PowerBI. You may have read about it at Visio Power BI example and Add Visio visualizations to Power BI reports, but I wanted to add my findings. First, it is great to see this feature, but it is not yet the finished article. However, I hope I can show that it can be an extremely useful addition to the business intelligence toolset from Microsoft. I think that the existing Link Data to Shapes and Data Graphics features in Visio desktop are considered to be Operational Intelligence capabilities, whereas this new custom visual for PowerBI is definitely Business Intelligence. This is a different discipline, and I have been developing some guidelines for good practice when using Visio with PowerBI. In this article, I will demonstrate how I created a PowerBI dashboard using graphics and data from last years Microsoft Ignite conference.

Let me set the expectations because I am working with a preview of the Visio custom visual.
[Read more…] about Previewing the Visio Custom Visual in PowerBIWhat is the future of Visio on the desktop?
Microsoft are about to announce sweeping changes to their worldwide software sales channels as they continue to emphasise that the future is in the cloud. We expect that this will mean a restructuring away from traditional desktop application sales. Visio has been one of these desktop applications for many years, and has a large, and mostly loyal, following. We Visio developers have been excited by the large number of advances in Visio features released over the past year or so, but has it moved quickly enough towards the cloud to save it from the deep cuts that are threatened? I hope so.
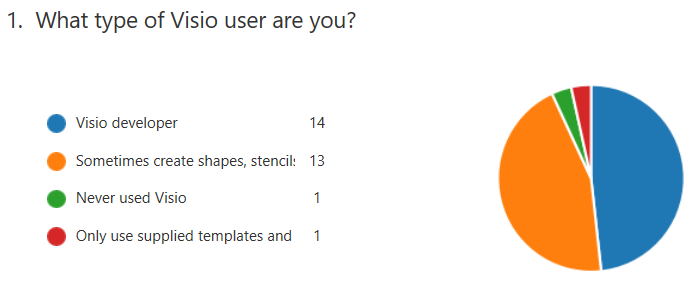
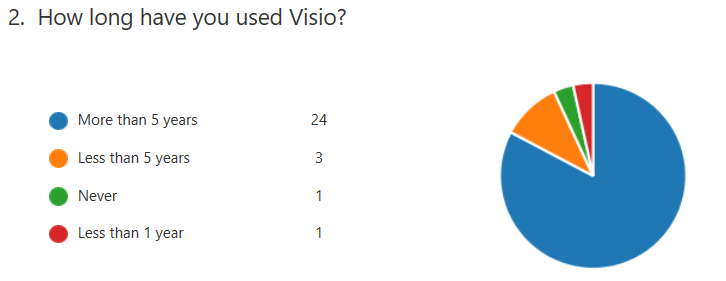
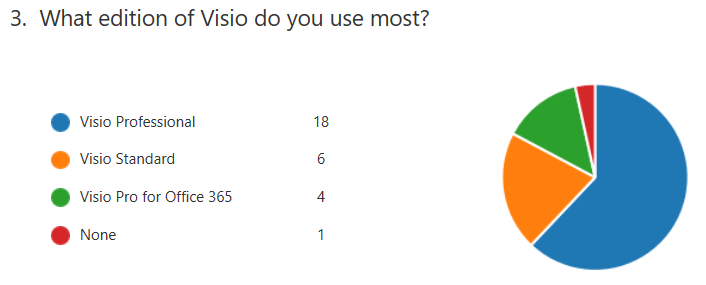
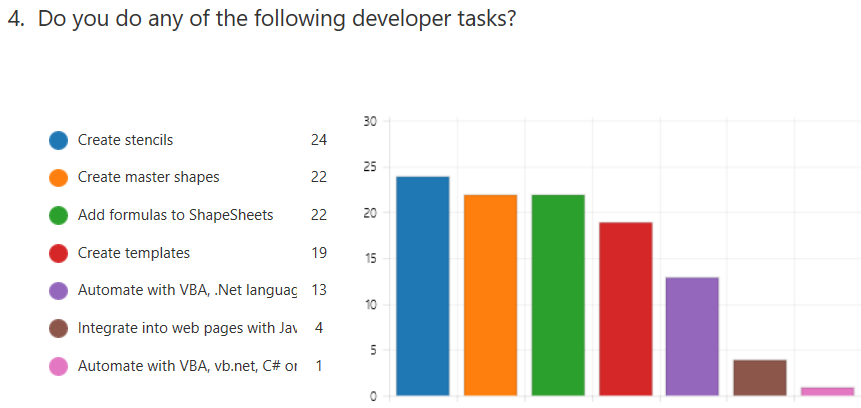
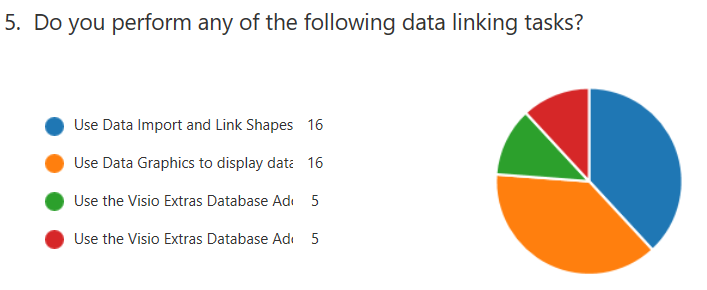
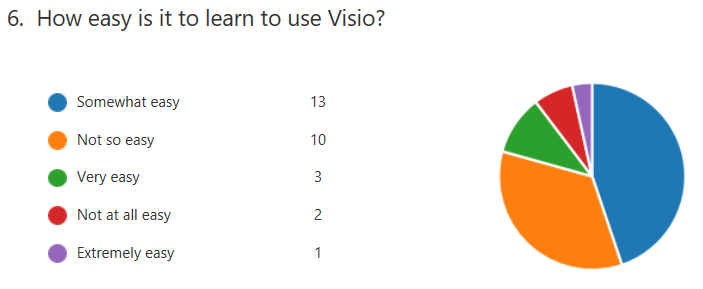
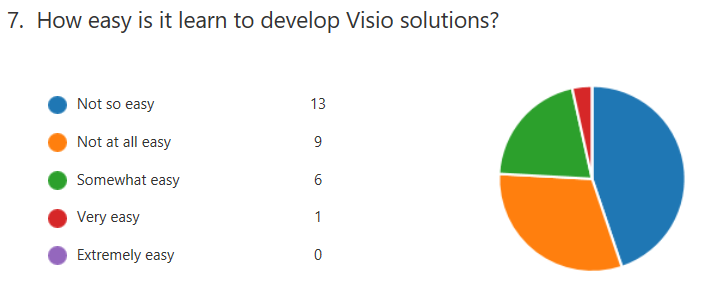
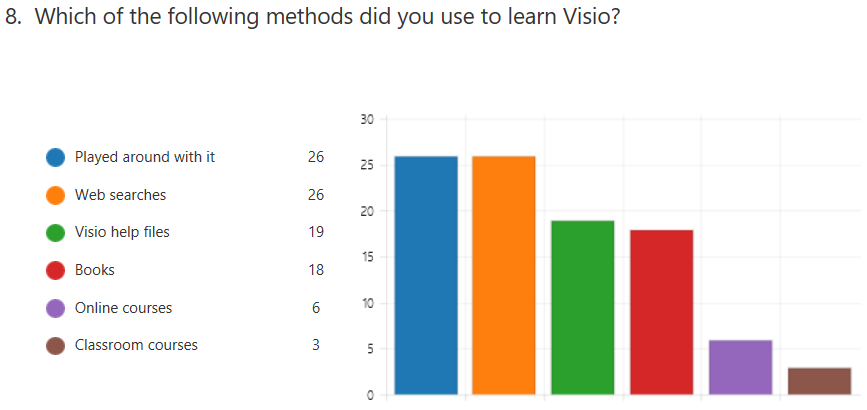
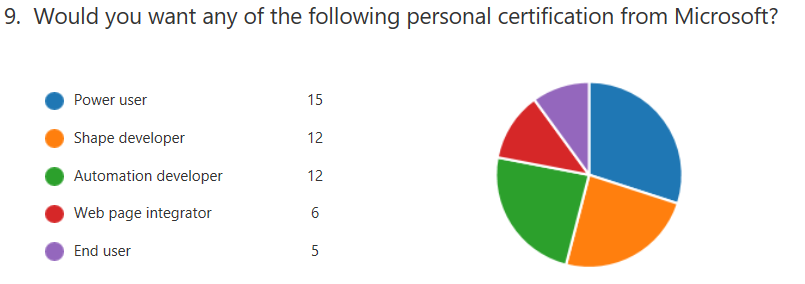
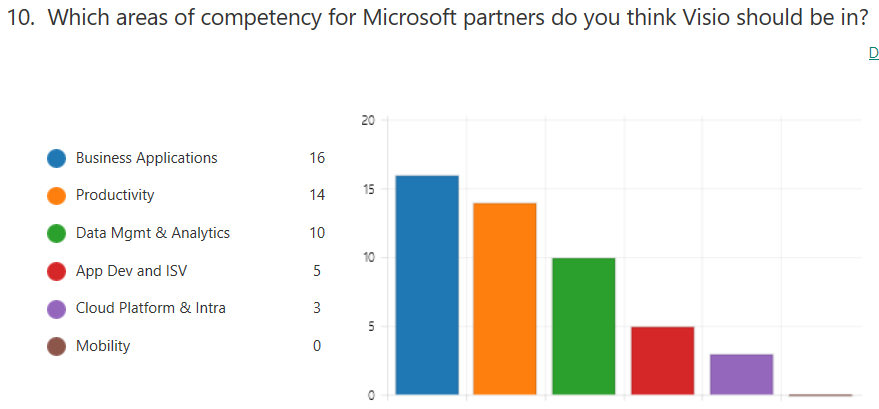
I recently created a short survey about learning Visio (A short survey about learning #Visio ) and these are the results that I have had so far:
Opening PowerApps from a hyperlink in Visio Online
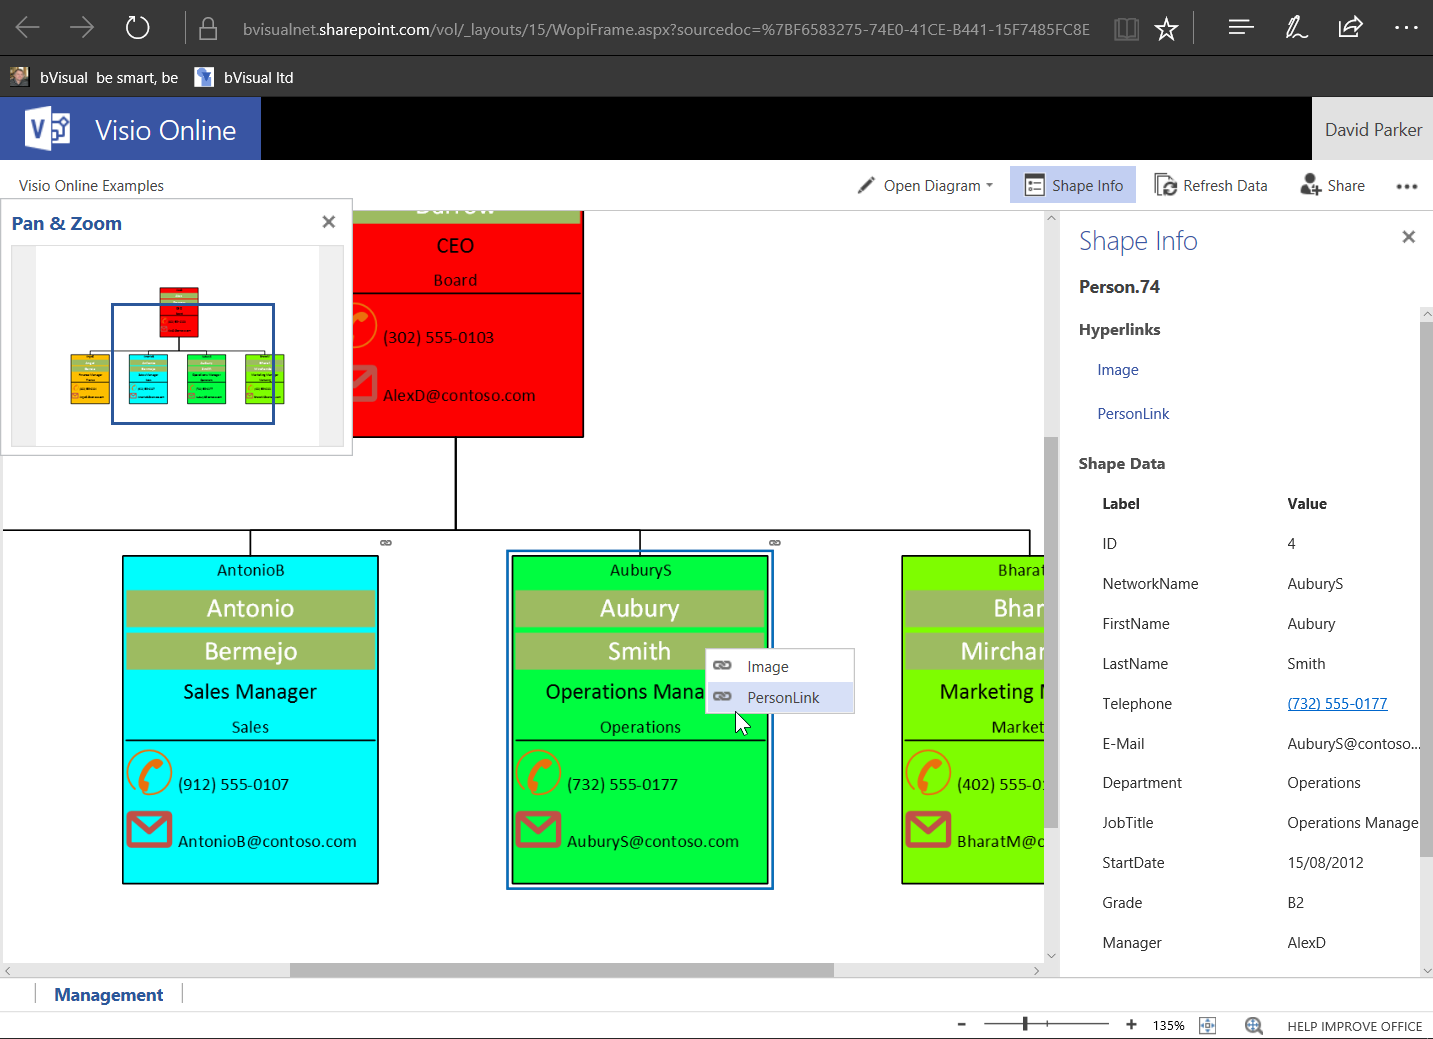
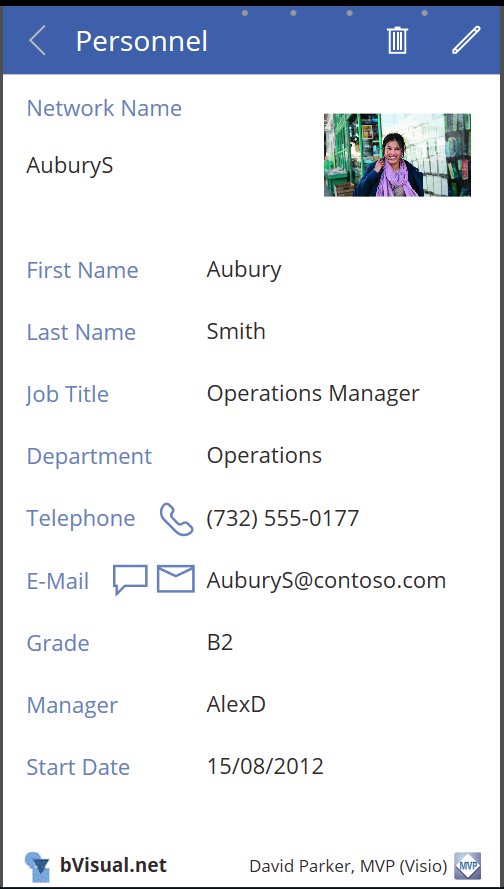
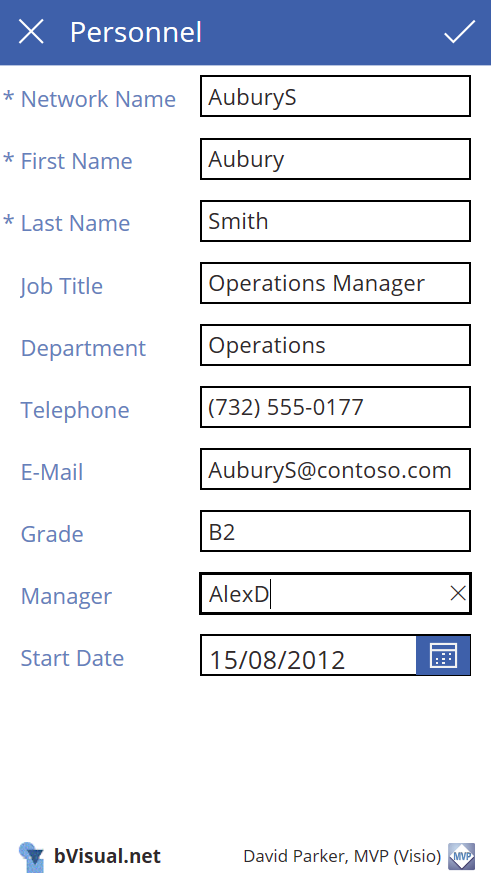
Microsoft PowerApps are apparently the future for views of SharePoint lists, amongst other data sources, replacing, it seems, both Microsoft InfoPath and Microsoft Access web apps … and probably more. I have previously described how to open an Access form from a Visio shape hyperlink ( see Opening an MS Access form from a Visio shape), so now I need to open a specified PowerApps screen and record instead … as shown below:
MSIgnite Sessions to Watch in Visio
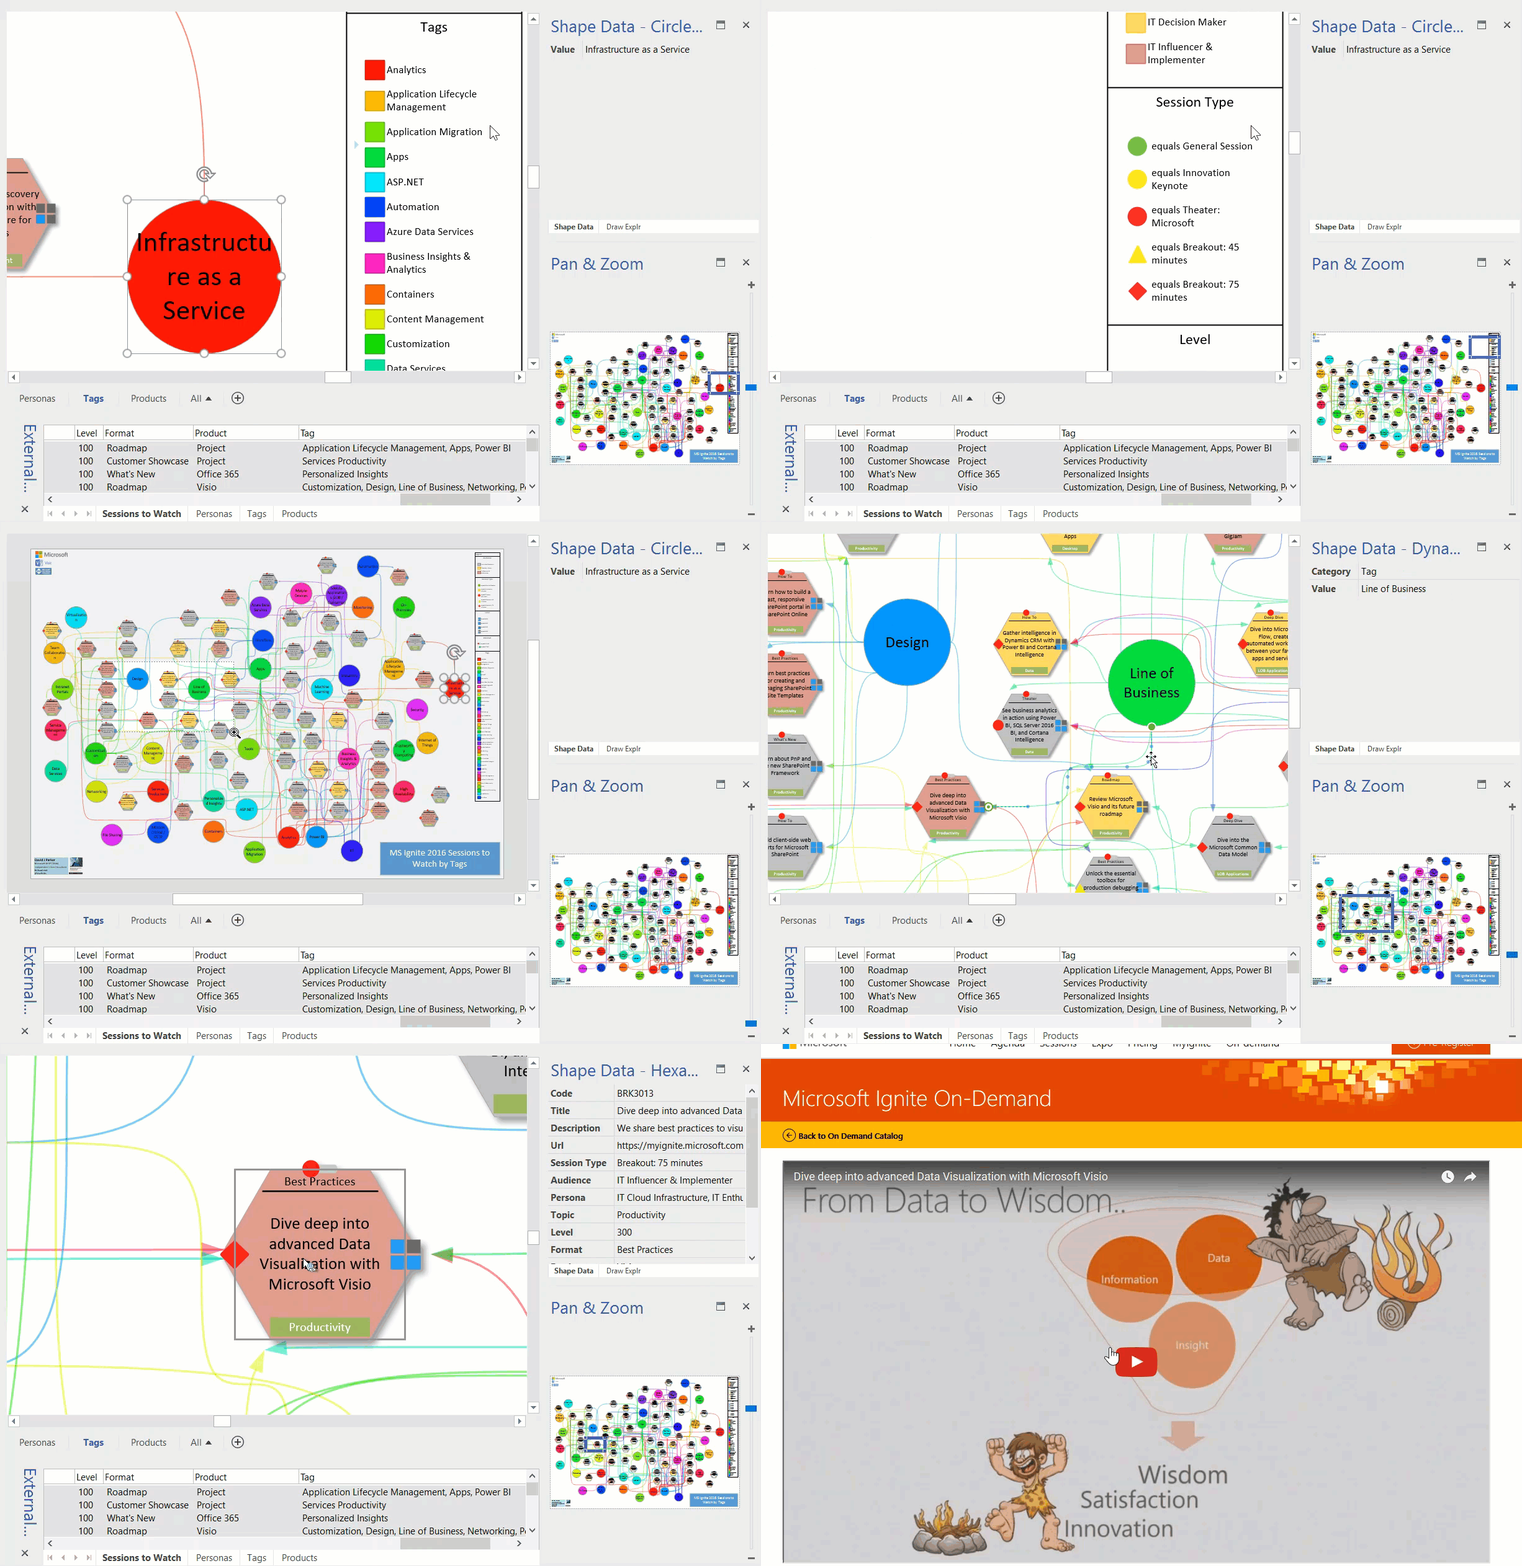
Well, MS Ignite is over for another year. I planned to visit loads of sessions, but the reality was that I spent many hours on the Visio booth. Fortunately, many of them were recorded, including ours, but I don’t have time to watch over 700 videos! So, I looked through them all and picked out 50-odd, and used Get & Transform in Excel again to create suitable queries to link to Visio.
The more I use PowerQuery, the more I like it. I was able to extract the unique values in the Personas, Tags, and Products columns which each contained comma separated lists. I data-linked these values to large circles on different pages, and data-linked the Sessions to Watch to hexagonal shapes. I then wrote a little VBA code to link the circles to the hexagons with data-linked connectors. Data Graphics was applied to all shapes, including the connectors, and a legend added. Each of the Session hexagons have an automatically created hyperlink to the On-Demand Video. I used a standard radial page layout so that I had minimal manual movement shapes.
The end result is a visual dashboard by Persona, Tag and Product to open the videos for the sessions I want to watch.
Power Map is looking pretty powerful!
I watched a presentation today about some of the new features of Power Map. I was impressed, and the surprising thing is that the data does not have to be location data to get a 3D visualisation. All that is needed is to establish a co-ordinate system and any data can be transformed … and it can even have a time dimension!
https://www.facebook.com/MSPowerMap
It can do some visualisations that are just not possible with Visio, but I could see that Visio could be used to feed custom maps to Power Map with base layers and a co-ordinate system.
Cool custom maps : https://blogs.office.com/2014/10/08/6-cool-ways-use-custom-maps/
I will play some more with this soon….
