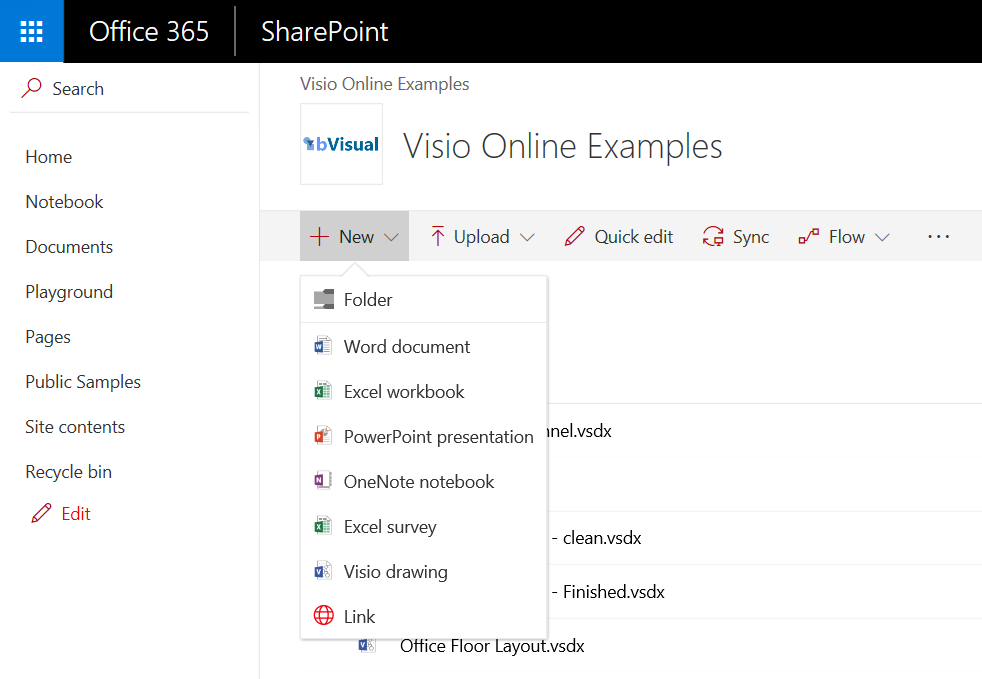
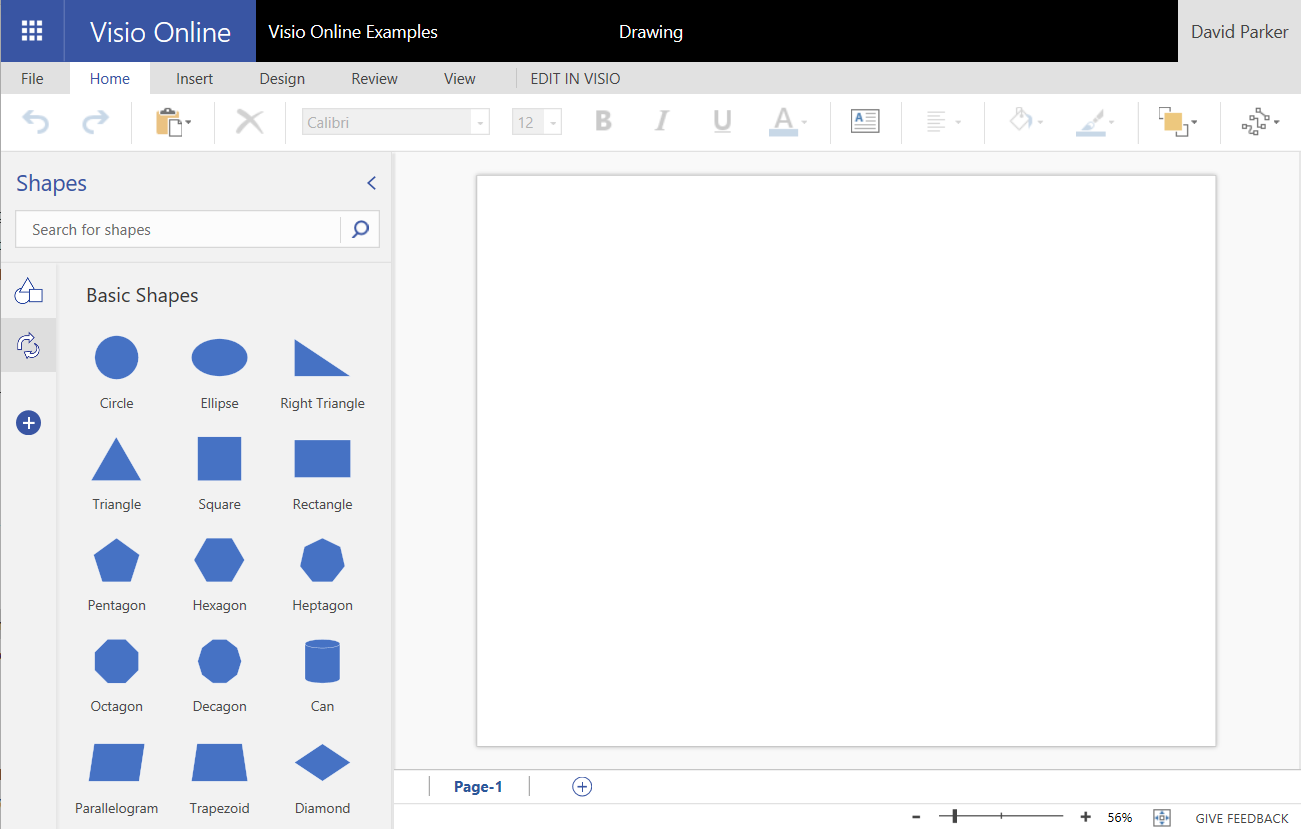
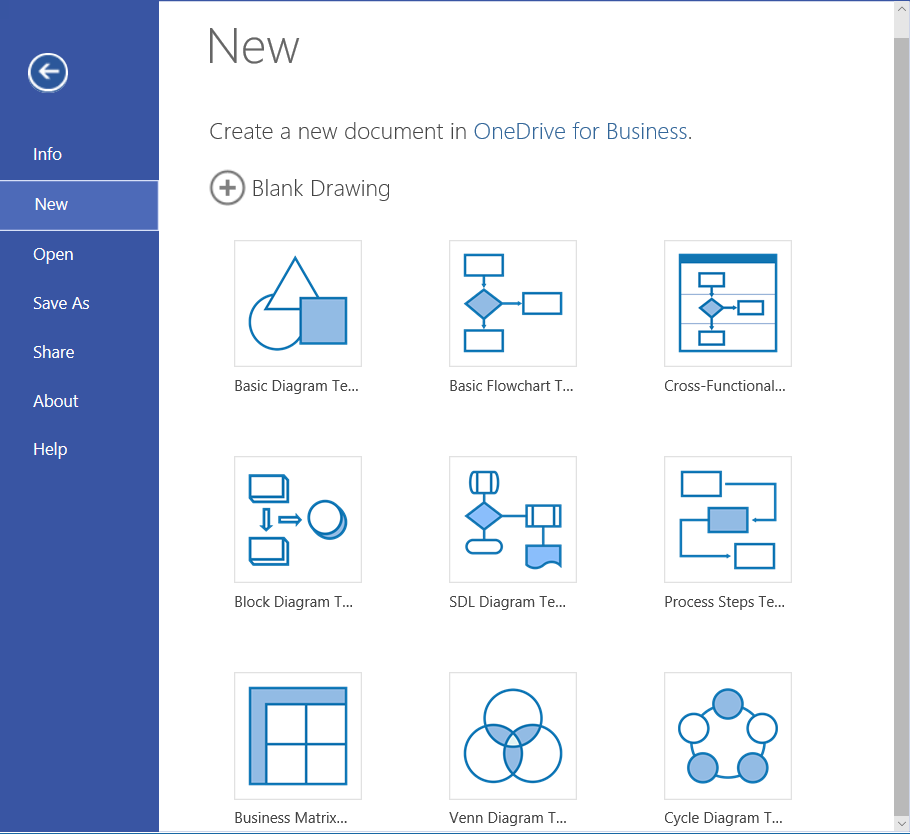
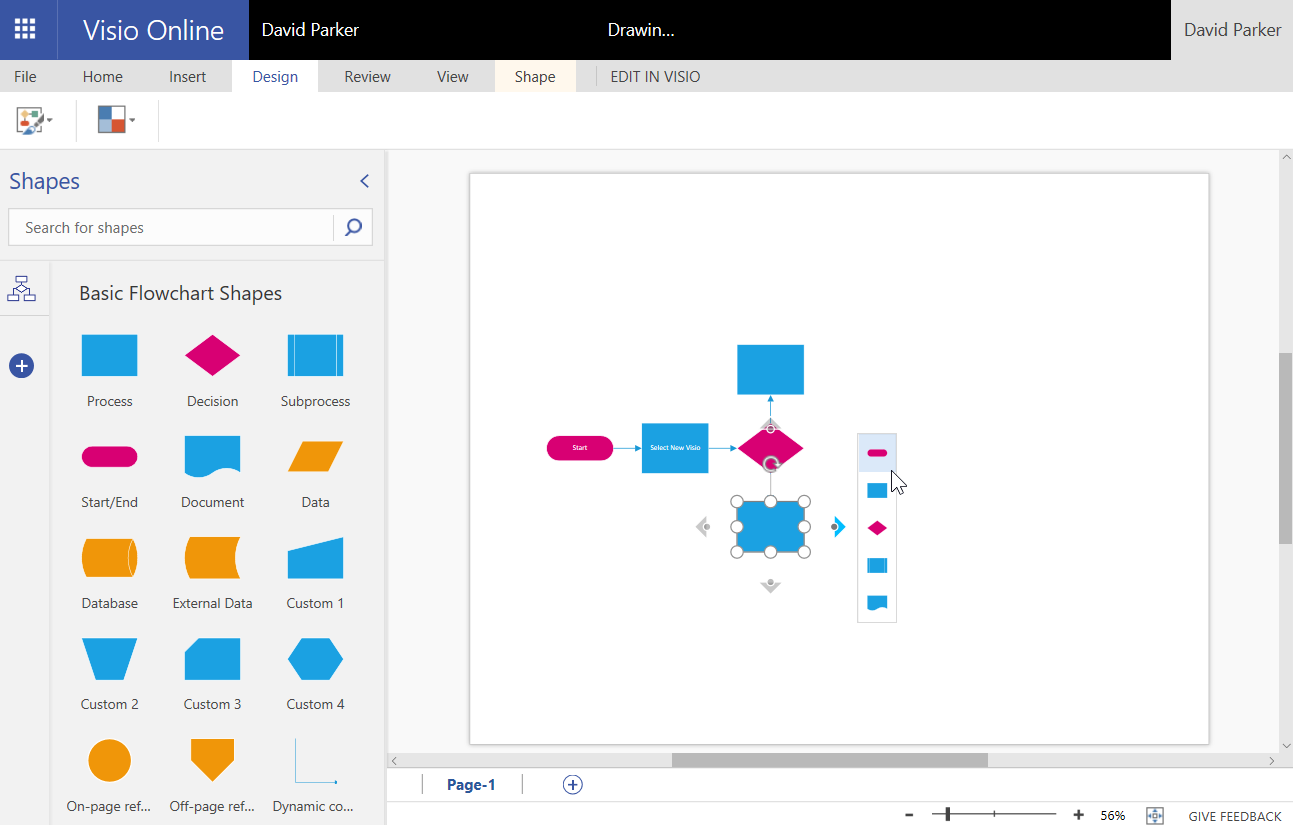
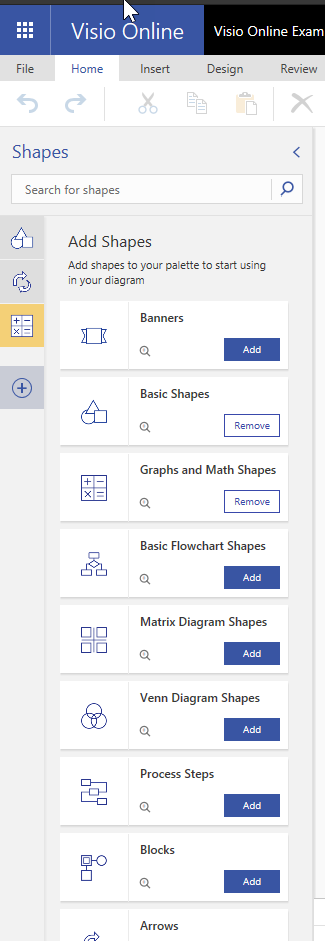
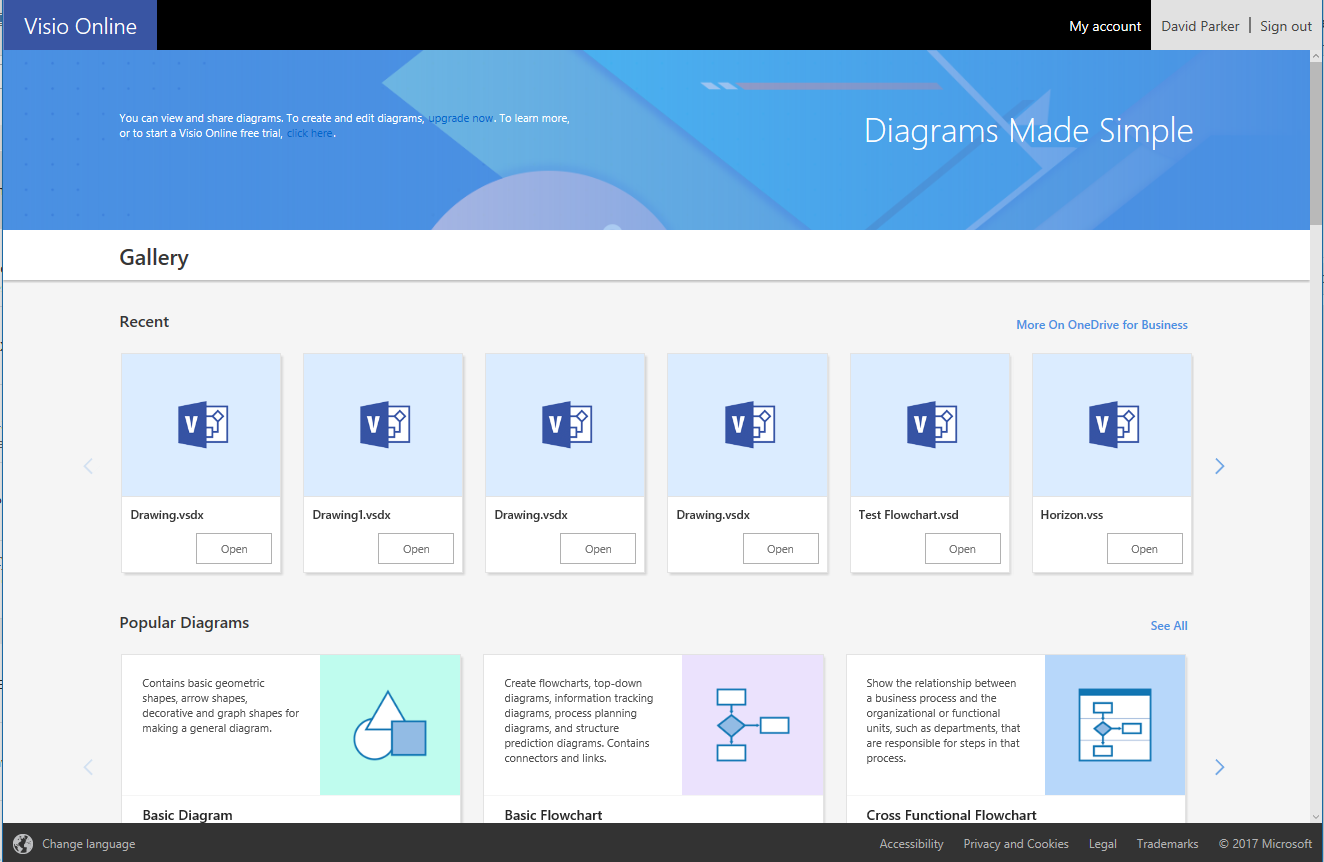
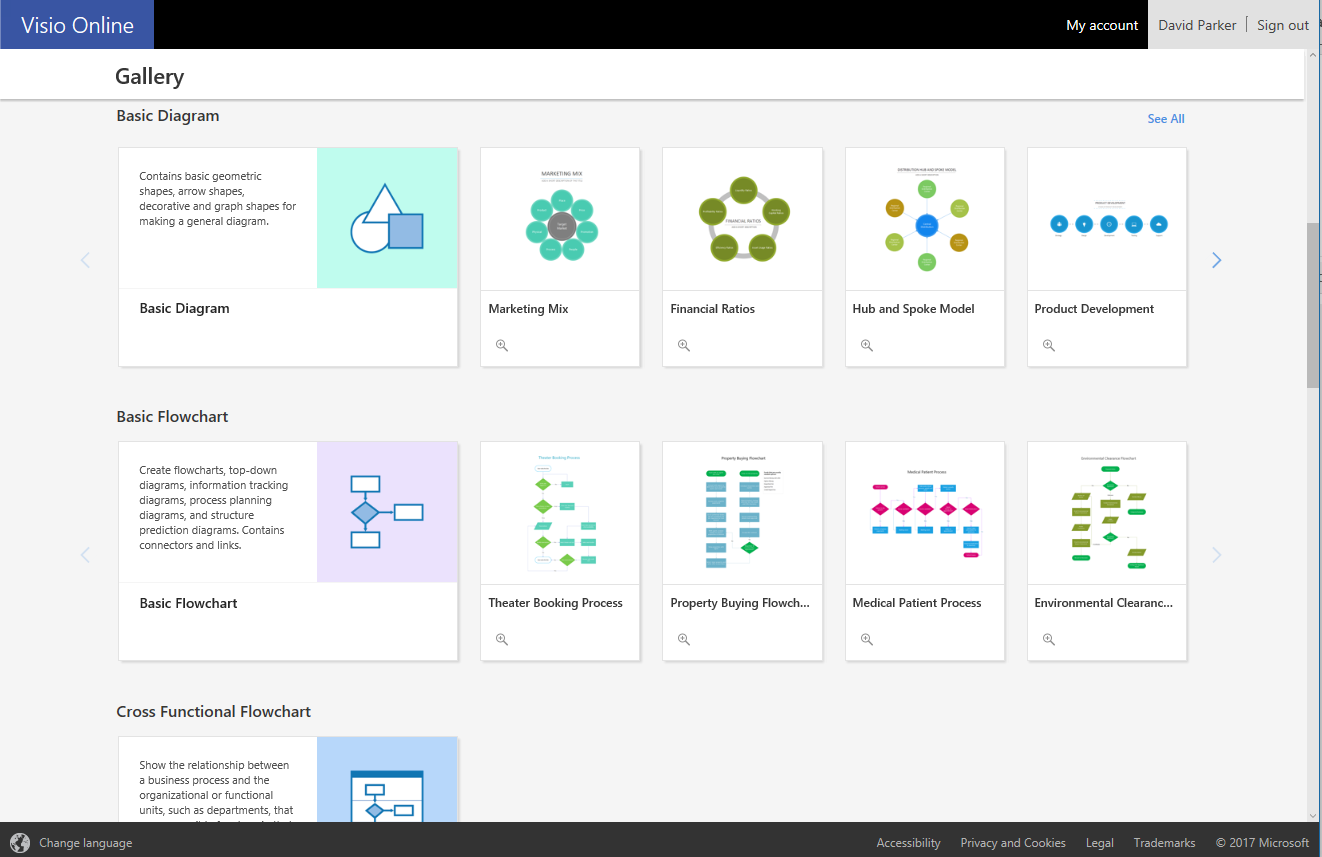
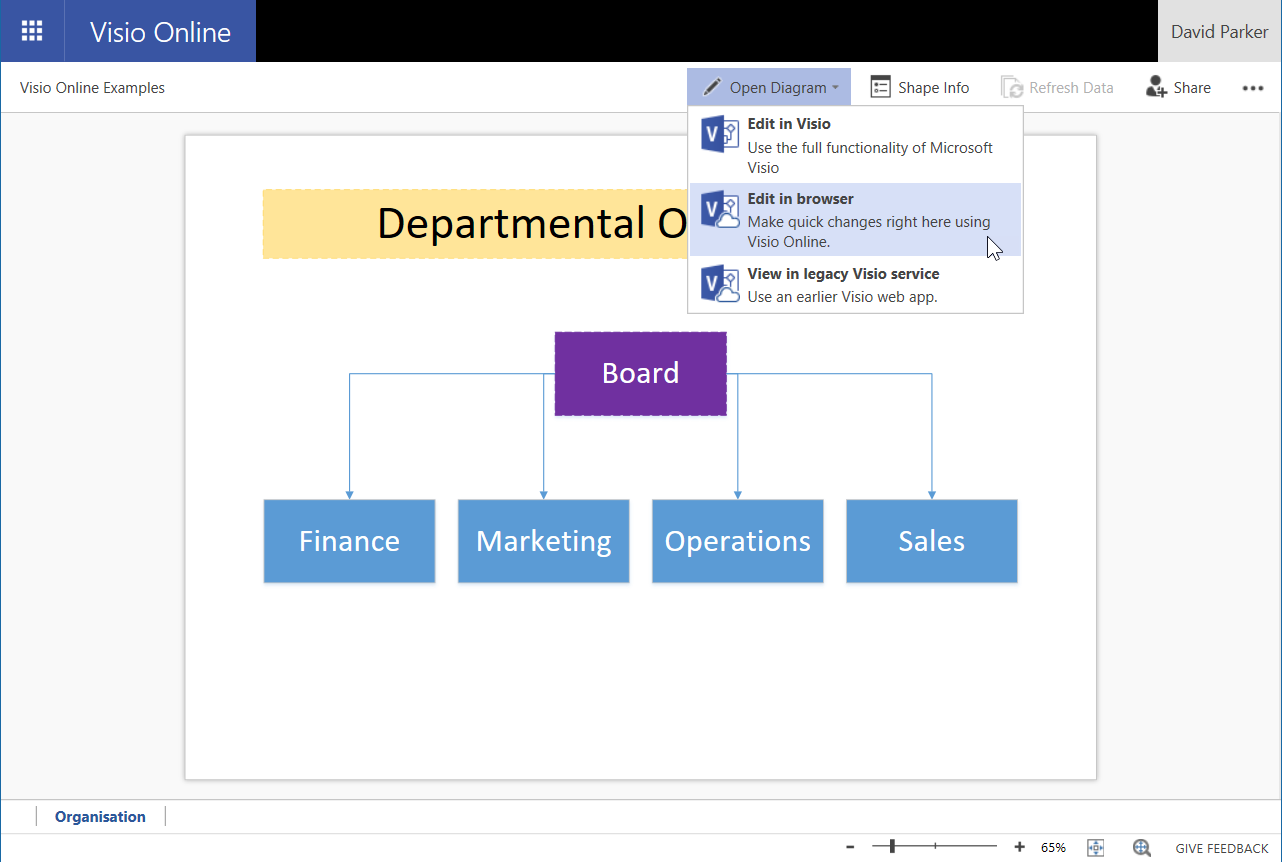
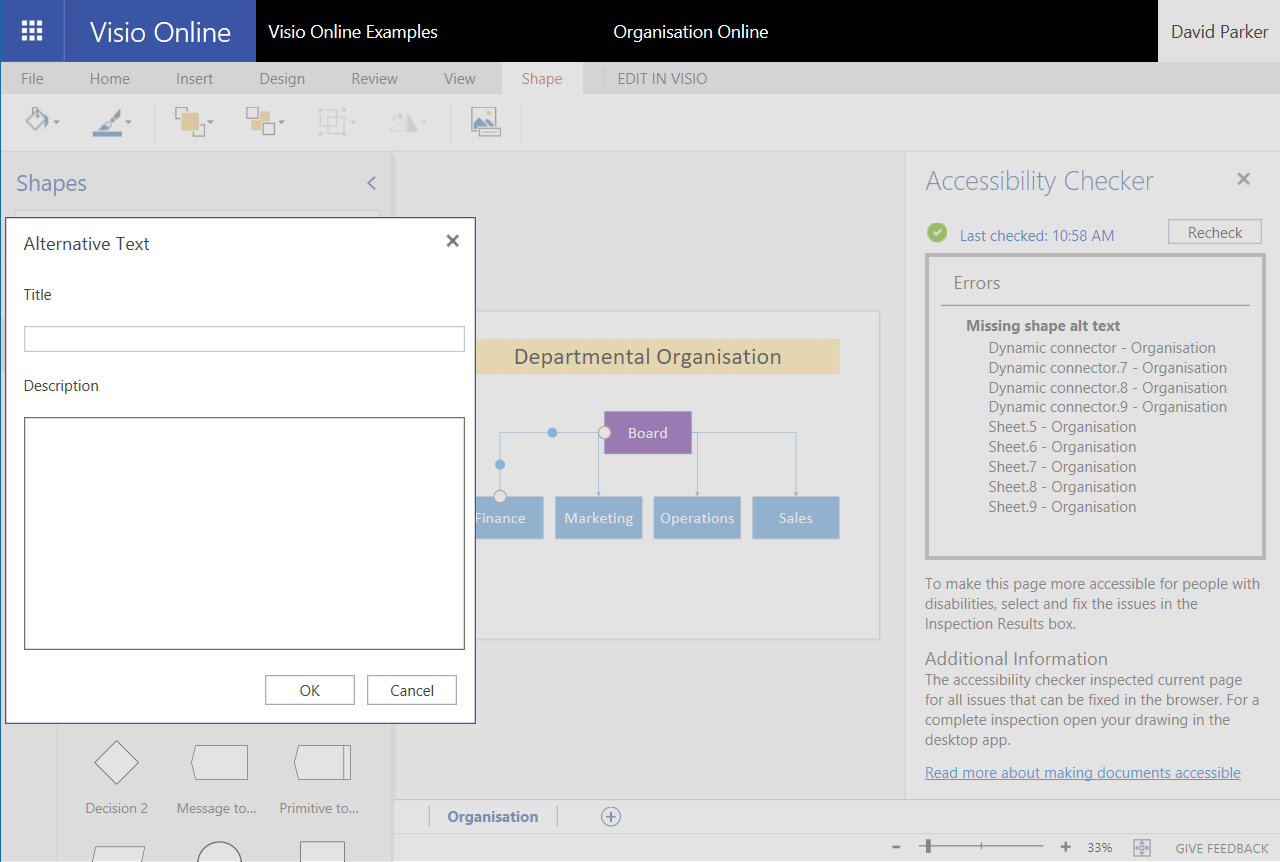
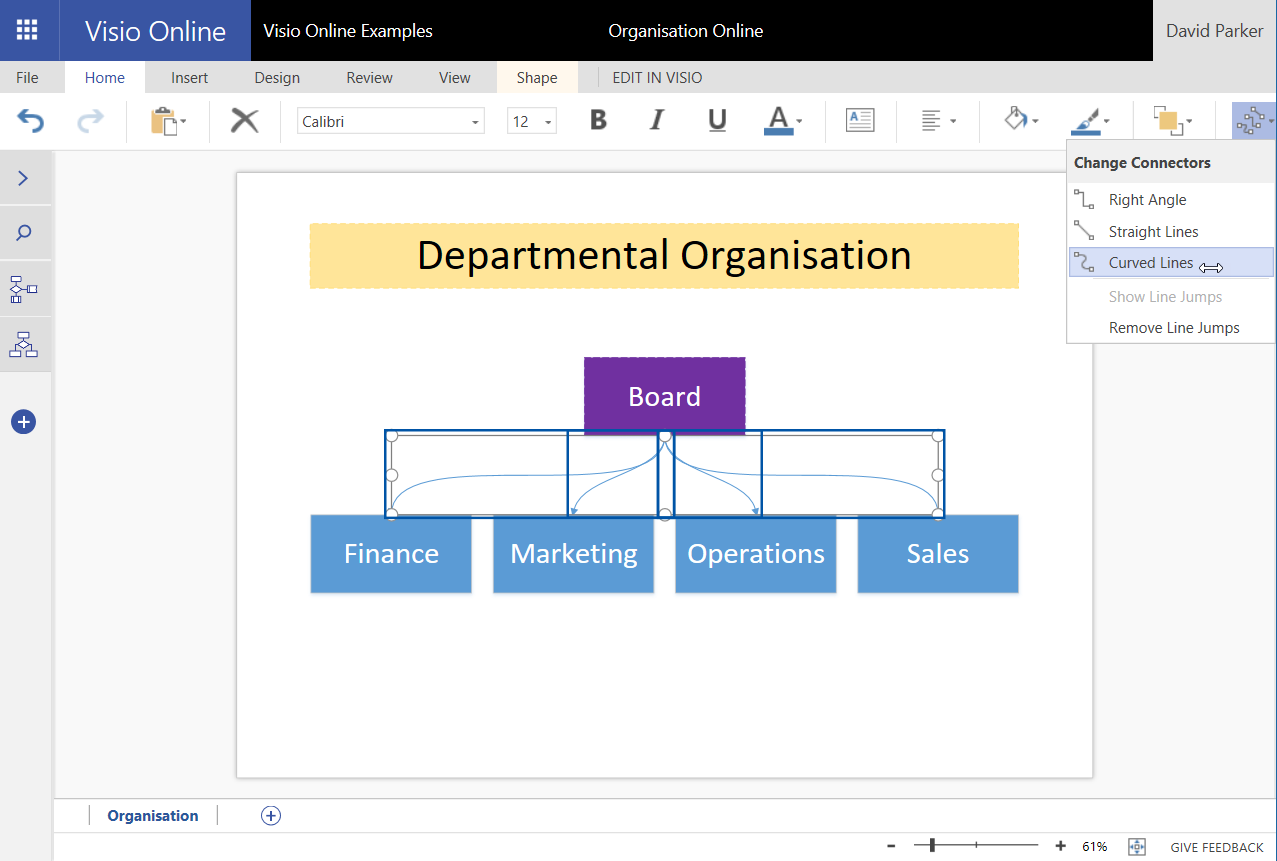
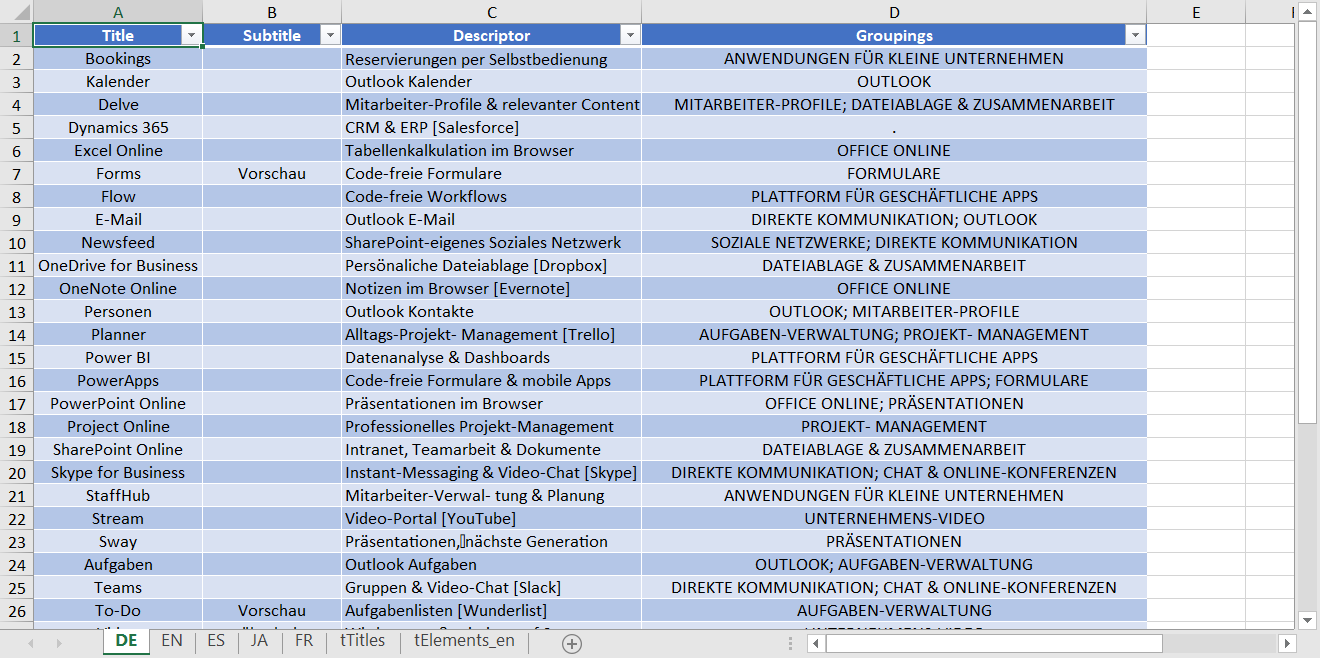
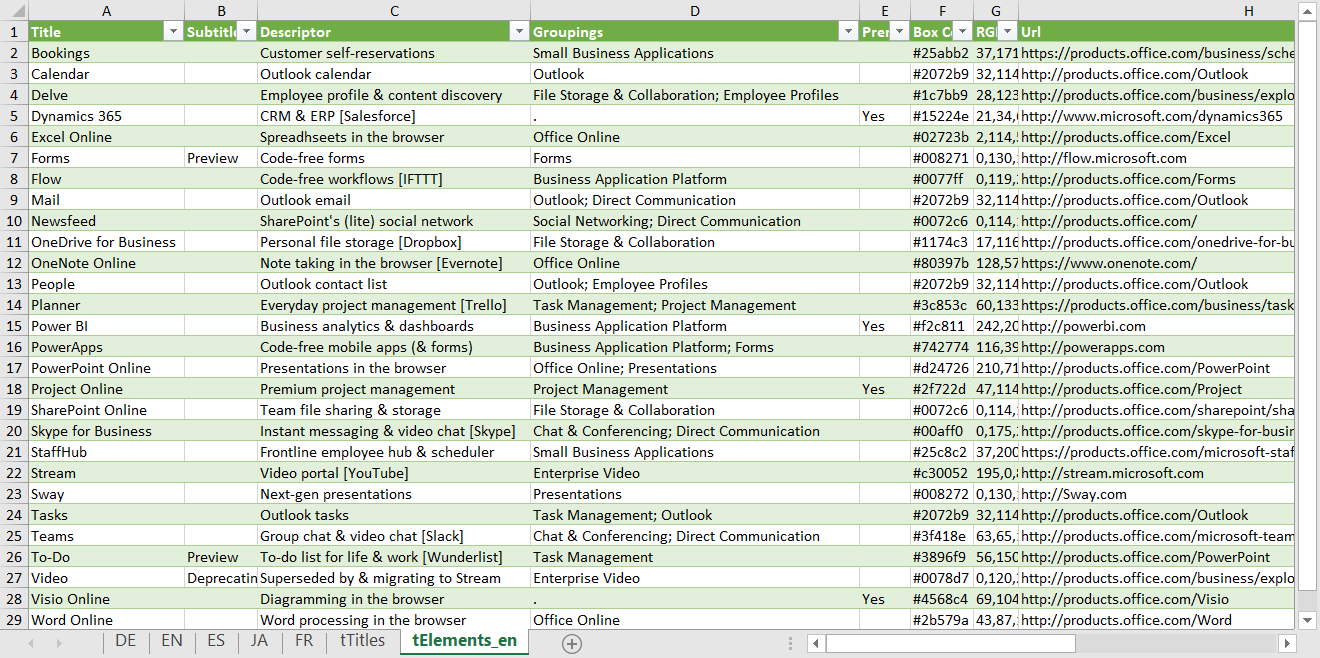
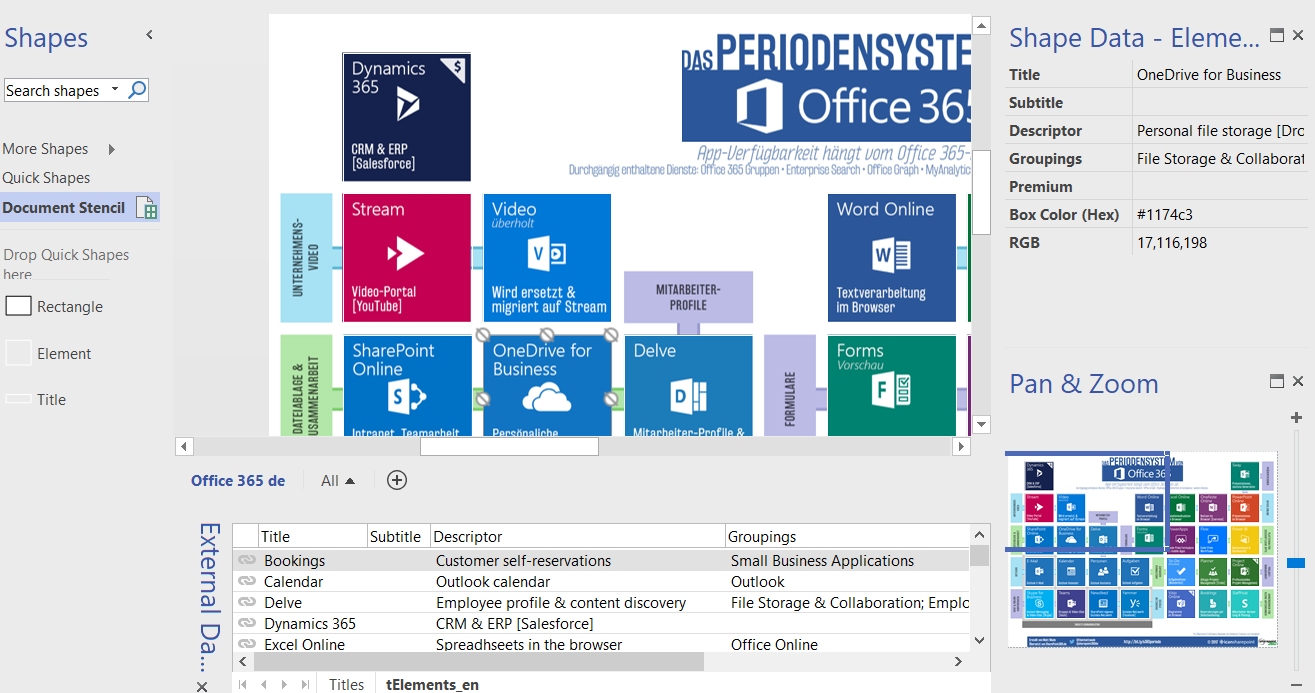
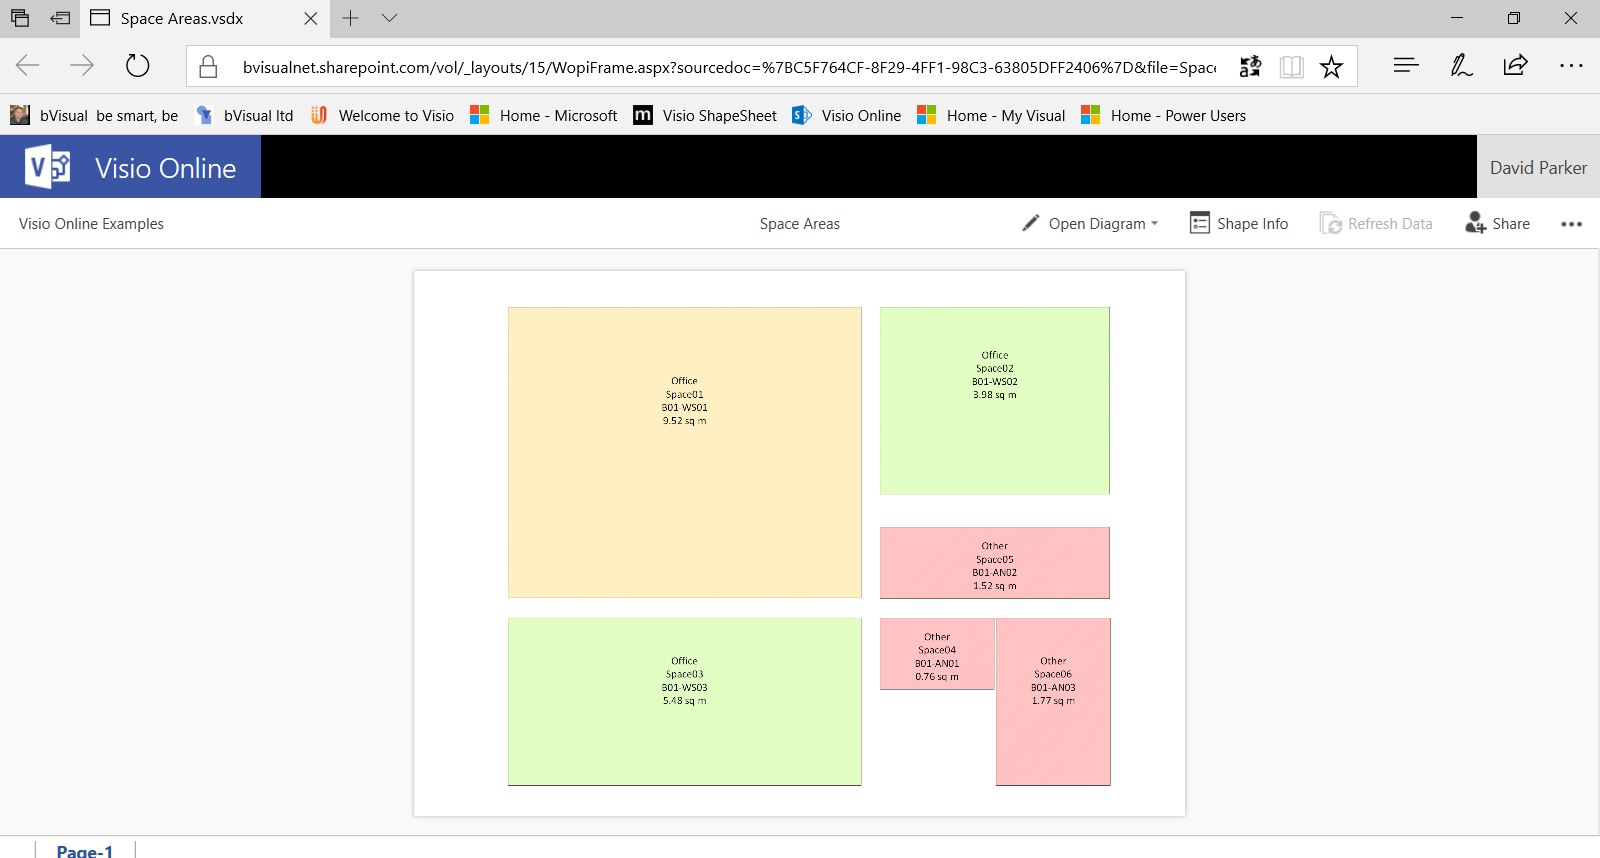
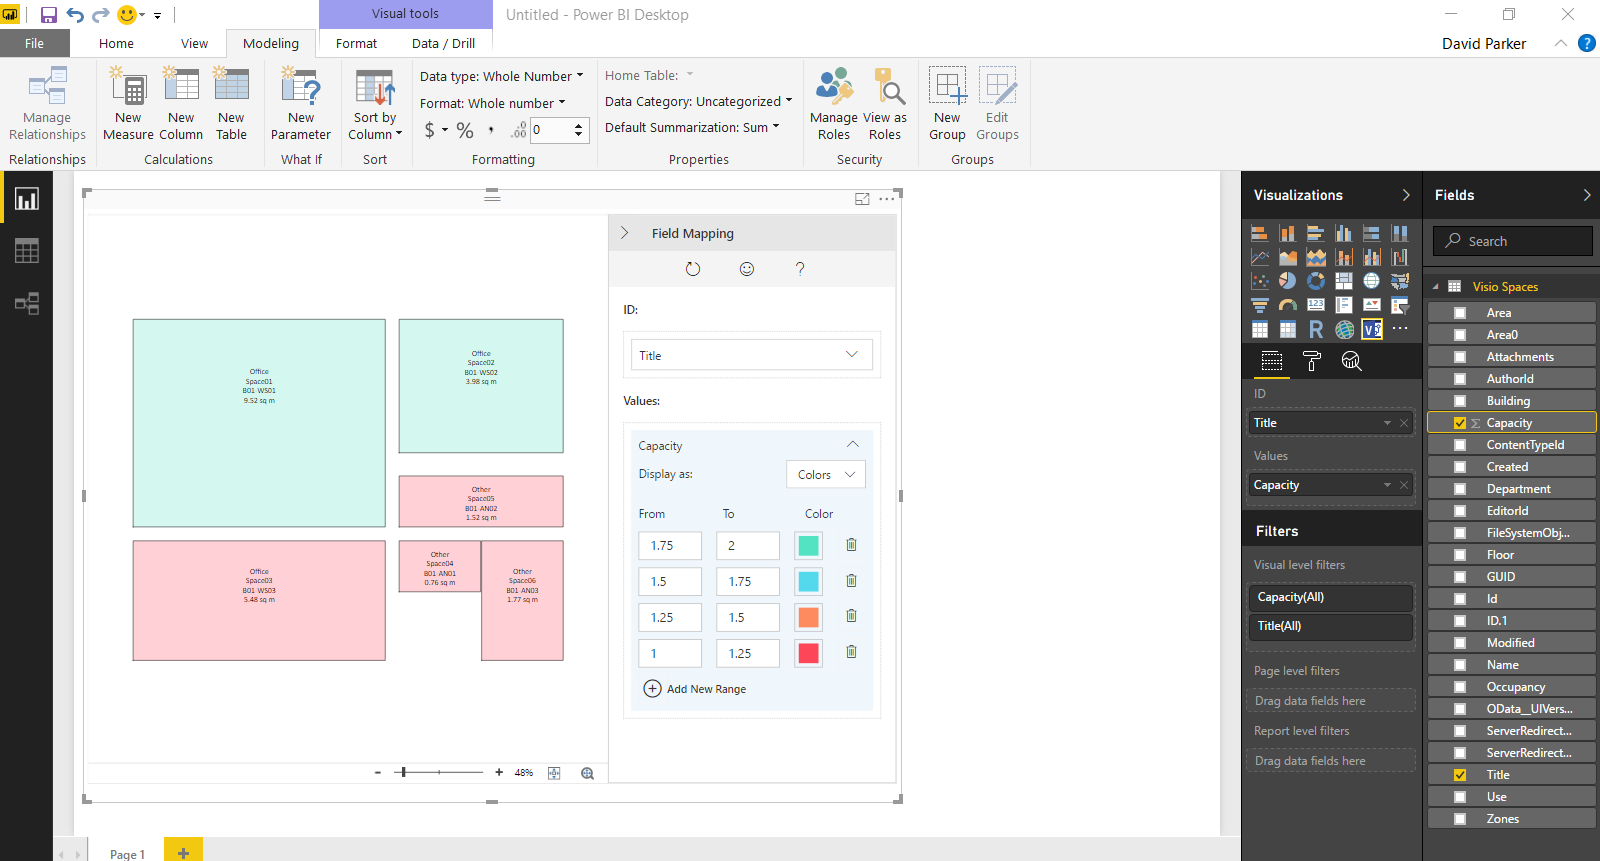
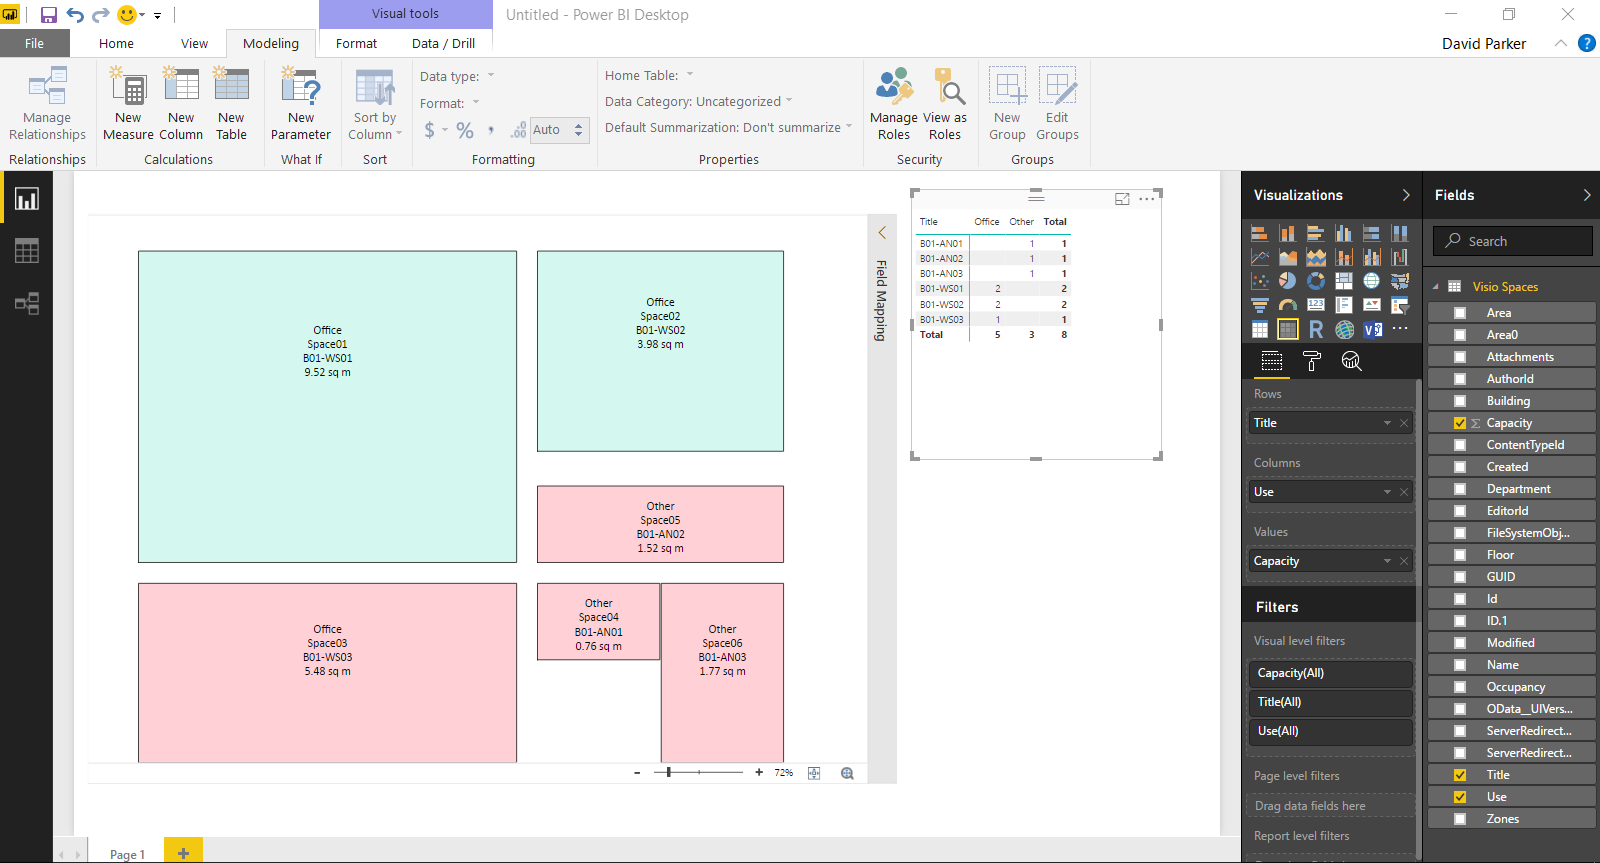
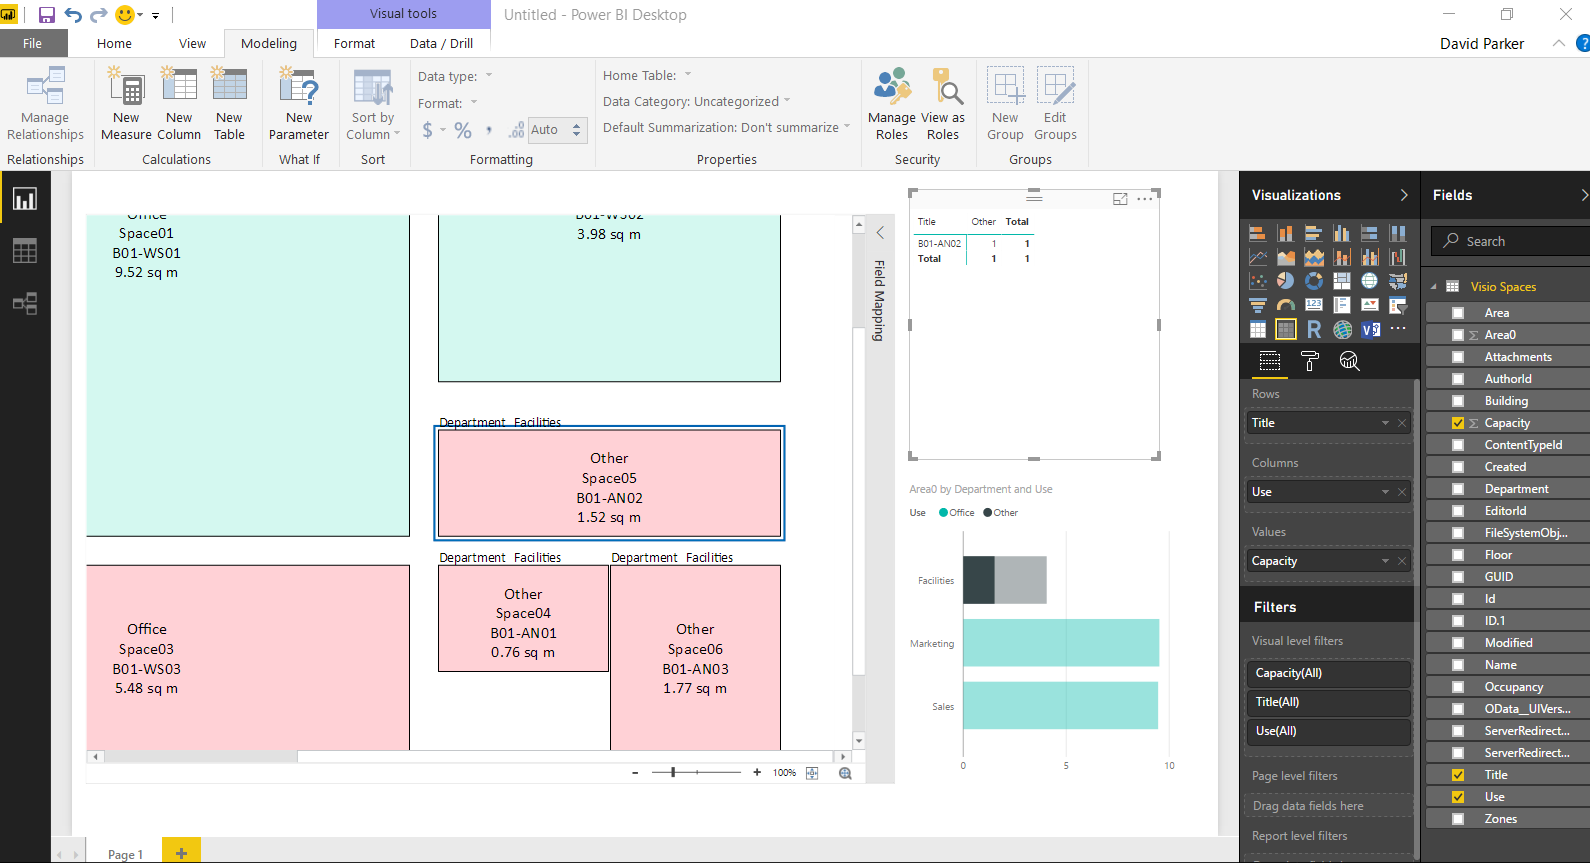
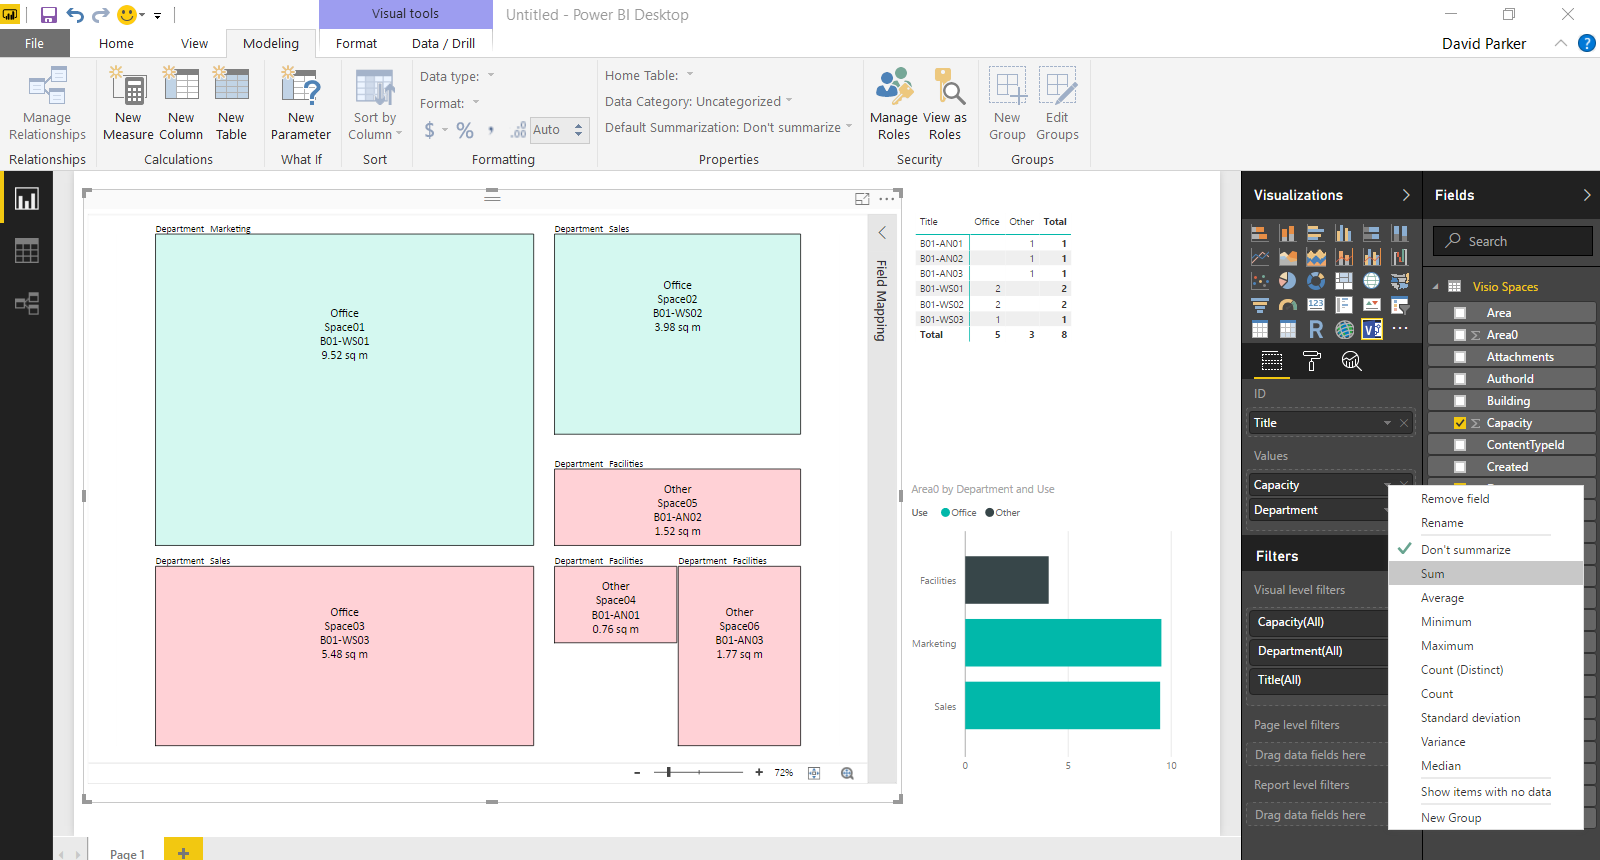
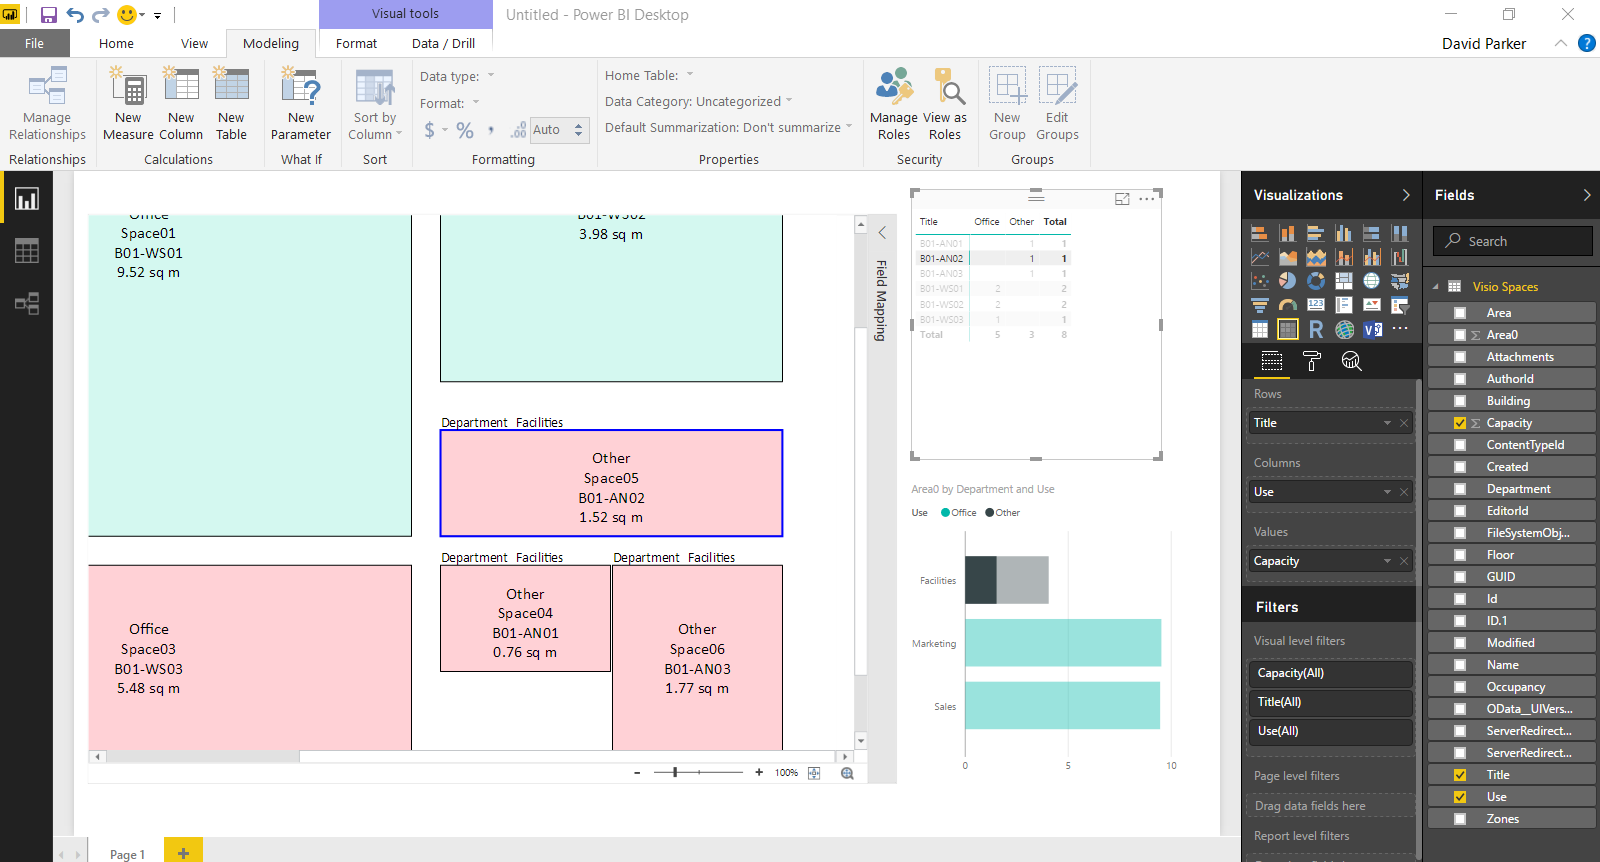
Most of my posts have been about using Visio as a data consumer by linking Visio shapes to data, but Visio can be the best place to create some data from. For example, an office layout can have personnel or equipment shapes within a workstation area, or space shapes are used to define areas which are used for calculating the space usage chargeback reports. There are non-facilities management related examples too, as the only consideration is what is the best way to create relationships, measure lengths, or calculate areas. These are all tasks that are best done by just moving, resizing, connecting or containing shapes interactively in the Visio interface. In this article I will explain how Microsoft Flow can be used update a data source simply from a Visio document.
[Read more…] about Updating data sources from Visio using MSFlow … easily!bVisual Blog by David Parker
Anchoring scaled shapes to page corners in Visio
I have read that other users have bemoaned the lack of a anchor to top left, or something similar in Visio, so I thought I would demonstrate the issue, then propose a solution. In particular, there are some master shapes on the Annotations and Title Blocks stencils in the Visio Extras category that you would expect to have this capability, but don’t. Wouldn’t it be useful to have the ability to keep the shape size and anchor position to page bottom left, bottom right, top right or top left? This would mean that the page size or scale could be changed, but the annotations and title blocks could remain anchored.
First, it is important to know that Visio shapes are anchored, by default, to the bottom left of a page (or the shape that they are inside the group of). These values are returned from the formulas in the PinX and PinY cells.
Secondly, the location of the pin within the shape is defined by the formulas in the LocPinX and LocPinY cells, and these are relative to the bottom left corner of the shape.
Then it is just a matter of adding some Actions rows to the ShapeSheet of each master in the Document Stencil. The principle is to utilise the User.AntiScale value to reset the formulas in the Width, Height, PinX or PinY cells. The User.AntiScale row exists in many Master shapes because it is useful for de-scaling values. It has the formula:
Previewing the Visio Custom Visual in PowerBI
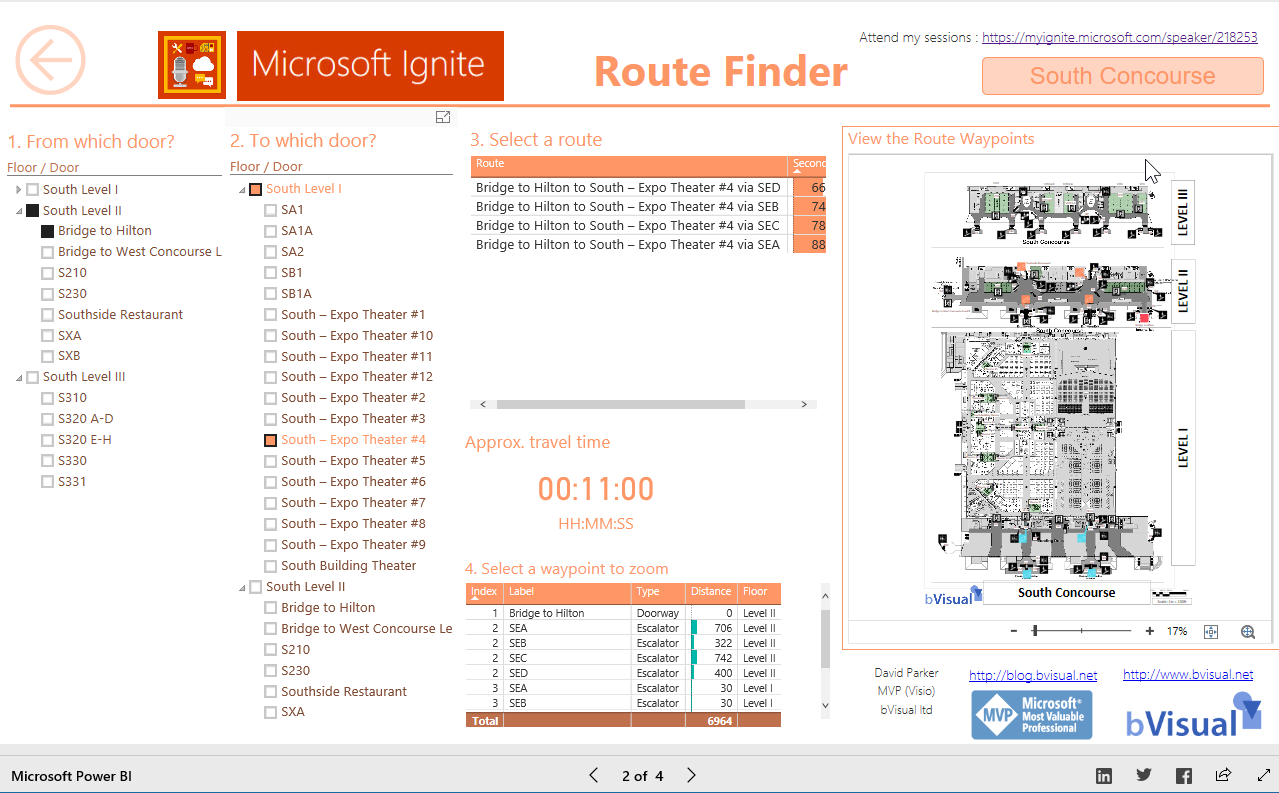
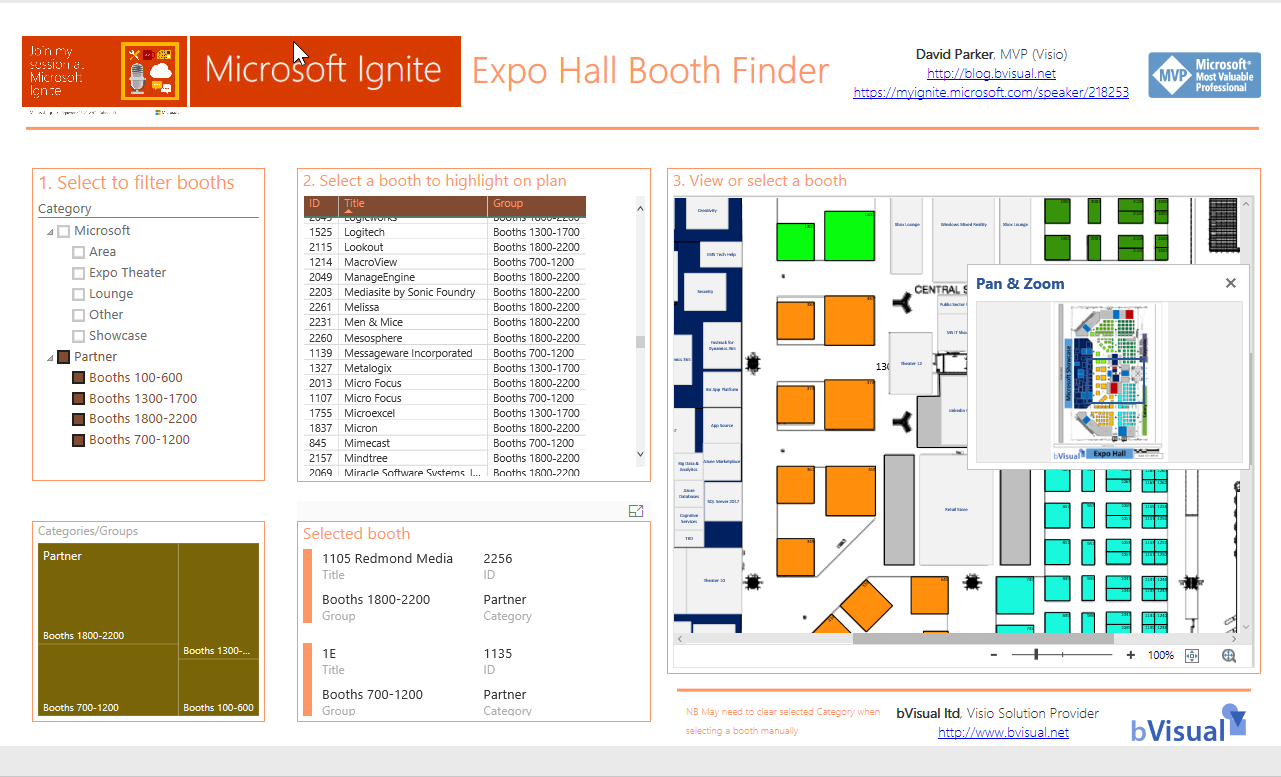
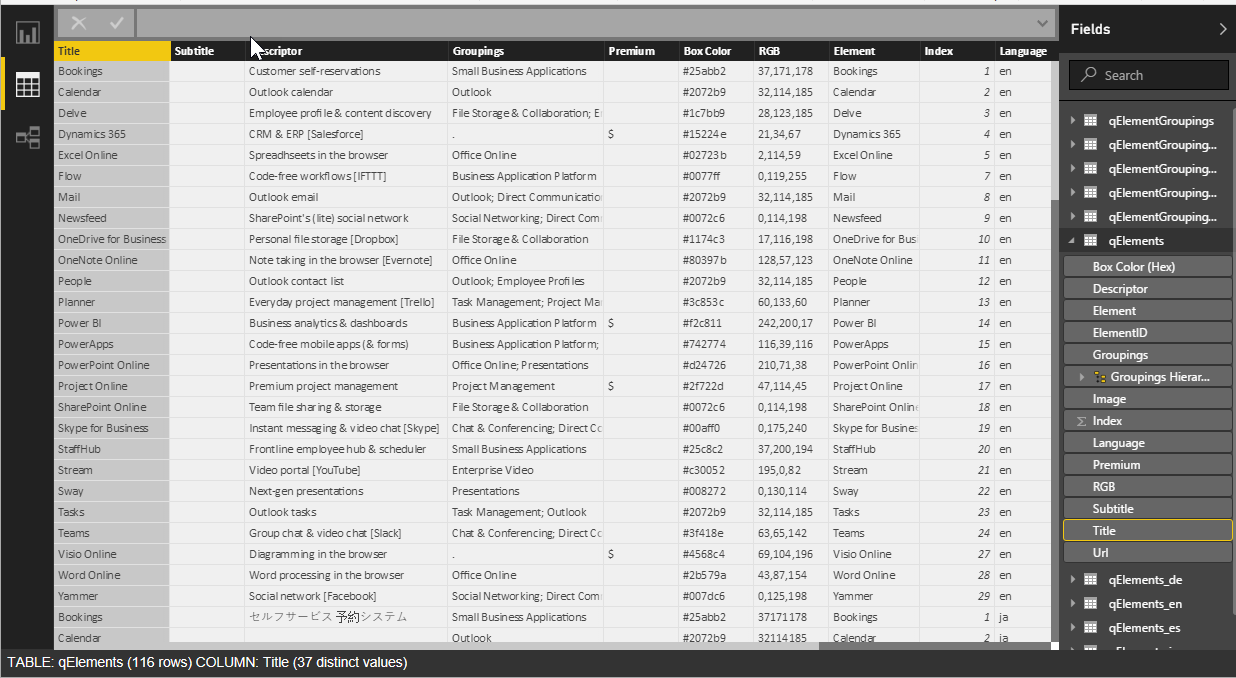
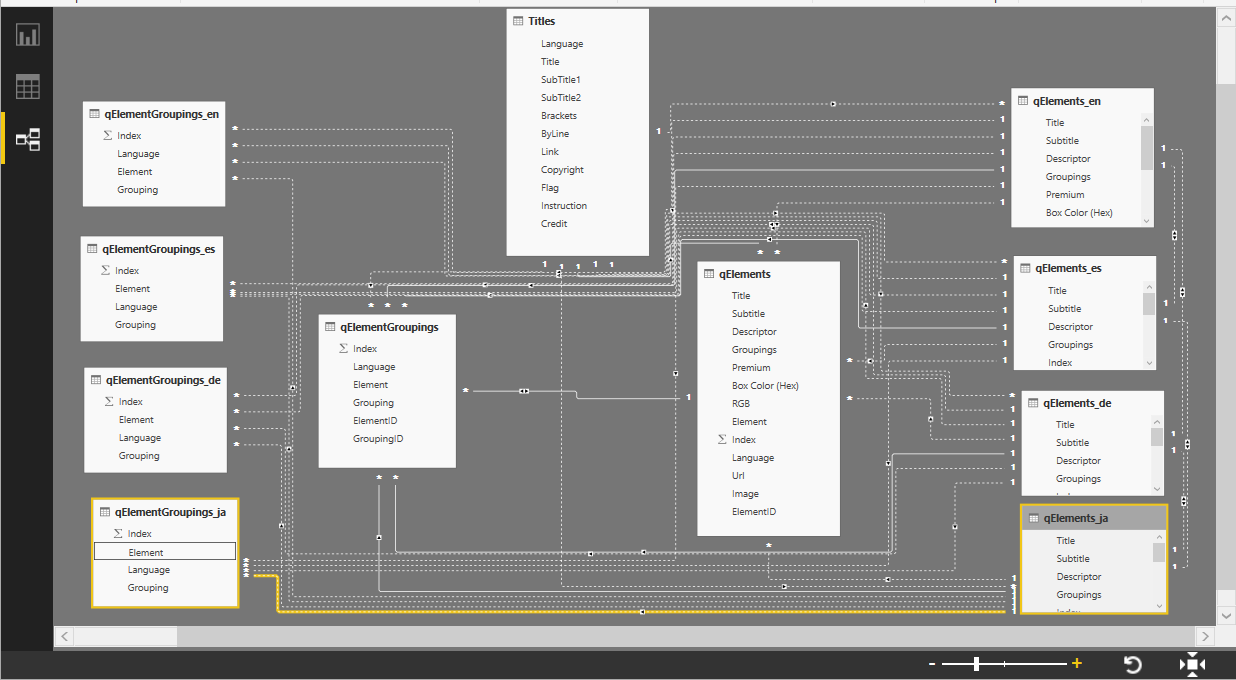
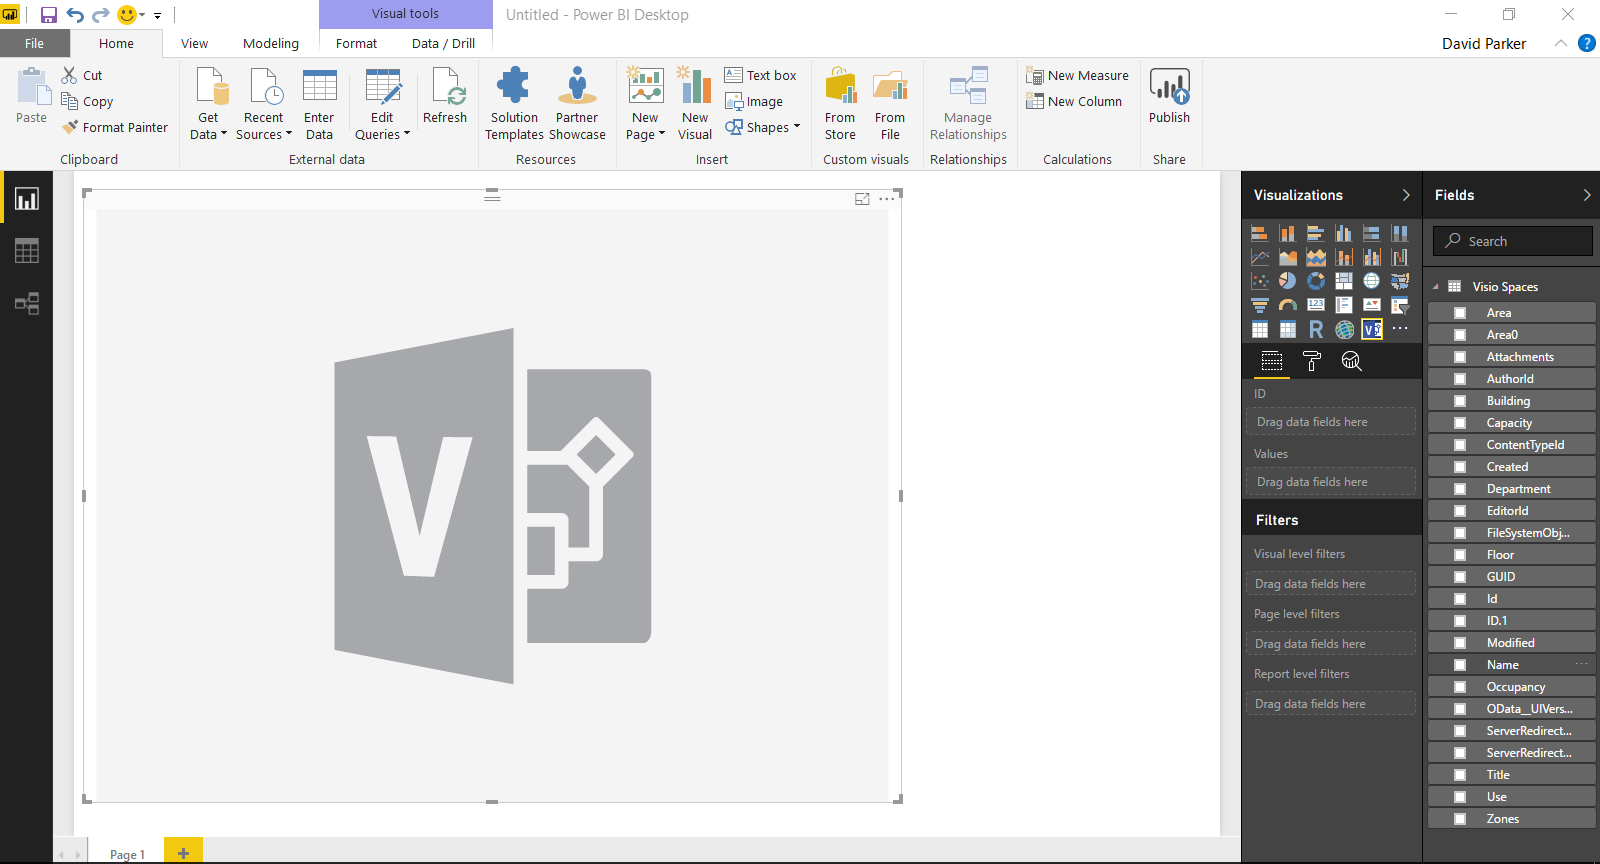
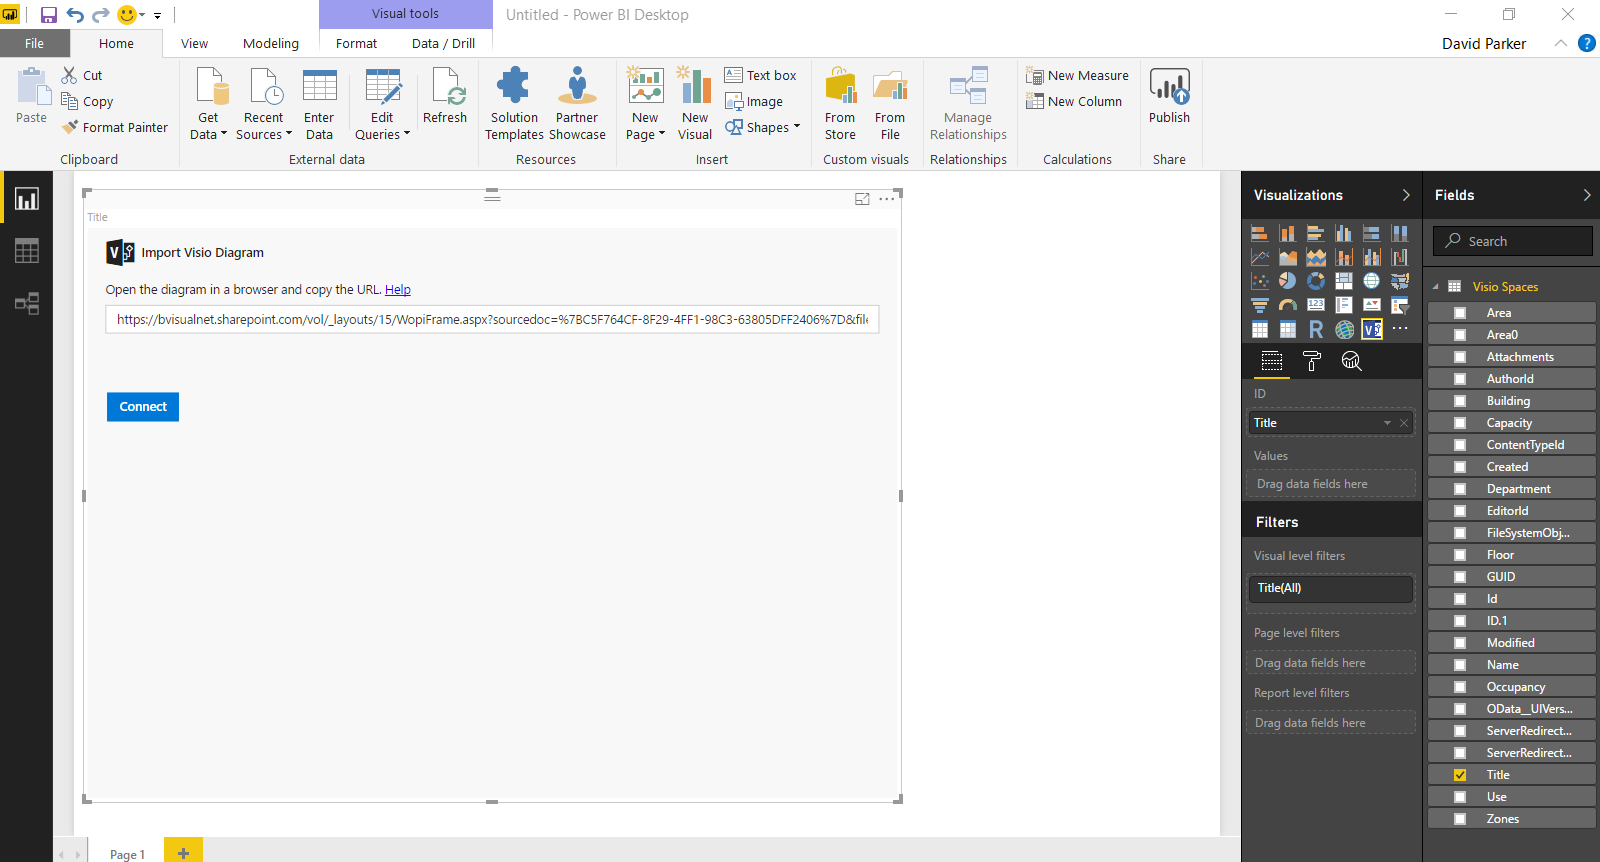
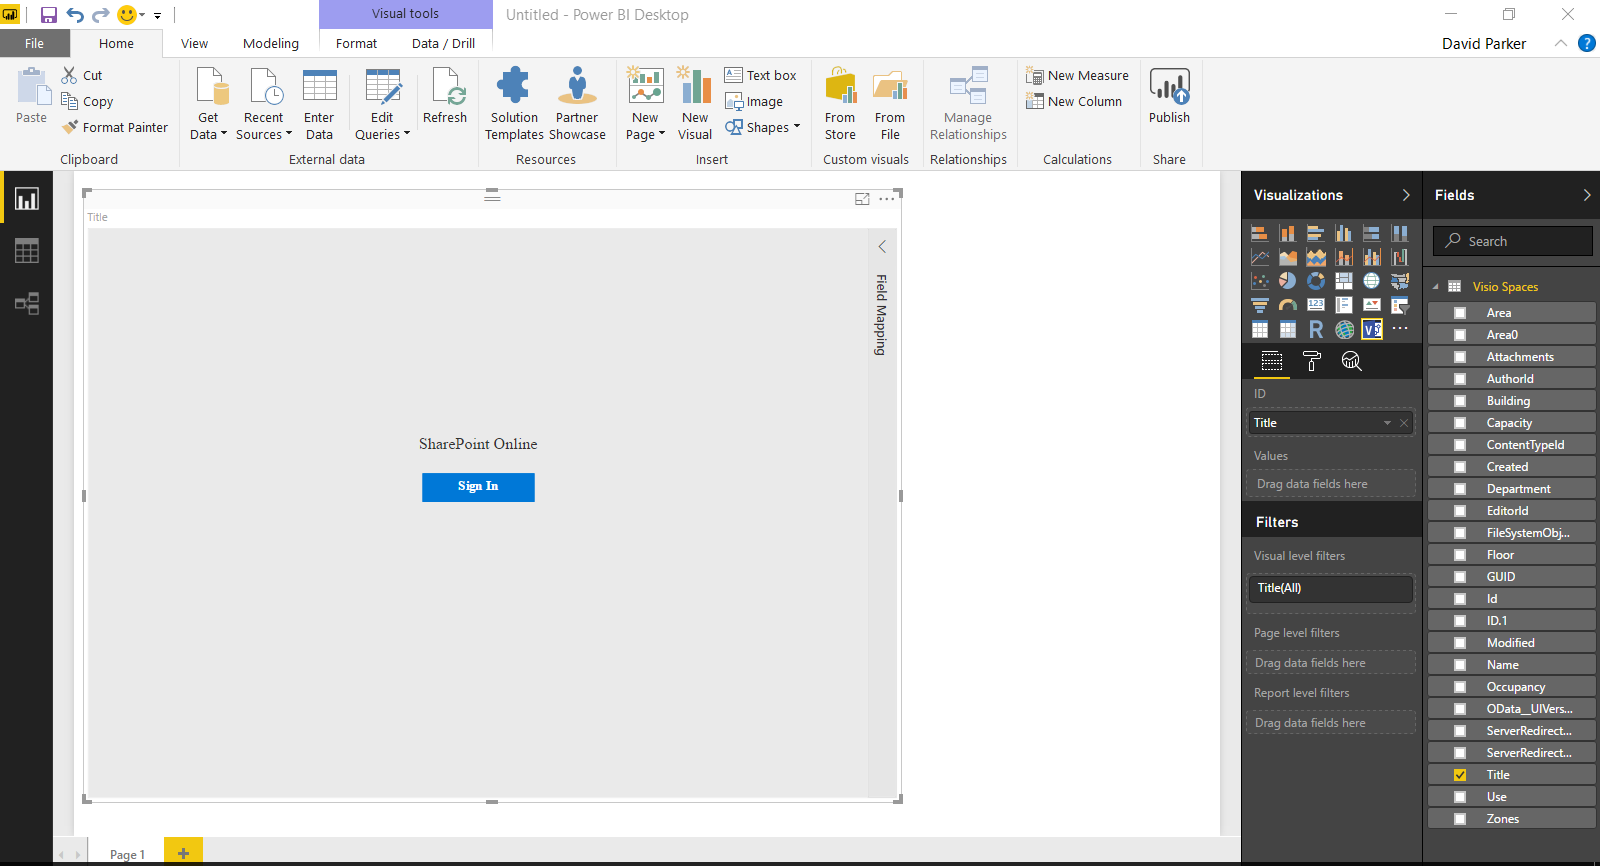
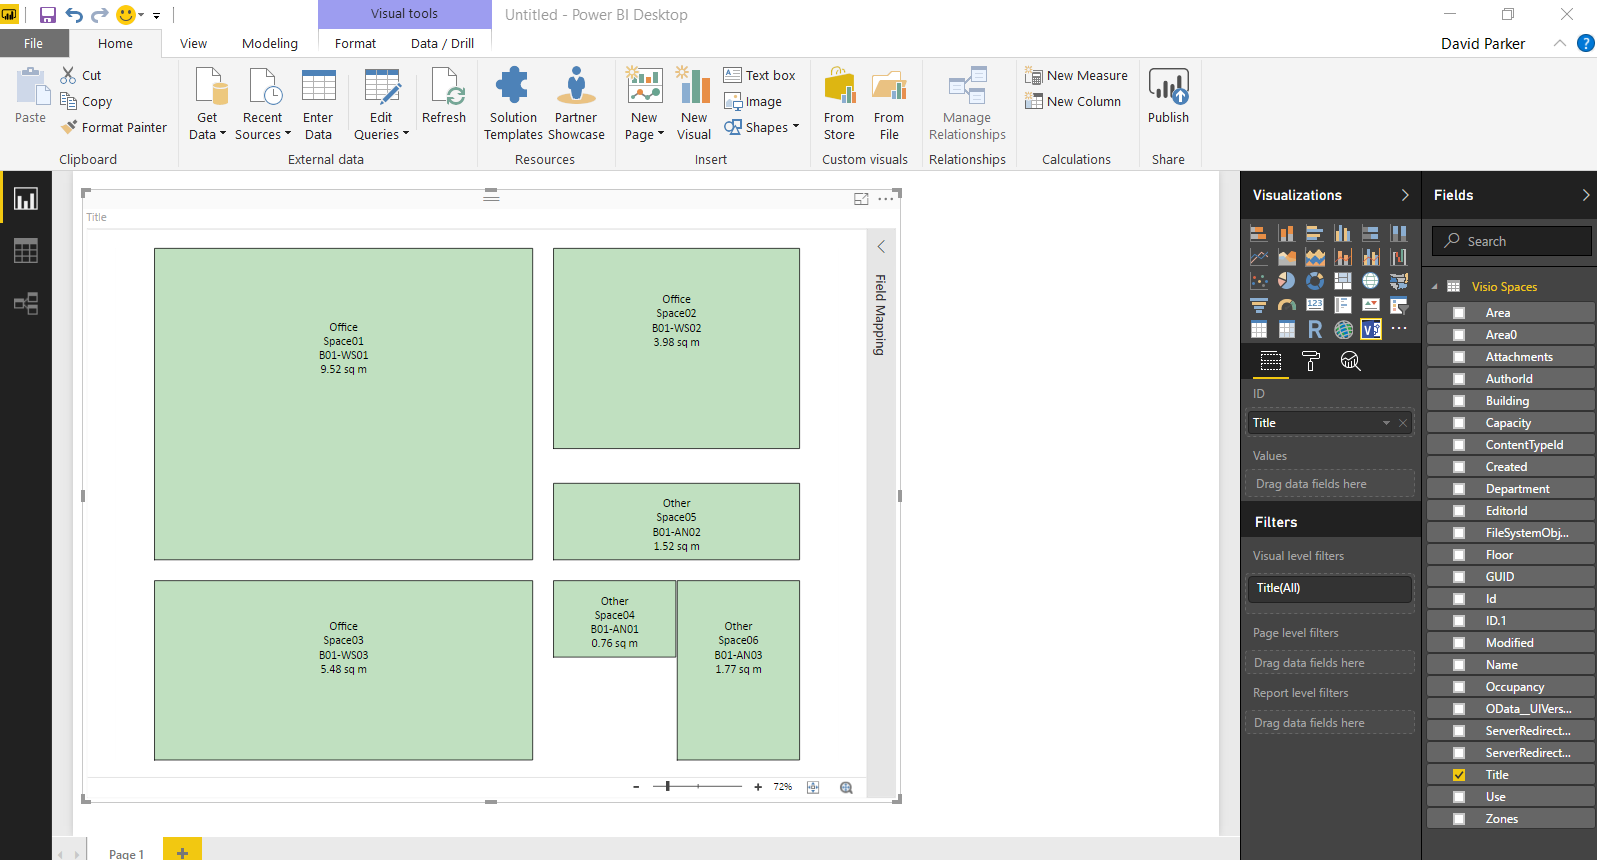
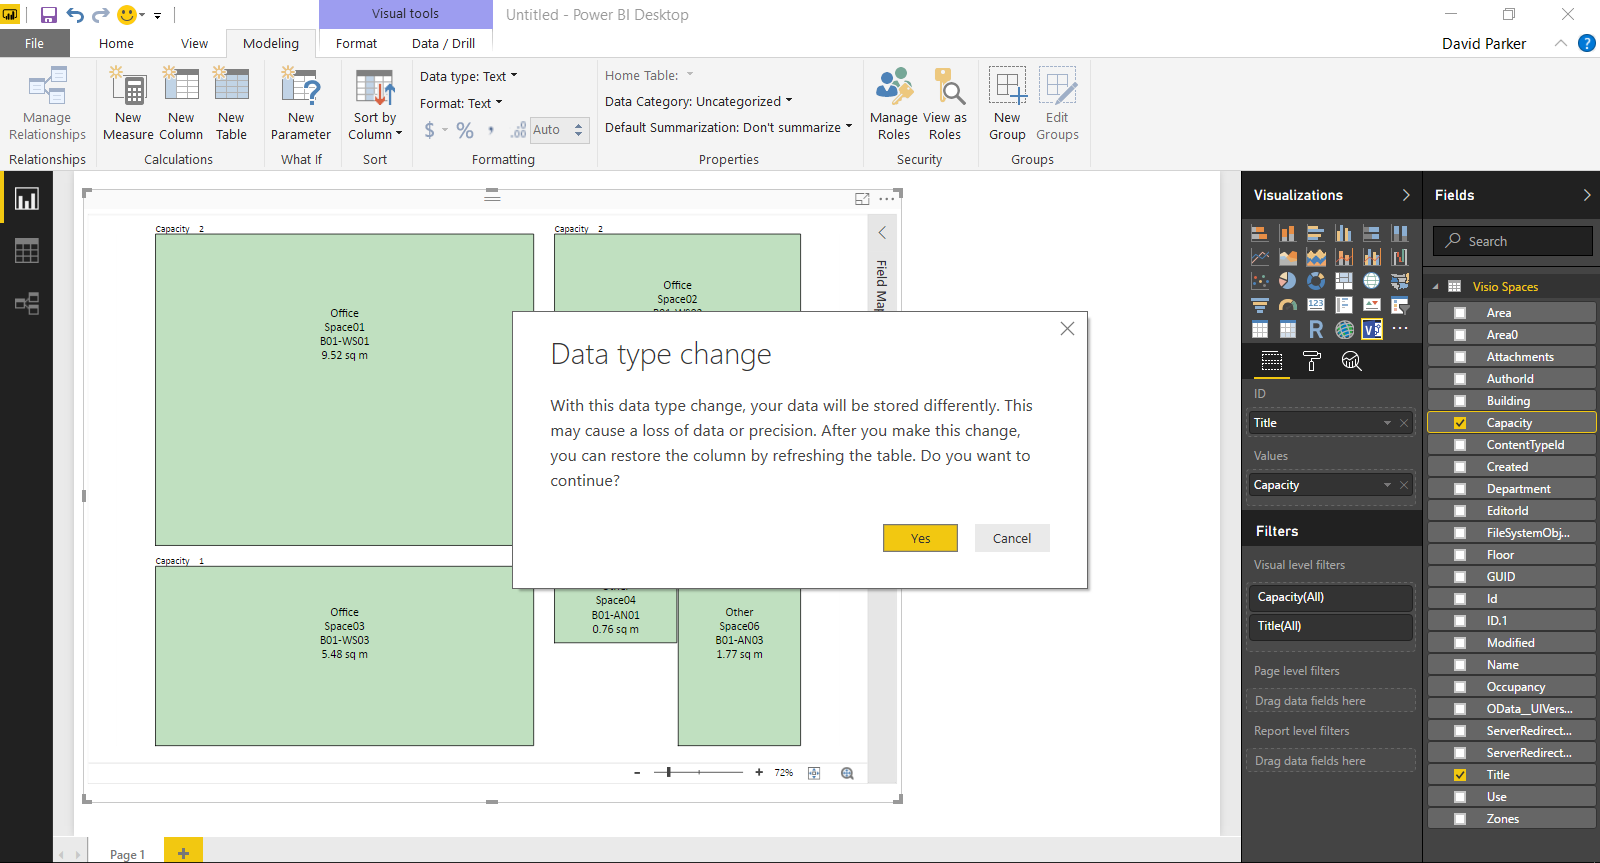
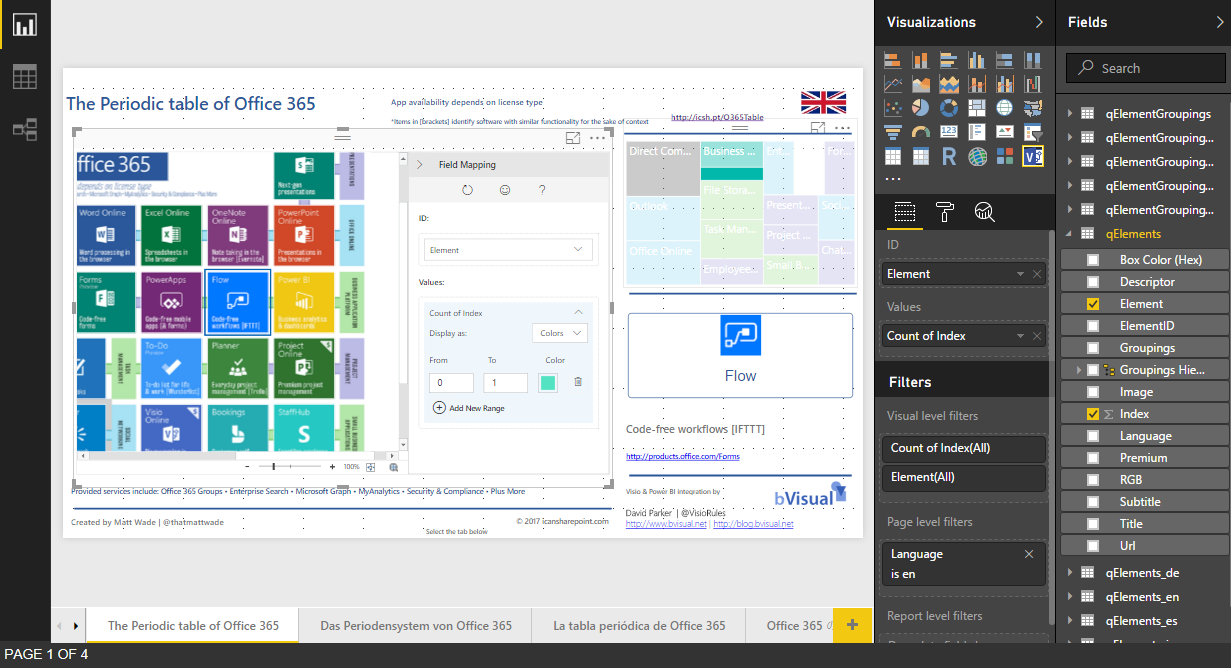
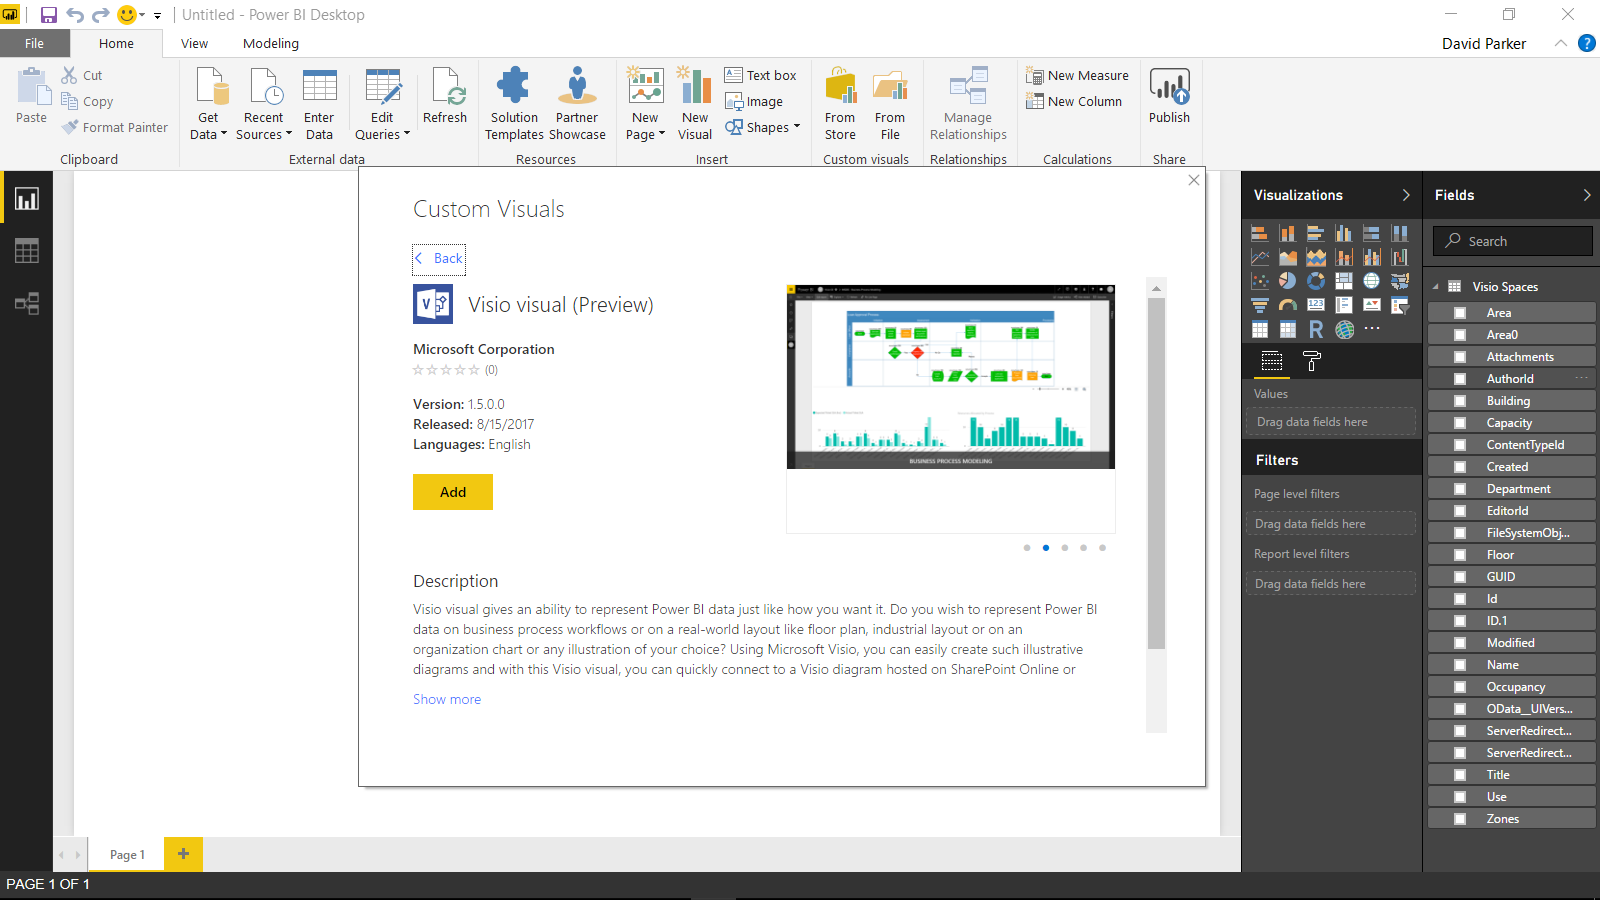
It is time to talk about the new Visio custom visual for PowerBI. You may have read about it at Visio Power BI example and Add Visio visualizations to Power BI reports, but I wanted to add my findings. First, it is great to see this feature, but it is not yet the finished article. However, I hope I can show that it can be an extremely useful addition to the business intelligence toolset from Microsoft. I think that the existing Link Data to Shapes and Data Graphics features in Visio desktop are considered to be Operational Intelligence capabilities, whereas this new custom visual for PowerBI is definitely Business Intelligence. This is a different discipline, and I have been developing some guidelines for good practice when using Visio with PowerBI. In this article, I will demonstrate how I created a PowerBI dashboard using graphics and data from last years Microsoft Ignite conference.
Let me set the expectations because I am working with a preview of the Visio custom visual.
[Read more…] about Previewing the Visio Custom Visual in PowerBIEmbedding multiple language texts in one document in Visio
A few years ago, I was asked to write an add-in for Visio that could switch the text in each flowchart shape between different languages. The client required 5 different alternate languages to be supported, and they had the same 99 page Visio document copied 5 times, and each time there was an edit to be done, then it had to be repeated in each document. So, I wrote an add-in that allows for multiple language texts and page names to be stored in a single document, and added the optional use of Bing Translator. Well, the Bing Translator is now Microsoft Cognitive Services Text Translator, and my add-in installer needed to be updated for later versions of Visio. I am pleased to say that it now works for all versions of Visio since 2010, and for all languages that Visio supports, and it can be downloaded and tried for 30 days from MultiLanguageText.aspx .
Problems viewing and printing embedded Dwg files in Visio
I recently had to buy a Dwg file of a residential area for a planning application. I naturally wanted to use this Dwg file to scale in Visio, and everything looked great. The property lines were slightly jagged because of the scaling, but were quite acceptable. However, when it came to printing or saving as Pdf, I discovered a big problem … the Dwg image was either completely absent or extremely jagged!
I tested 5 different products for creating pdfs from Visio, and none of them were usable. I tried saving as Oxps, and using Visio Online, or just printing … not good either. Only Visio itself and Visio Viewer rendered satisfactorily!
This is the file used in the test : https://1drv.ms/u/s!AqkzN8kb1lAzpNJ6DhX1ETd_9SkcIw
The products tested were:
The different Drawing scale shapes in Visio
I have been working with drawing scales in Visio for over twenty years, and have been aware that the stencils presented to you can be different for Metric and US Units drawings. However, I have only recently realised that there is a marked difference in capabilities between the Drawing scale shape that is presented in the Metric Annotations stencil from that in the US Units version! This can be important for those of us that work in both scale systems. The US Units version of the Drawing scale shape allows the user to choose between four different scale systems, but the Metric version only displays the one scale system.
So, how can users who start with a metric drawing use the better one that is available in the US Units stencil?
Firstly, delete all instances of the Drawing scale shape in the document. Then open the Document Stencil and delete the Drawing scale master shape.
Next, change the Measurement units of the first page to a US Units, such as Feet and Inches, then open the Visio Extras / Annotations stencil. This may look like a duplicate, but it is the US Units version. Drag and drop the Drawing scale master shape from this stencil onto the page, then close the Annotations stencil that has just been opened.
Then select the Drawing scale master in the Document Stencil and choose Edit Master / Master Properties… from the right mouse menu. Tick the Match master by name on drop option and then select OK. Now, when ever the Drawing scale shape is dragged and dropped from either the Metric or US Units stencil, even if the page has metric Measurement units or not, it will create an instance of the US Units one!