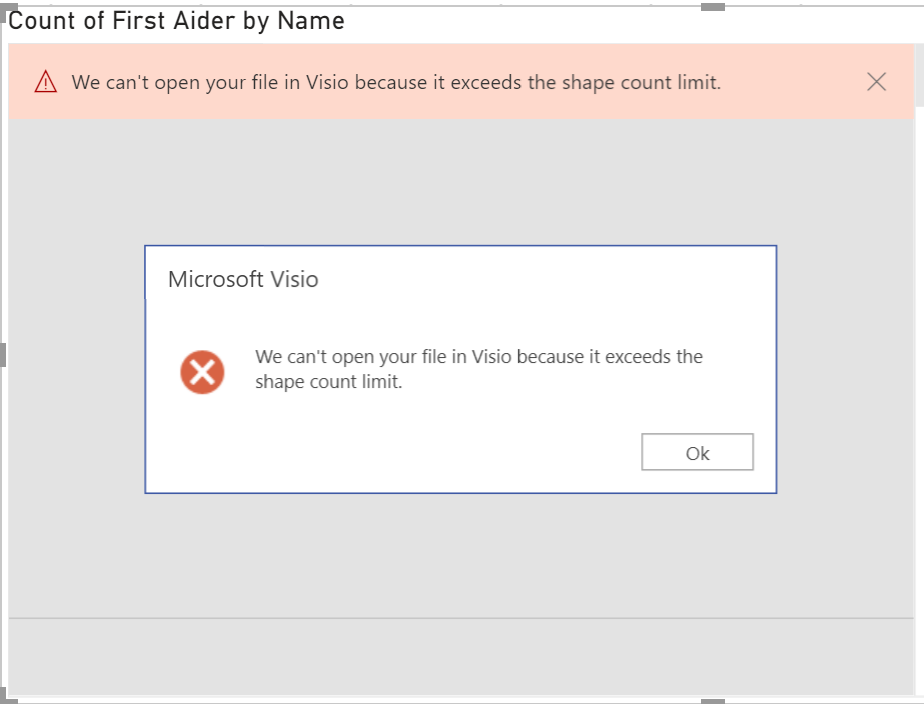
If you are one of the increasing number of Power BI users that have discovered that the Visio Visual gives you the great ability to include Visio diagrams in your dashboard, then you may have come across the following error, ‘We can’t open your file in Visio because it exceeds the shape count limit’ in Power BI’, when you try to embed a Visio document. This can be frustrating, but here is a deeper explanation of what is happening … and how you can usually overcome it.
The Visio Visual in Power BI currently has a 1k shape limit, and it will reject any page that exceeds this limit. So what can you do to overcome this issue? Well, Microsoft has provided the ability to use layers with a # prefix in their name to tell the Visio Visual to only count shapes assigned to those layers. Useful, but using this feature is not always as straight forward as it seems.
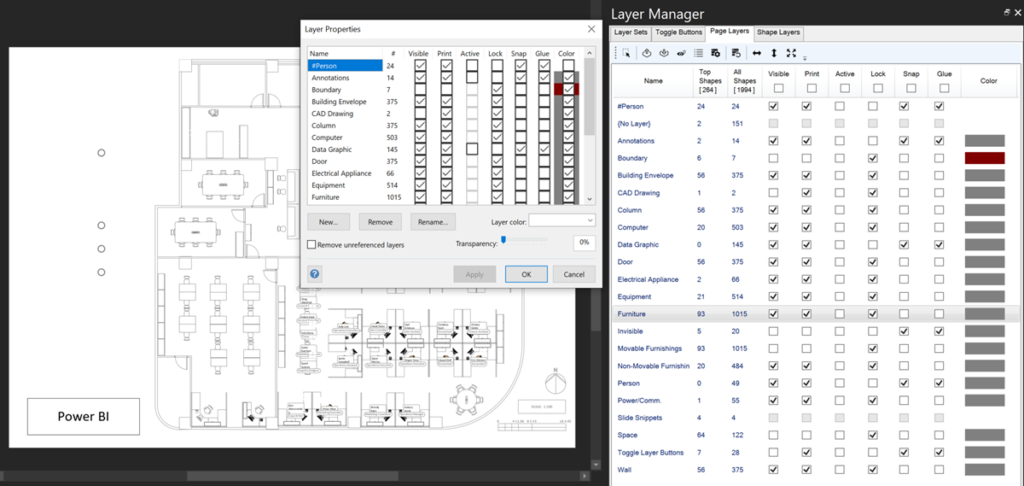
Firstly, you may open up the Layer Properties dialog in Visio, and it shows you a count of each shape on each layer, but you might think that this count is crazy because you only have a handful of shapes. In this example, I know that I will be linking the Person shapes to data in Power BI, and I only have 24 of them (in a past life I used to data-linking 600 person shapes per floor). This count includes all of the sub-shapes within each shape, and don’t forget that Visio shapes can belong to none, one or more layers! Therefore, some shapes can be counted more than once, and some are not shown in this dialog at all because they don’t have a layer assignment!
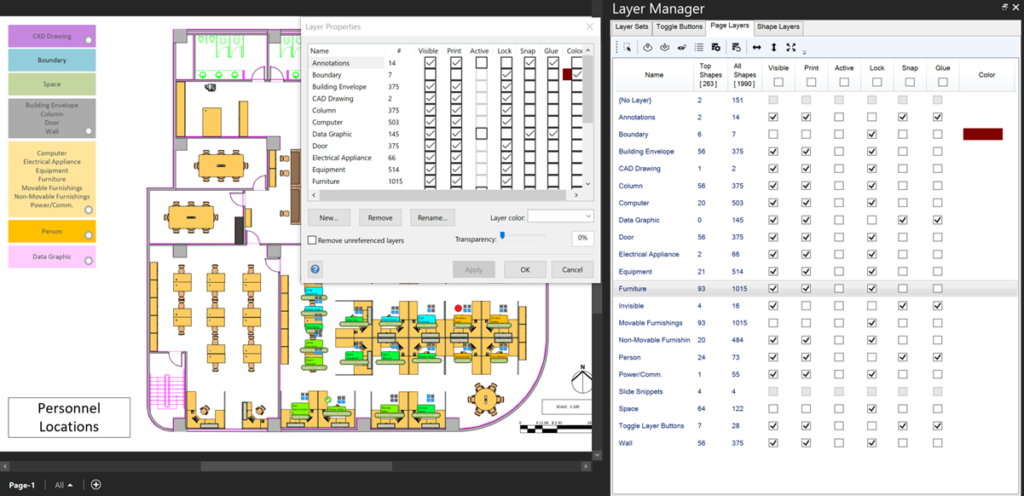
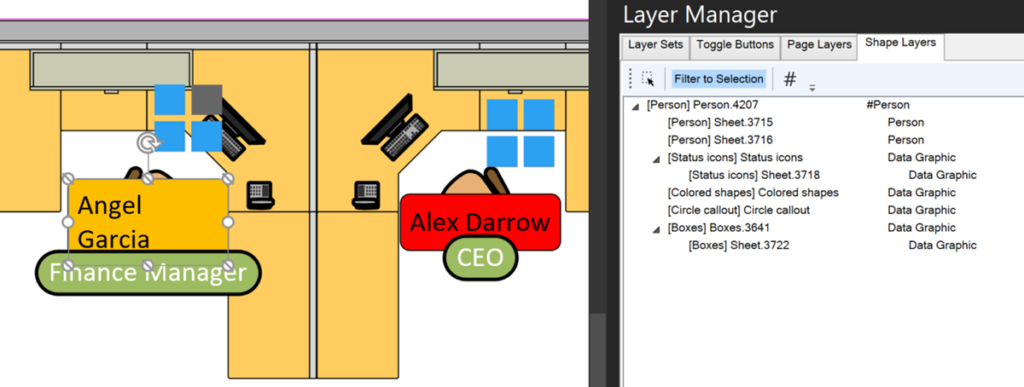
I have enhanced my LayerManager add-in (new release available now) to list the count of shapes on each layer, and the count of the shapes on the top of the group shapes. It also gives you the count of the shapes and sub-shapes without any layer assignment!
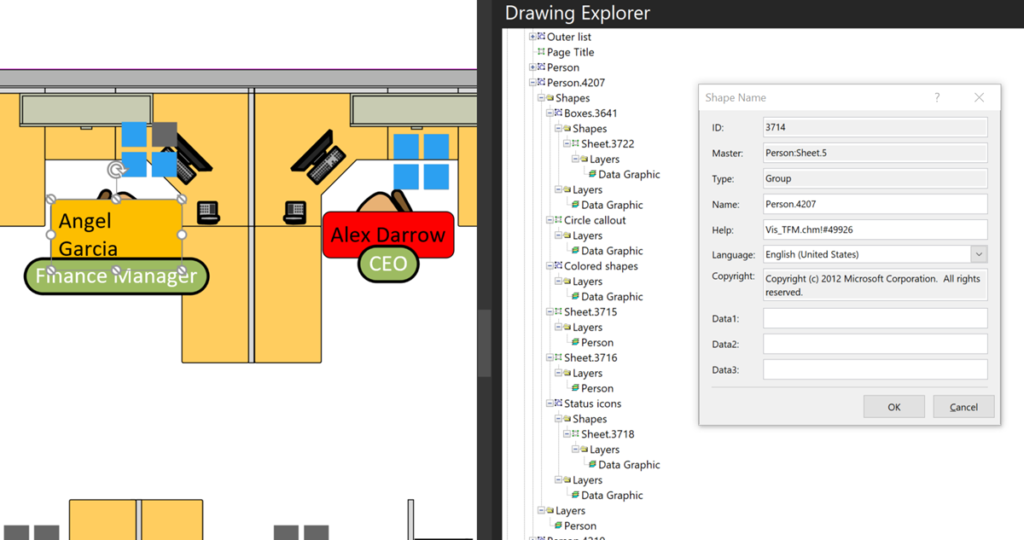
So, if I look for deeply into one of the Person shapes using the Drawing Explorer, I can see that it has many sub-shapes, but some of them are on the Data Graphic layer. In fact, the Visio Visual in Power BI will supress the Data Graphic shapes automatically.
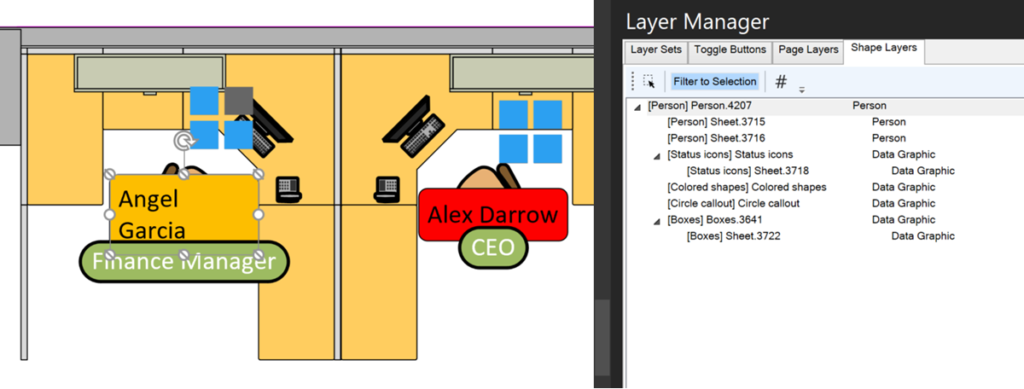
I find the Drawing Explorer view of the shape a little complex to see what is actually there, so the soon-to-be-released enhanced LayerManager add-in provides an alternative view by providing a tree view of each shape and sub-shape, displayong its master name in square brackets, and a list of the layers that each shape belongs to.
So, if I was to rename the Person layer as #Person then the Visio Visual will only include the shapes on each layer whose name begins with a # character. Thus my 24 Person shapes, which each consist of 3 shapes on the Person layer, would make a total of 72 shapes in the whole page. This is far less than the 1k shape limit for the Visio Visual, and so I will be able to use the Visio page, even though it has nearly 2k shapes on it.
However, if I had 600 Person shapes, then there would be 1,800 shapes, which is still larger than the 1k limit, and it would again fail.
Therefore, the better solution is to create a #Person layer, and only move the top shape in the Person master to this layer, leaving the 2 non-Data Graphic sub-shapes on the Person layer. Therefore, there will only be 600 Person shapes counted by the Visio Visual!
The only problem is that this last edit is impossible to do in the Visio user-interface, and needs to be done with some custom code. Hence another reason why I had to enhance my forth-coming LayerManager add-in!
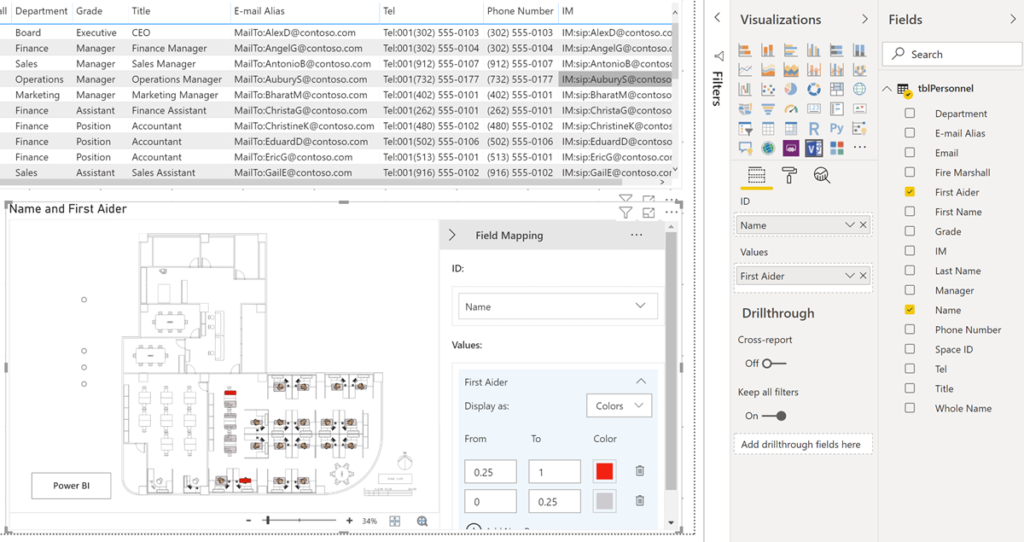
Another useful technique before embedding Visio pages into Power BI, is to greyscale the whole page by adding a suitable colour to each layer, thus over-riding existing colours and providing a much clearer background for any text and colors added in Power BI.
So, now, the Color by Value feature of the Visio Visual in Power BI can be used to clearly indicate shapes with colour.
Whilst I was working on this code, I came across a solution given in the Power BI community – Visio Visual – Too Many Shapes . This looks like too much effort for most users to me…. Just ensuring that the top shape in the group is on a # named layer is much more preferable.

Teams Tuesday Podcast Recording about Visio
I am delighted to share the link to my recent demonstration and conversation with fellow MVP Peter Ward about Visio in Teams. We discussed more than just Visio … and I look a bit like Max Headroom! (more…)

Visio Presentations for the Microsoft Ignite The Tour 2020
Just when we thought the pandemic was coming to an end, another variant appears to scupper our plans. So, resuming in-person events is delayed, and the world isn’t safe until the world is immunised. Therefore, I decided to make the presentations that I was going to be presenting on the abandoned Microsoft Ignite The Tour…
Visio is NOT Vizio!
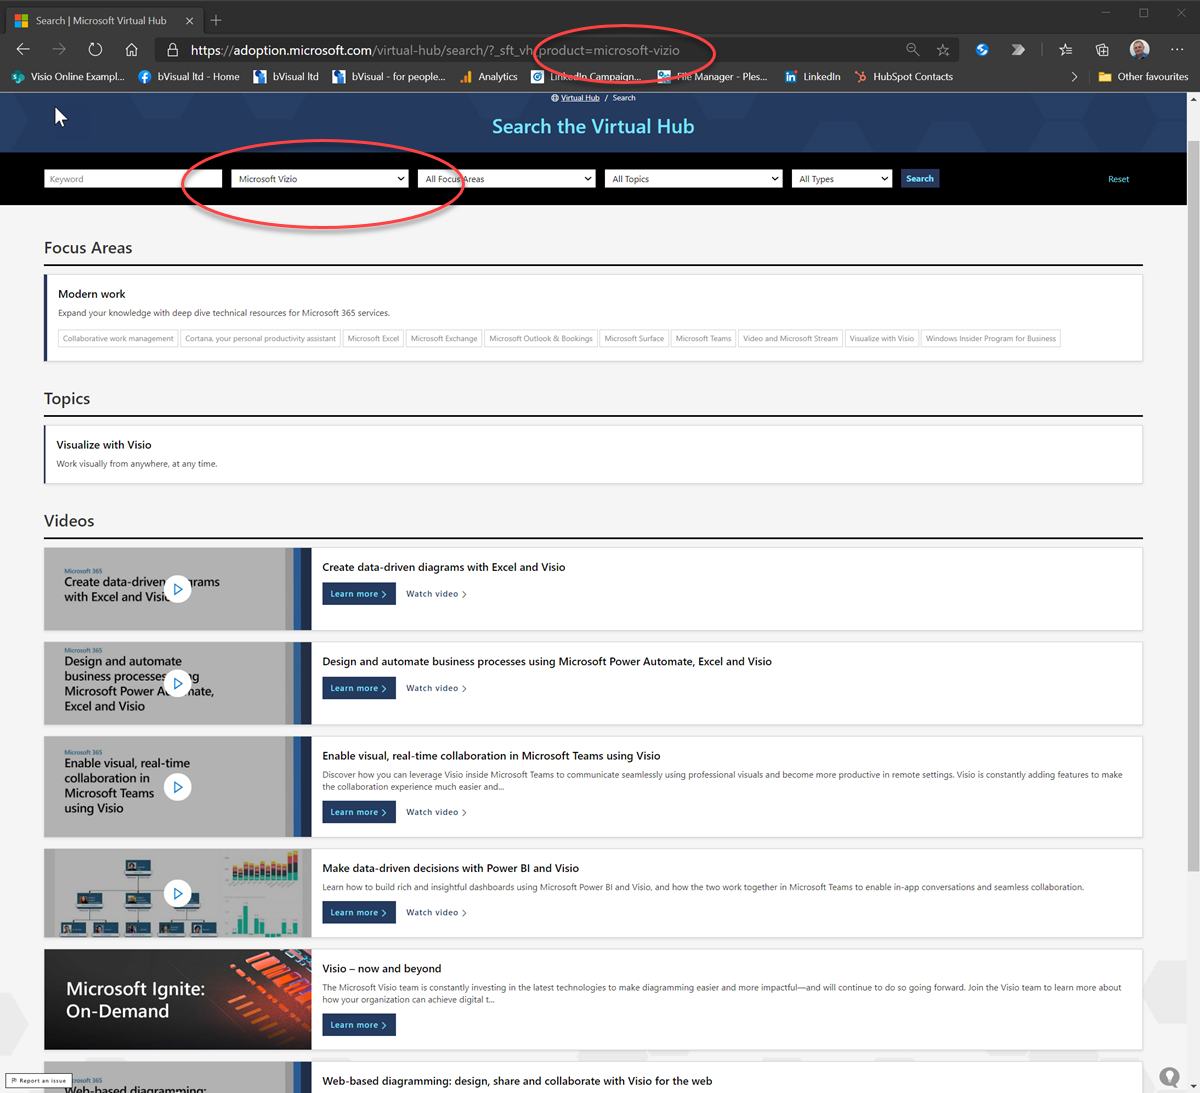
Update 1 : Microsoft read this post and immediately corrected the spelling so the following now works : https://adoption.microsoft.com/virtual-hub/search/?_sft_vh_product=microsoft-visio 🙂 Update 2 : Mr VisGuy! “spelt” is the same as “spelled” outside USA! Aarghh! What kind of message is sent out if a company does not know how to spell the name of their own…

My sessions at MS Ignite the Tour 2020 London
I was pleased to present two sessions at London ExCel last week about Visio. Attendance was good, maybe too good because some could not get close enough to hear. There was a lot of background noise, and my presentations were too long for the 15 minutes slot, but content was eagerly received. I told everyone…
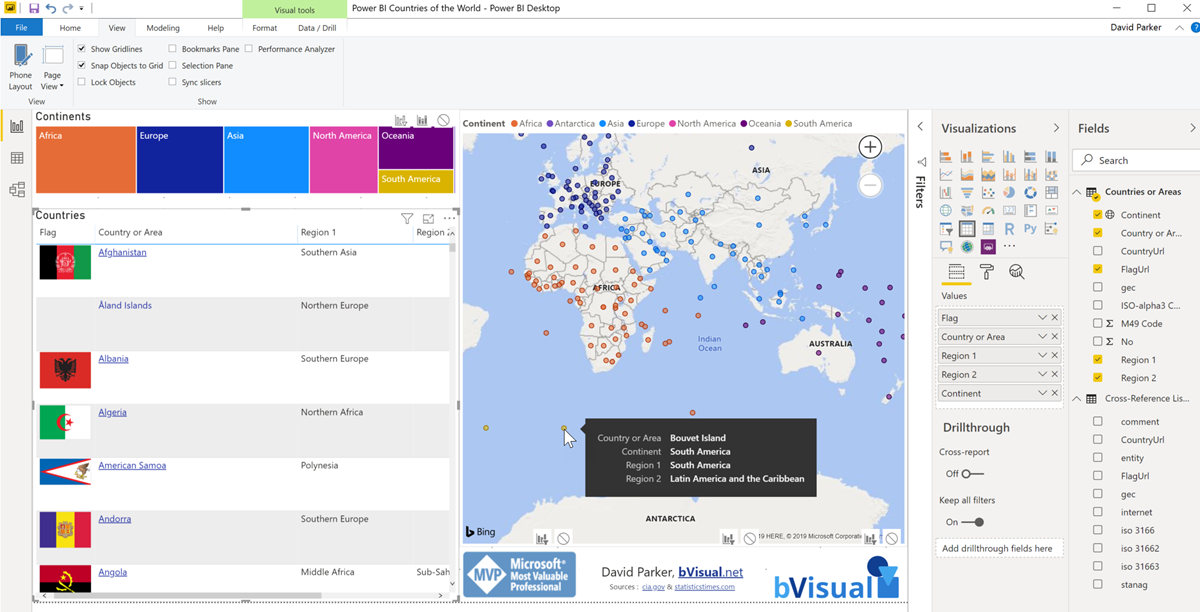
Countries of the World in Power BI with Flags
I like Power BI, and the latest update features the ability to set a custom web url onto another column. So, I couldn’t resist trying it in the example below. Notice that the Country or Area values are hyperlinks to the url of the country page in the CIA World Factbook. [UPDATE Oct 2021: The…

Visio news from MS Ignite 2019
Microsoft Ignite 2019 at the huge Orange County Conference Conference Center in Orlando is over for another year. 30,000 attendees over 6 days, and I have seen my first sunlight today since I arrived in Florida last Saturday! So, it is time to review just what was announced about Visio, and how much Visio is…
Leave a Reply
You must be logged in to post a comment.