• Skip to main content
  • Skip to primary sidebar
  • Skip to footer

bVisual

  • Home
  • Services
    • How Visio smartness can help your business
    • Visio visual in Power BI
    • Visio Consulting Services
    • Visio Bureau Services
    • Visio Training and Support Services
  • Products
    • Visio Shape Report Converter
    • SS Plus
    • LayerManager
    • visViewer
    • Metro Icons
    • Rules Tools for Visio
    • The Visio 2010 Sessions App
    • Multi-Language Text for Visio
    • Document Imager for Visio
    • multiSelect for Visio
    • pdSelect for Visio
  • Case Studies
    • Case studies overview
    • Using Visio in Education for GIS
    • Visualizing Construction Project Schedules
    • Visio Online Business Process Mapping
    • Nexans Visio Template
    • CNEE Projects, WorldCom
    • Chase Manhattan Bank
  • News
    • Recent news
    • News archive
  • Resources
    • Articles➡
      • ShapeSheet Functions A-Z
      • Comparing Visio for the Web and Desktop
      • Customising Visio Shapes for the Web App
      • Key differences between the Visio desktop and web apps
      • Using the Visio Data Visualizer in Excel
      • Using Visio in Teams
      • Creating Visio Tabs and Apps for Teams with SharePoint Framework (SPFx)
      • Designing Power Automate Flows with Microsoft Visio
      • Innovative uses of Visio Lists
    • Webcasts ➡
      • Visio in Organizations
      • My session and other Visio sessions at MSIgnite 2019
      • Power up your Visio diagrams
      • Vision up your Visio diagrams
      • The Visio 2010 MVP Sessions
    • Visio Web Learning Resources
    • Books➡
      • Visualize Complex Processes with Microsoft Visio
      • Mastering Data Visualization with Microsoft Visio
      • Microsoft Visio Business Process Diagramming and Validation
      • Visualizing Information with Microsoft Visio
  • Blog
    • Browse blog articles
    • Visio Power BI articles
    • Visio for Web articles
    • A history of messaging and encryption
  • About us
    • About bVisual
    • Testimonials
    • Bio of David Parker
    • Contact Us
    • Website Privacy Policy
    • Website terms and conditions
    • Ariba Network
You are here: Home / Visio / Data Centre Racks in Visio in PowerBI

Published on June 5, 2018 by David Parker

Data Centre Racks in Visio in PowerBI

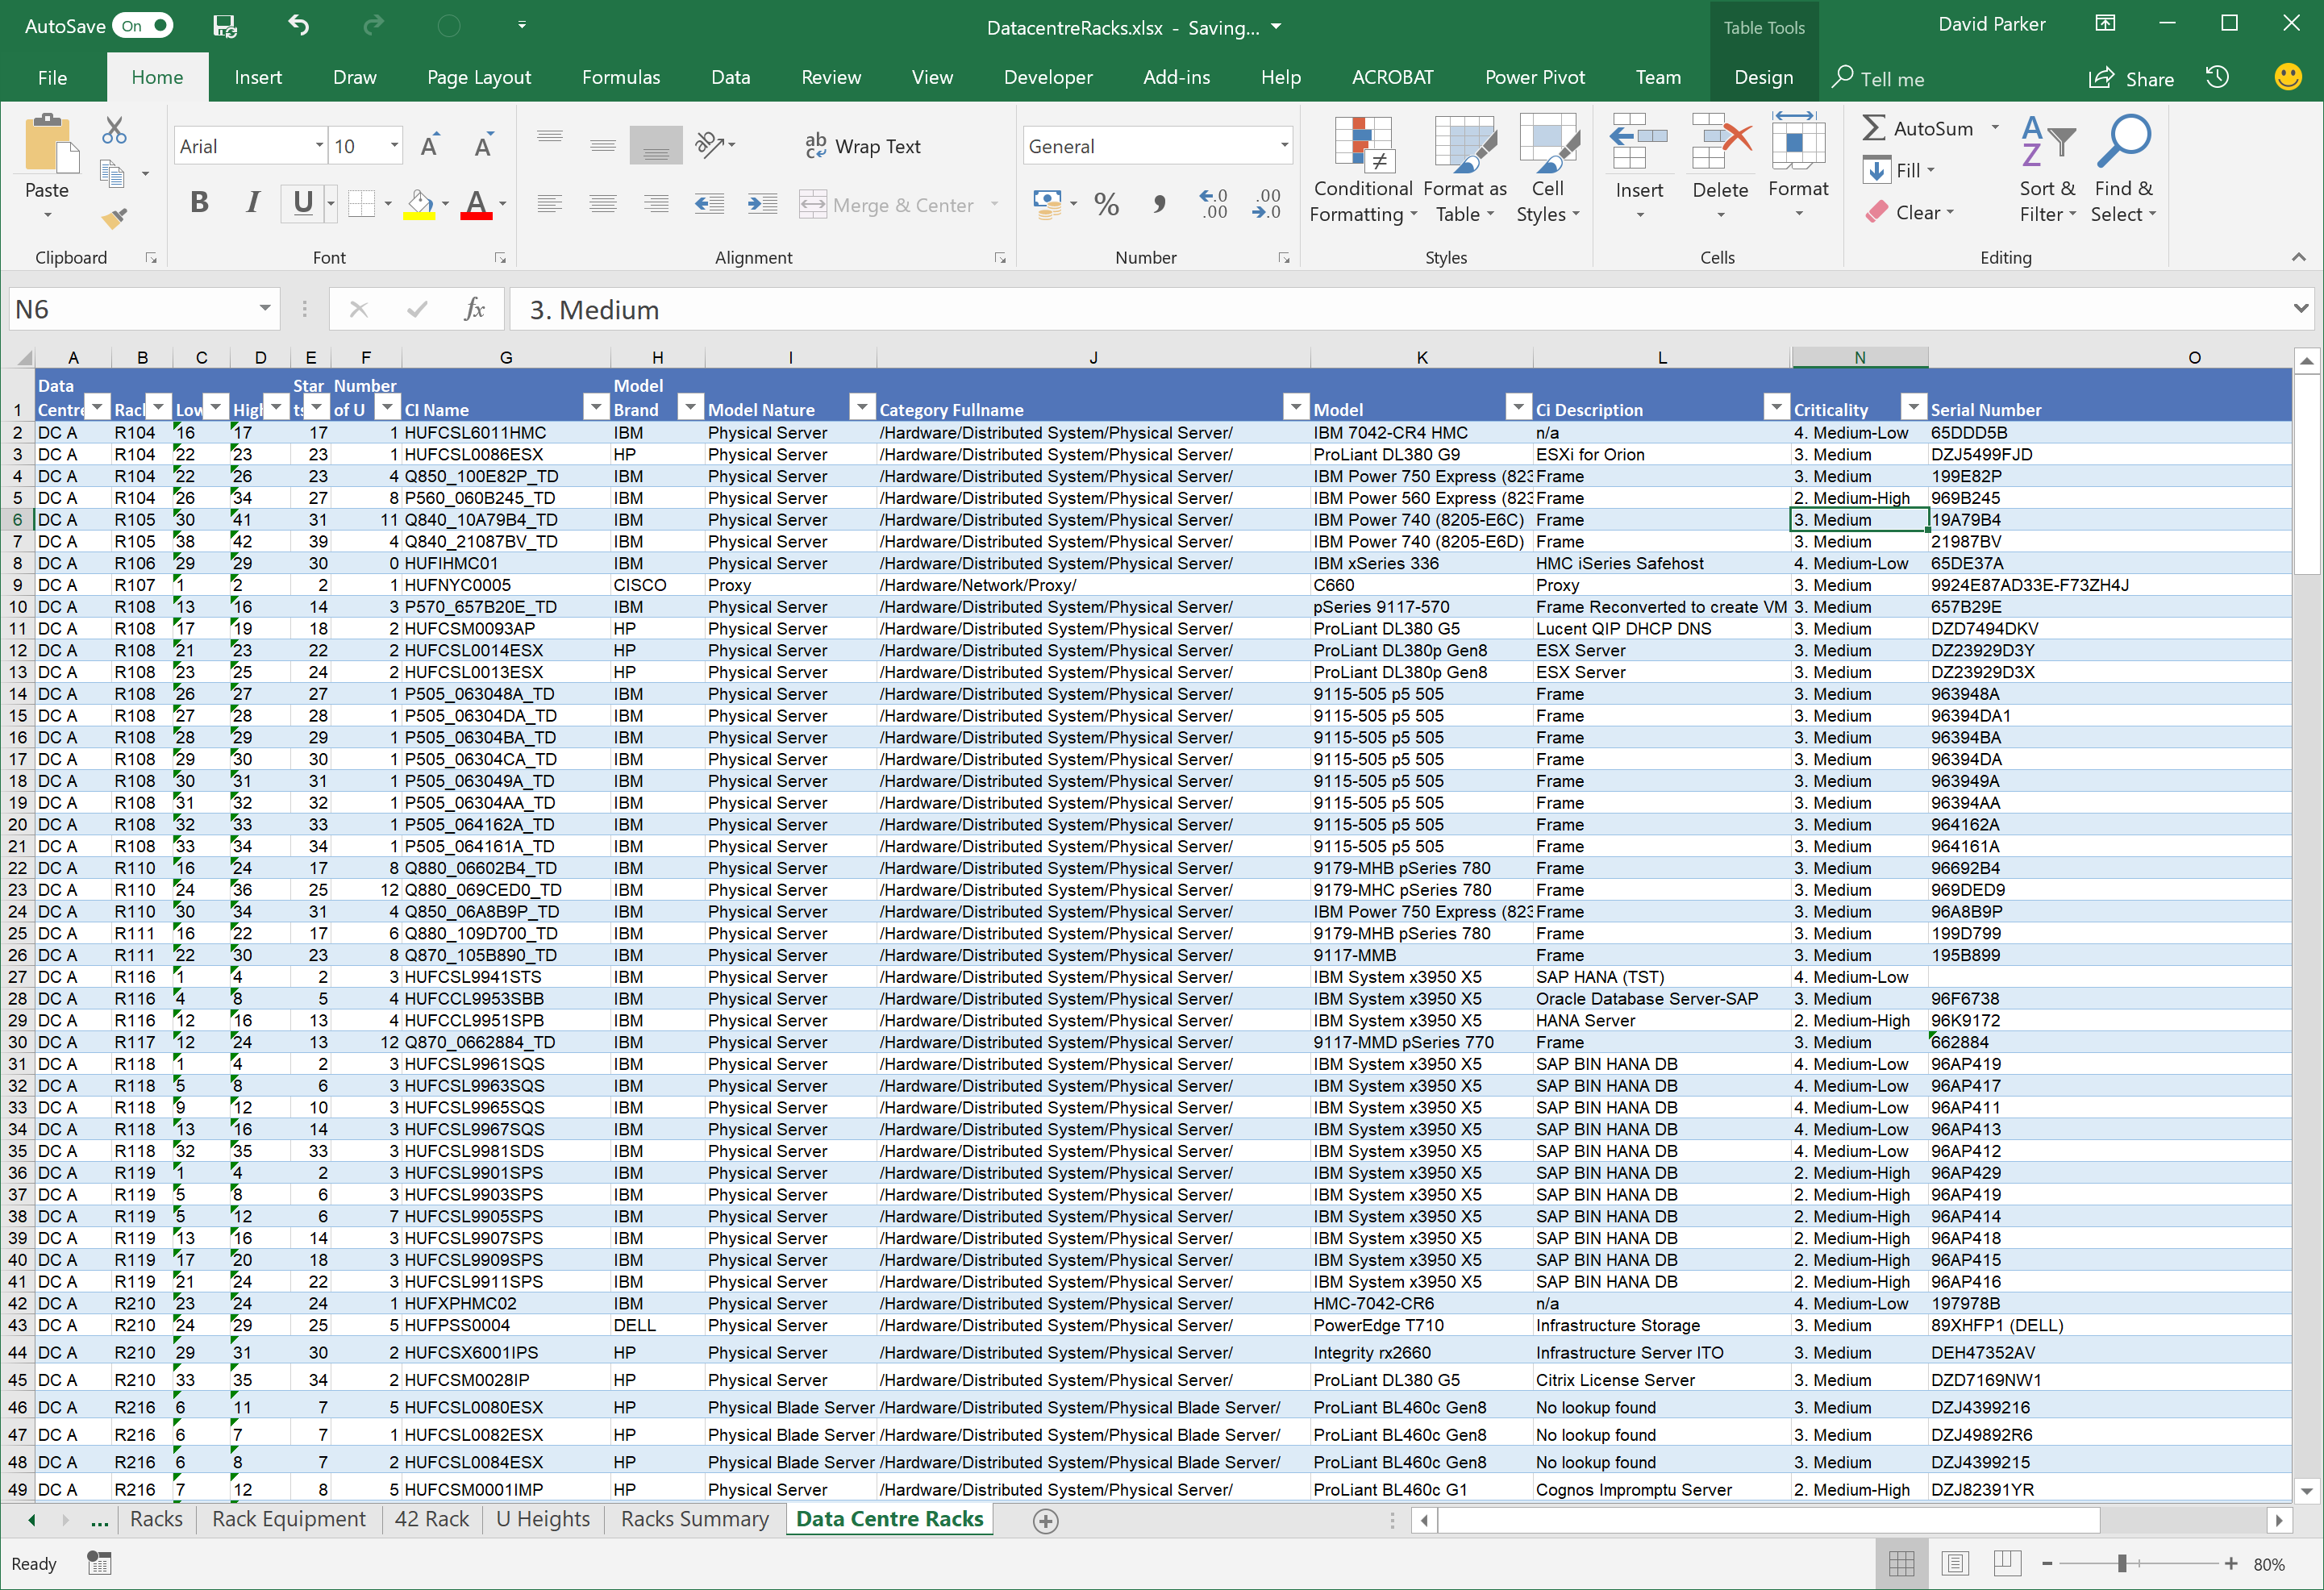
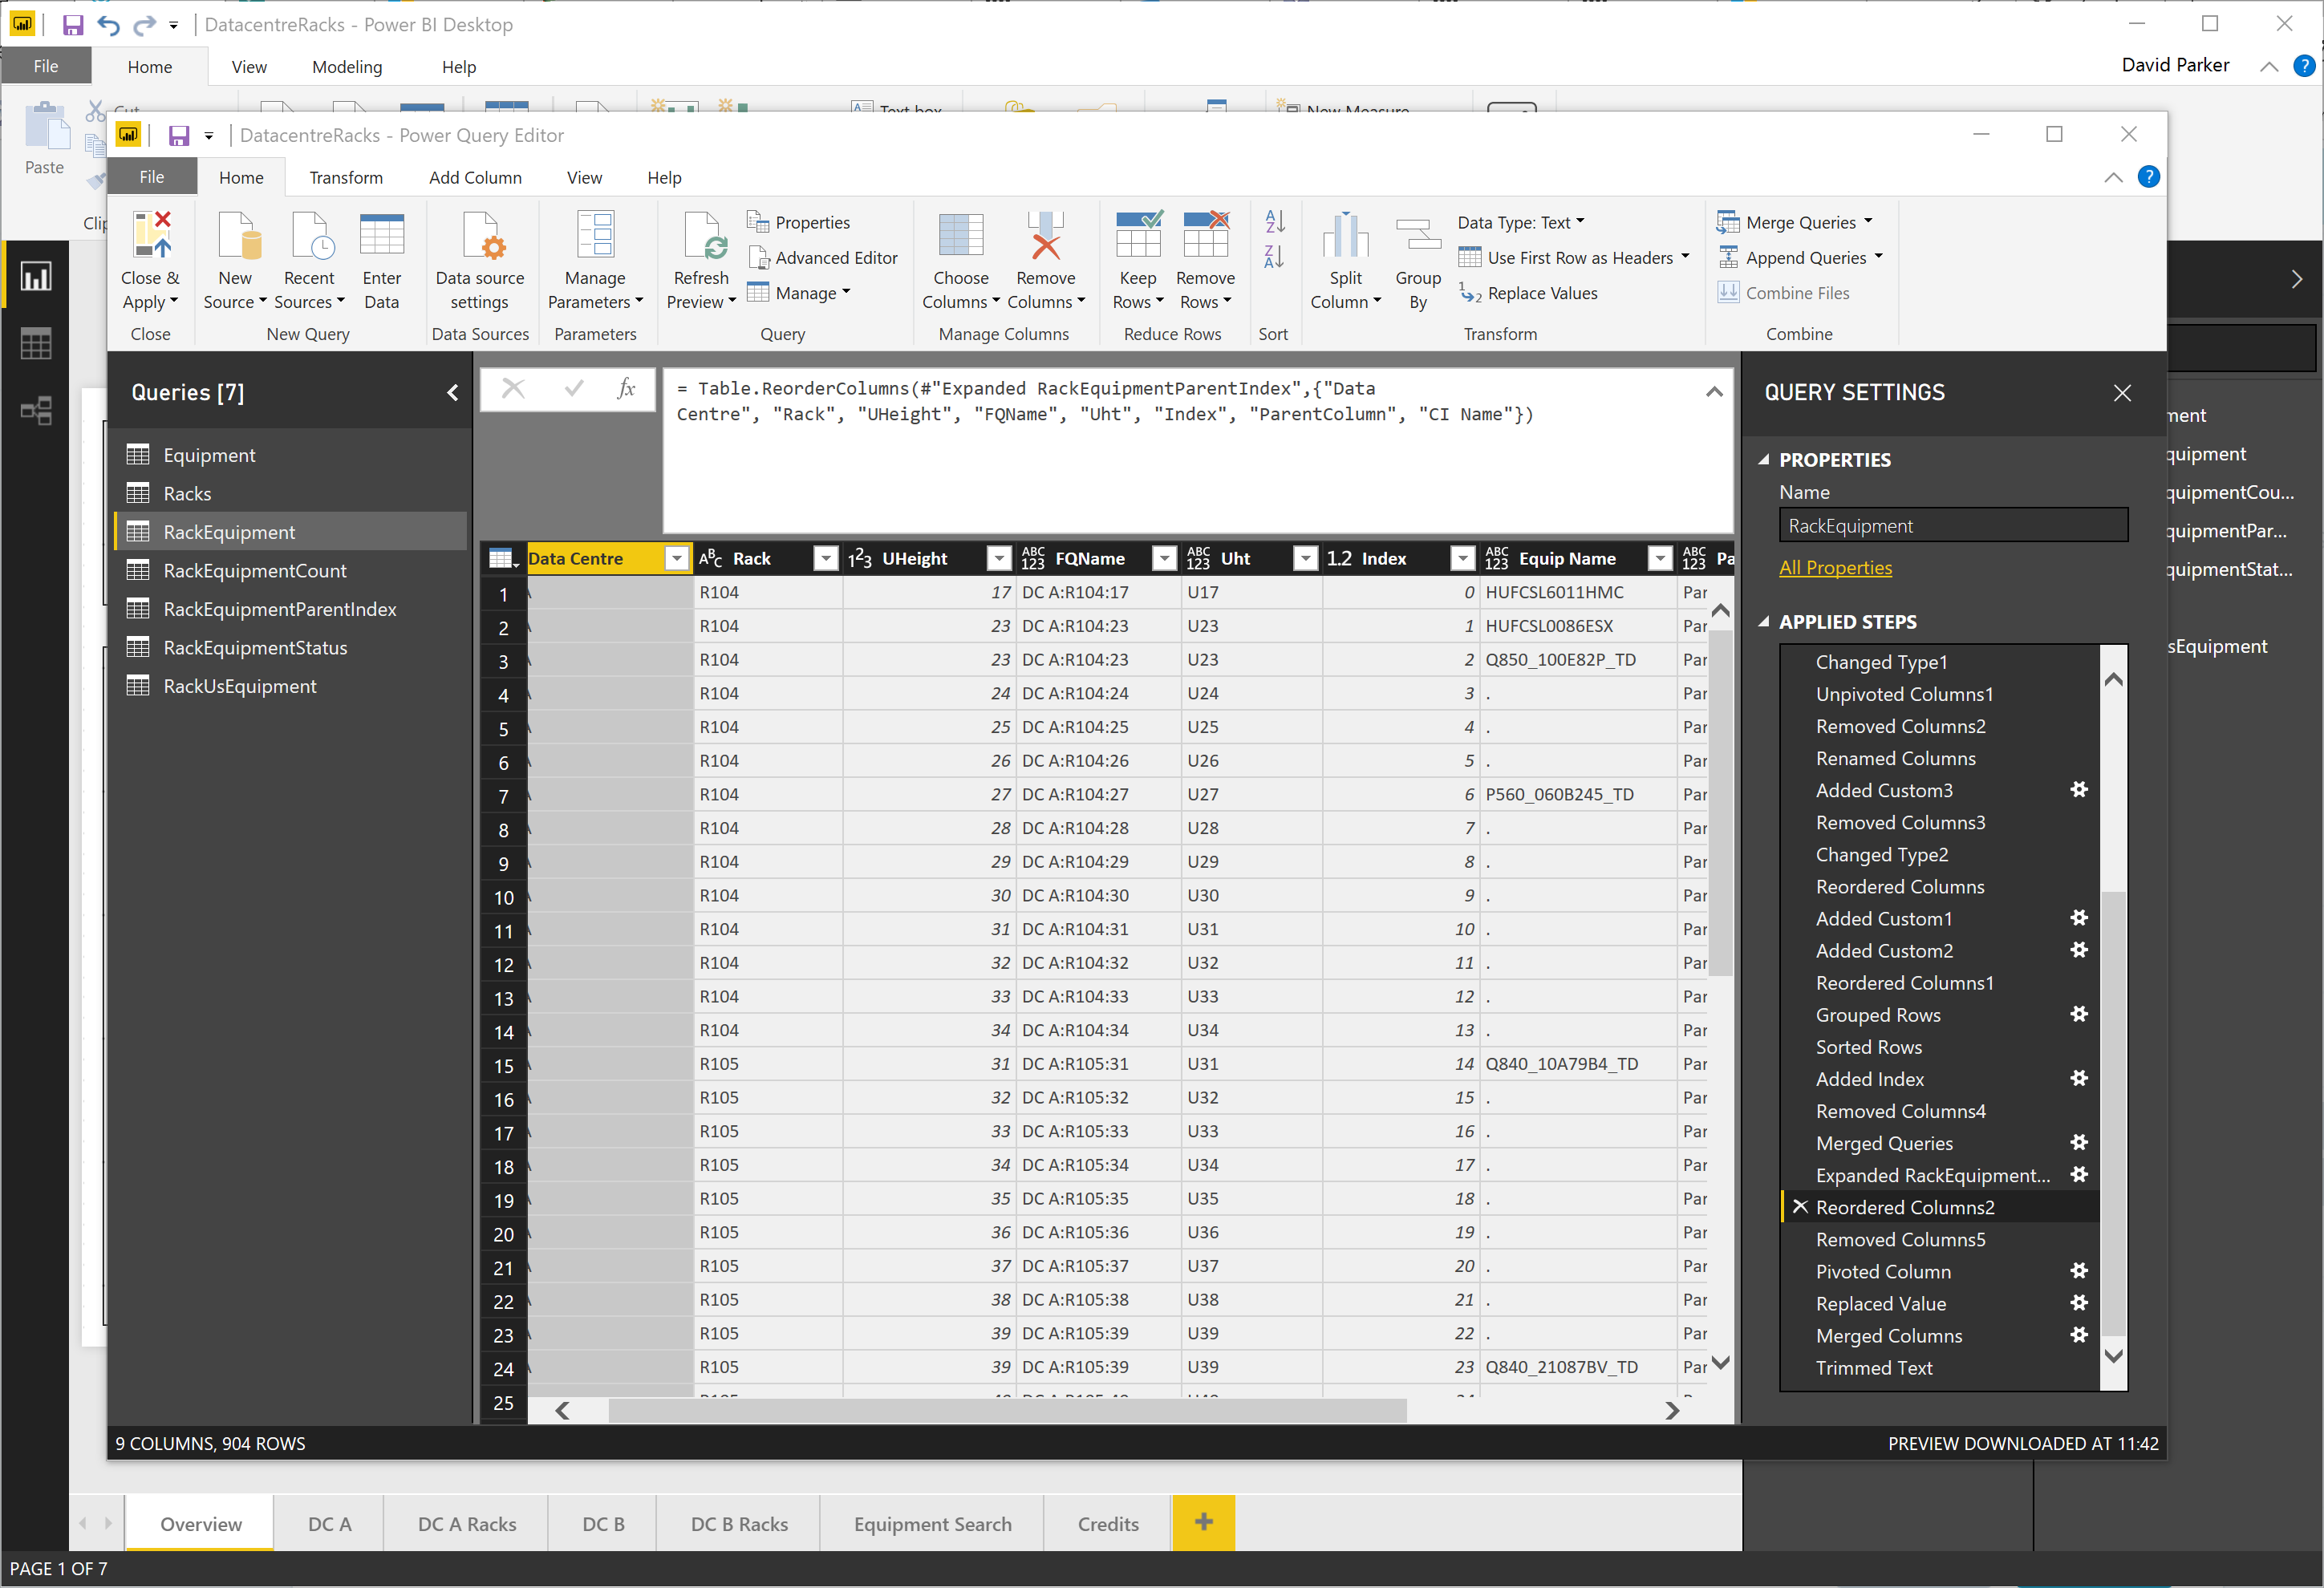
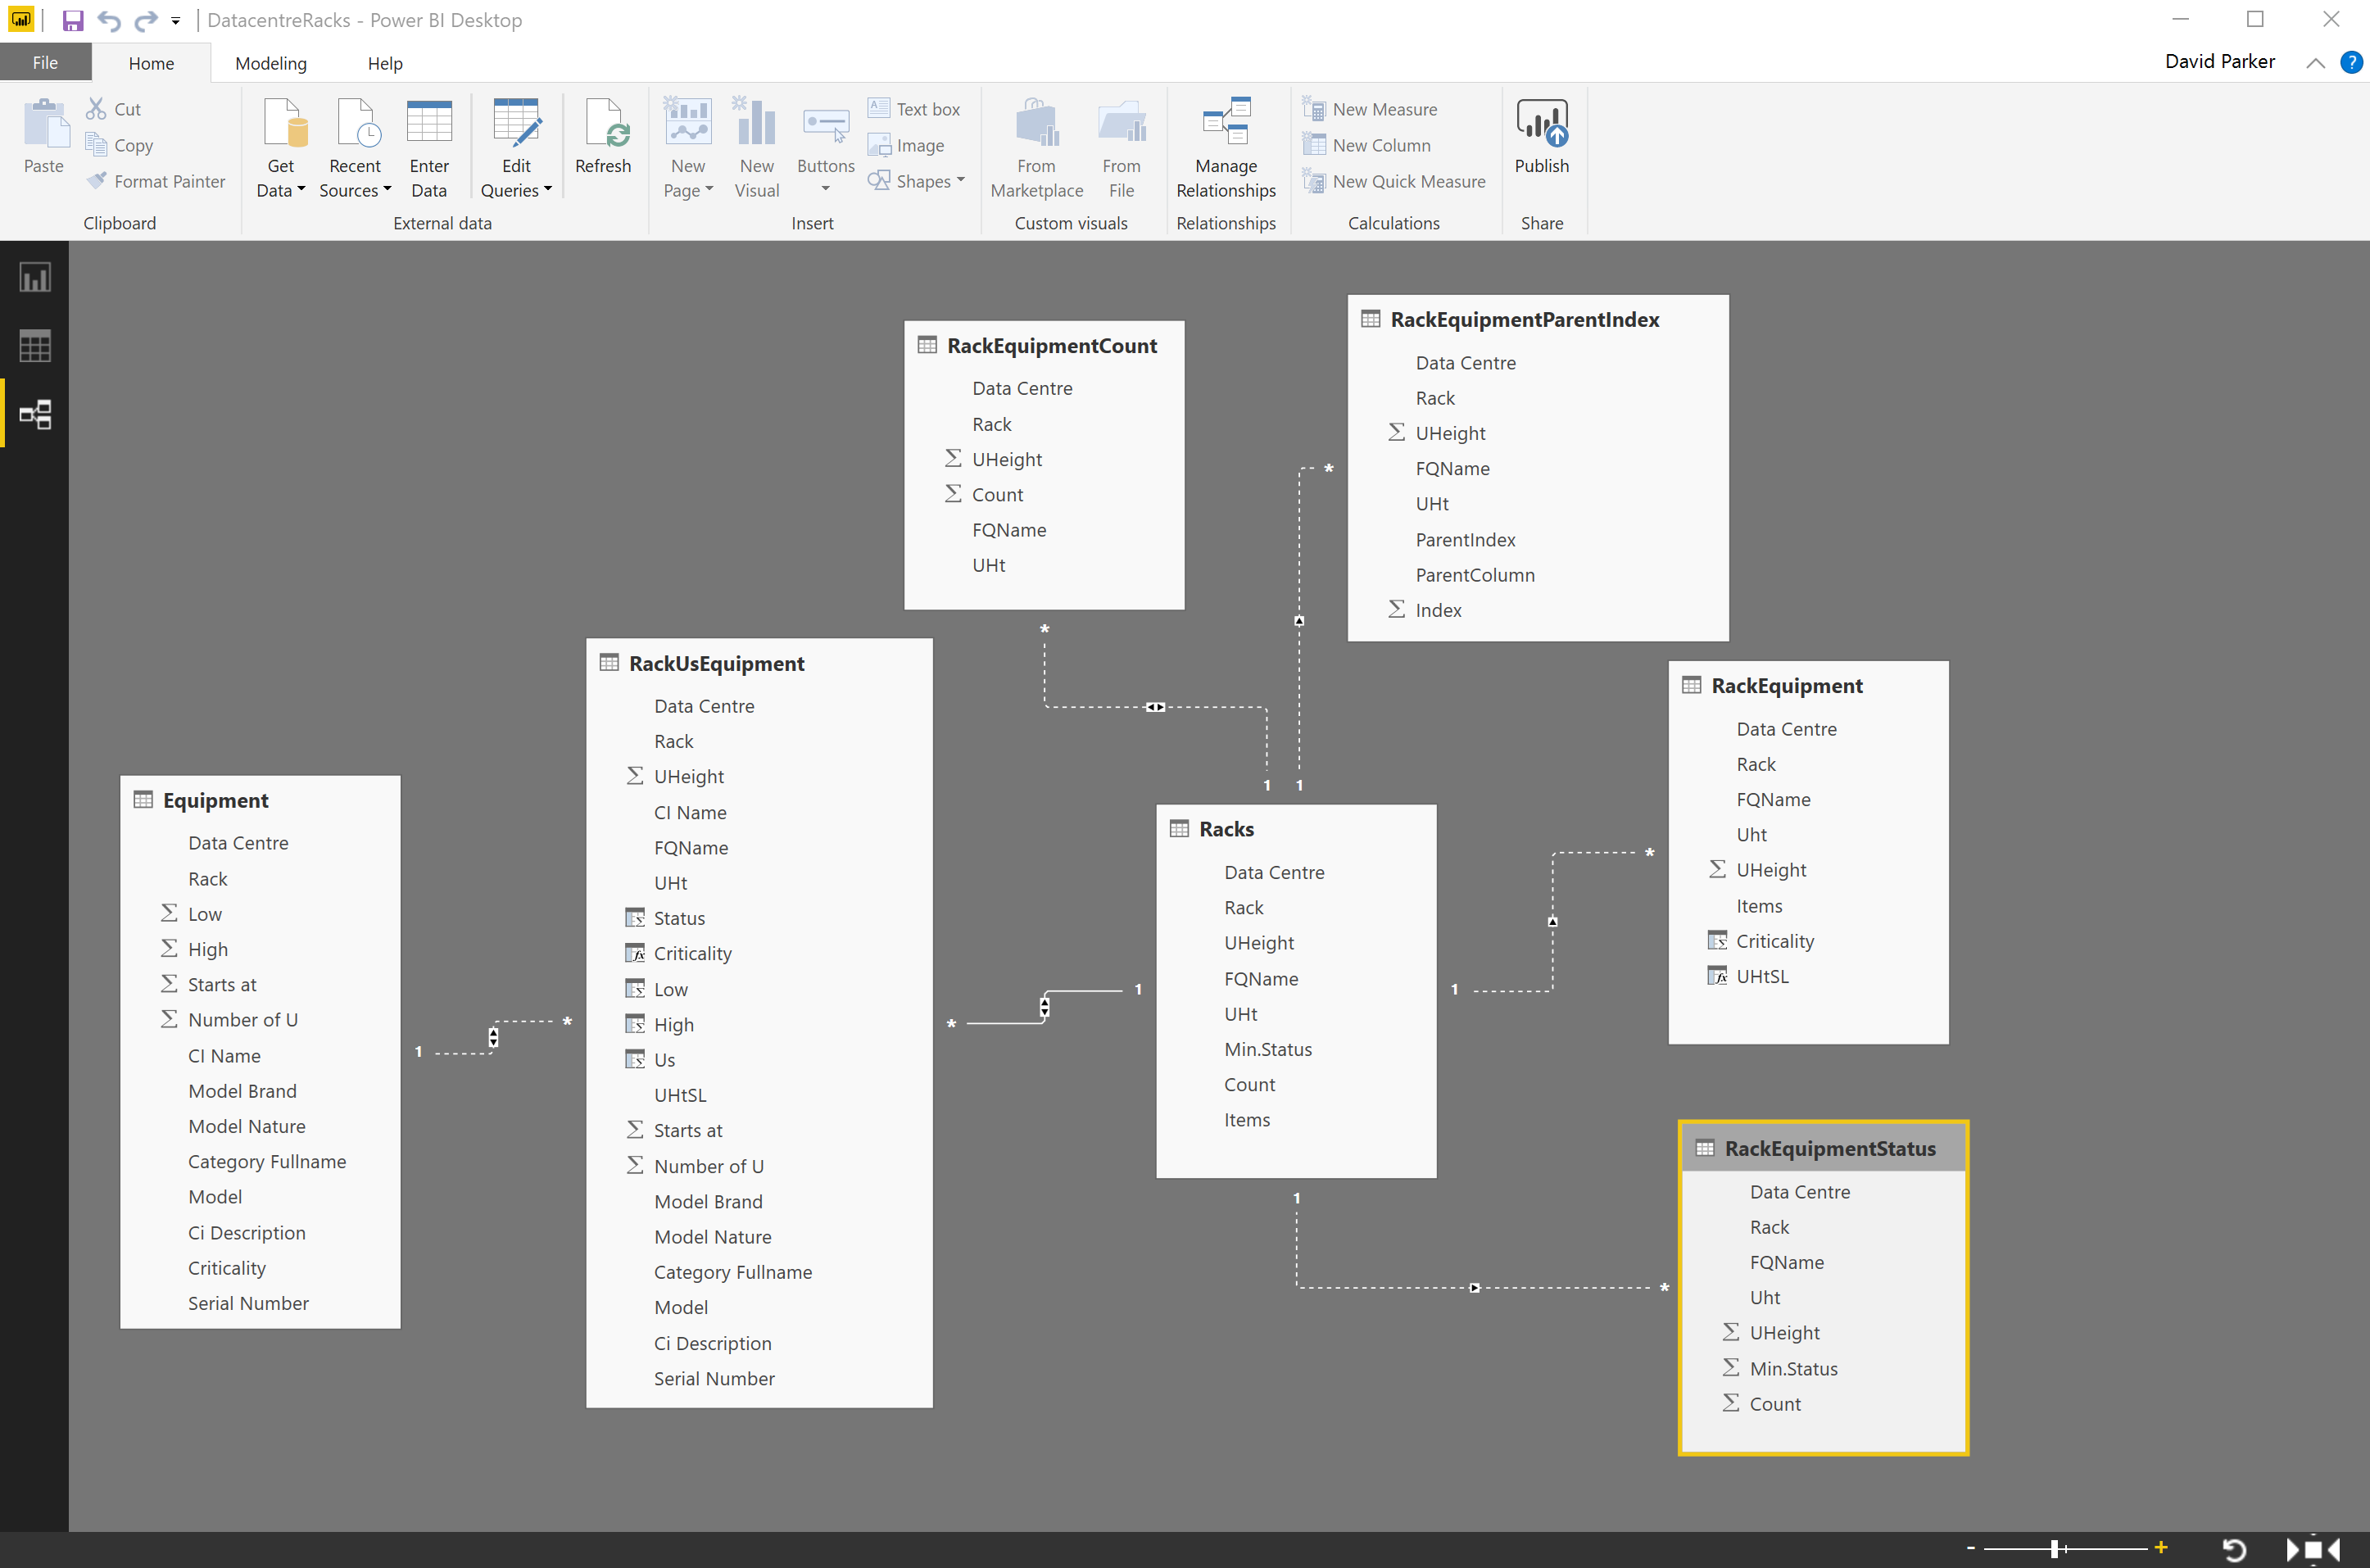
I have often diagrammed rack and cabinet layouts and elevations using Visio linked to a database or Excel tables. There is a Rack Diagram template in Visio which is great for manually creating cabinet elevations manually, but there is nothing currently out of the box to automate this process, so it can be a laborious task unless you have some custom code. It is quite simple to draw a computer room layout of the racks and cabinets and to link each one to a row of data. In this article, I have a table of rack equipment in Excel, and used PowerQuery in PowerBI to summarize these rows for each data center, rack and U height position, since there are sometimes more than one item of equipment per U height. In this example, I have color coded the criticality of each equipment such that the most important display as red, and the least important as green. This means that a PowerBI user can quickly see where the critical racks, U heights and equipment are. Of course, I could have used any metric, such as power consumption, heat output or humidity, for the colour-coding. It all depends on the data available, and the audience for the report.


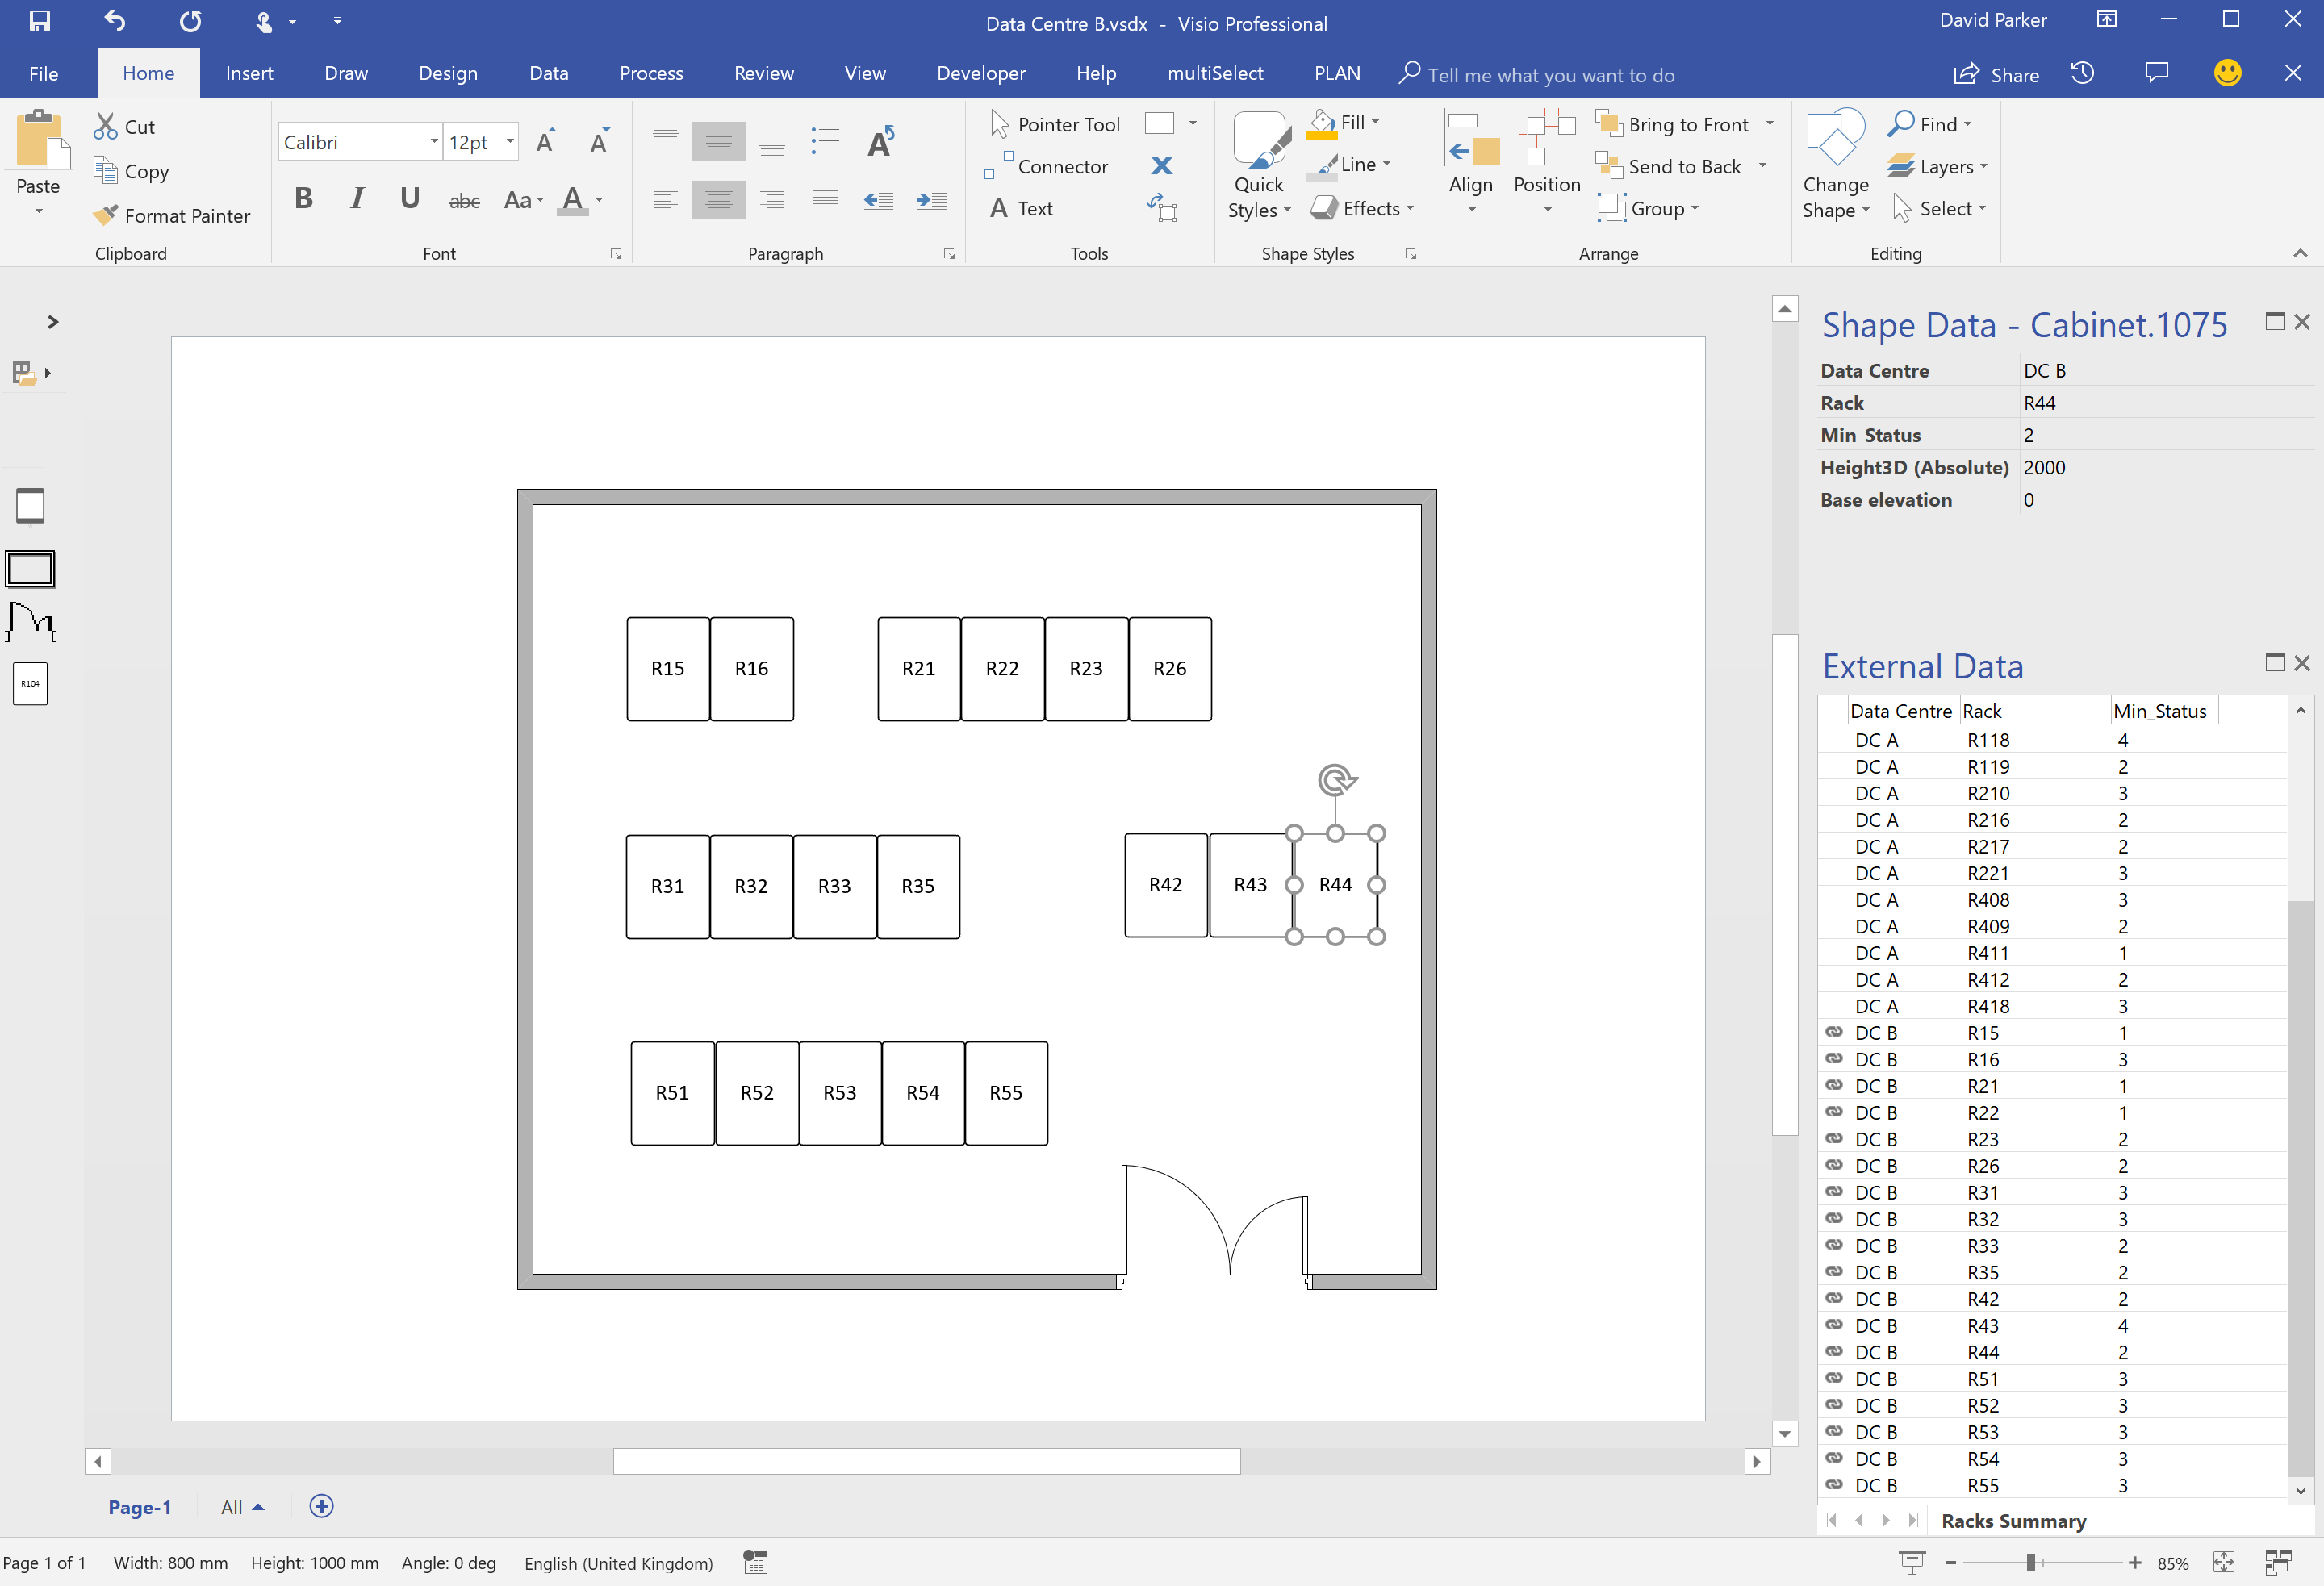
I used the Visio custom visual for the data centre floor plans because it is so simple to map PowerBi data rows to the Visio shape text or selected Shape Data values. However, I experimented representing the rack elevations in two different ways, so that I could test the difference.
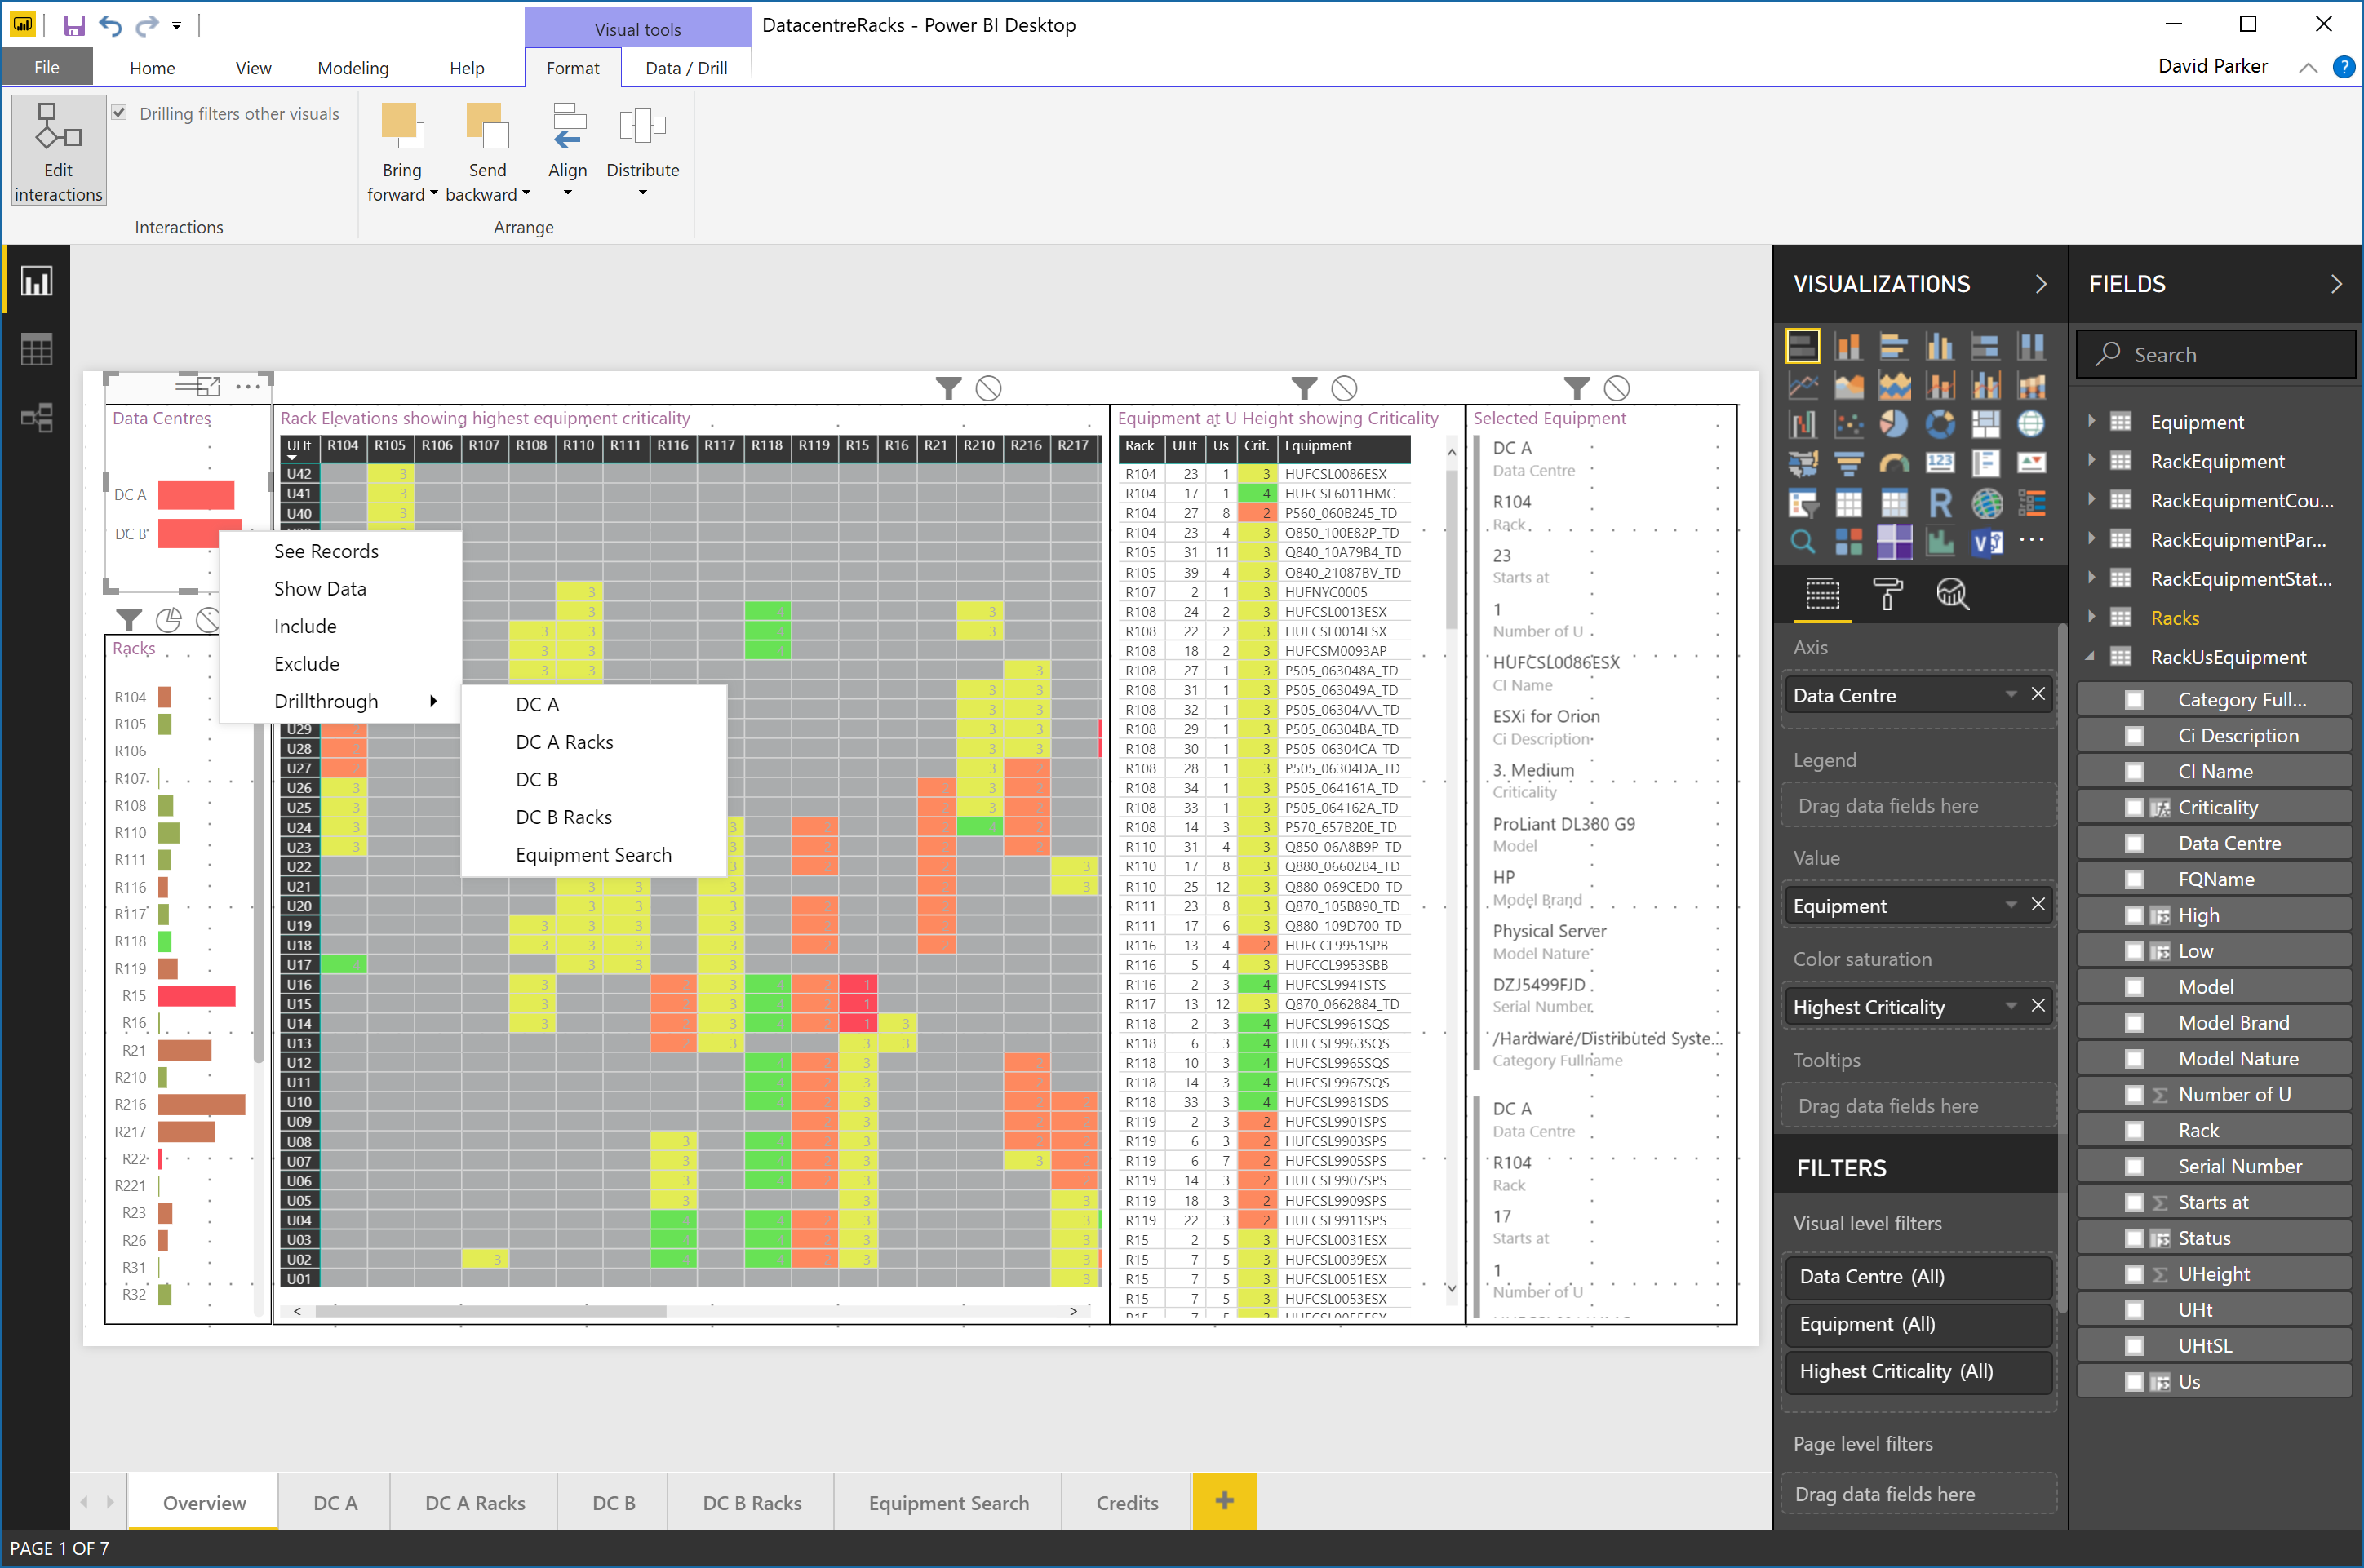
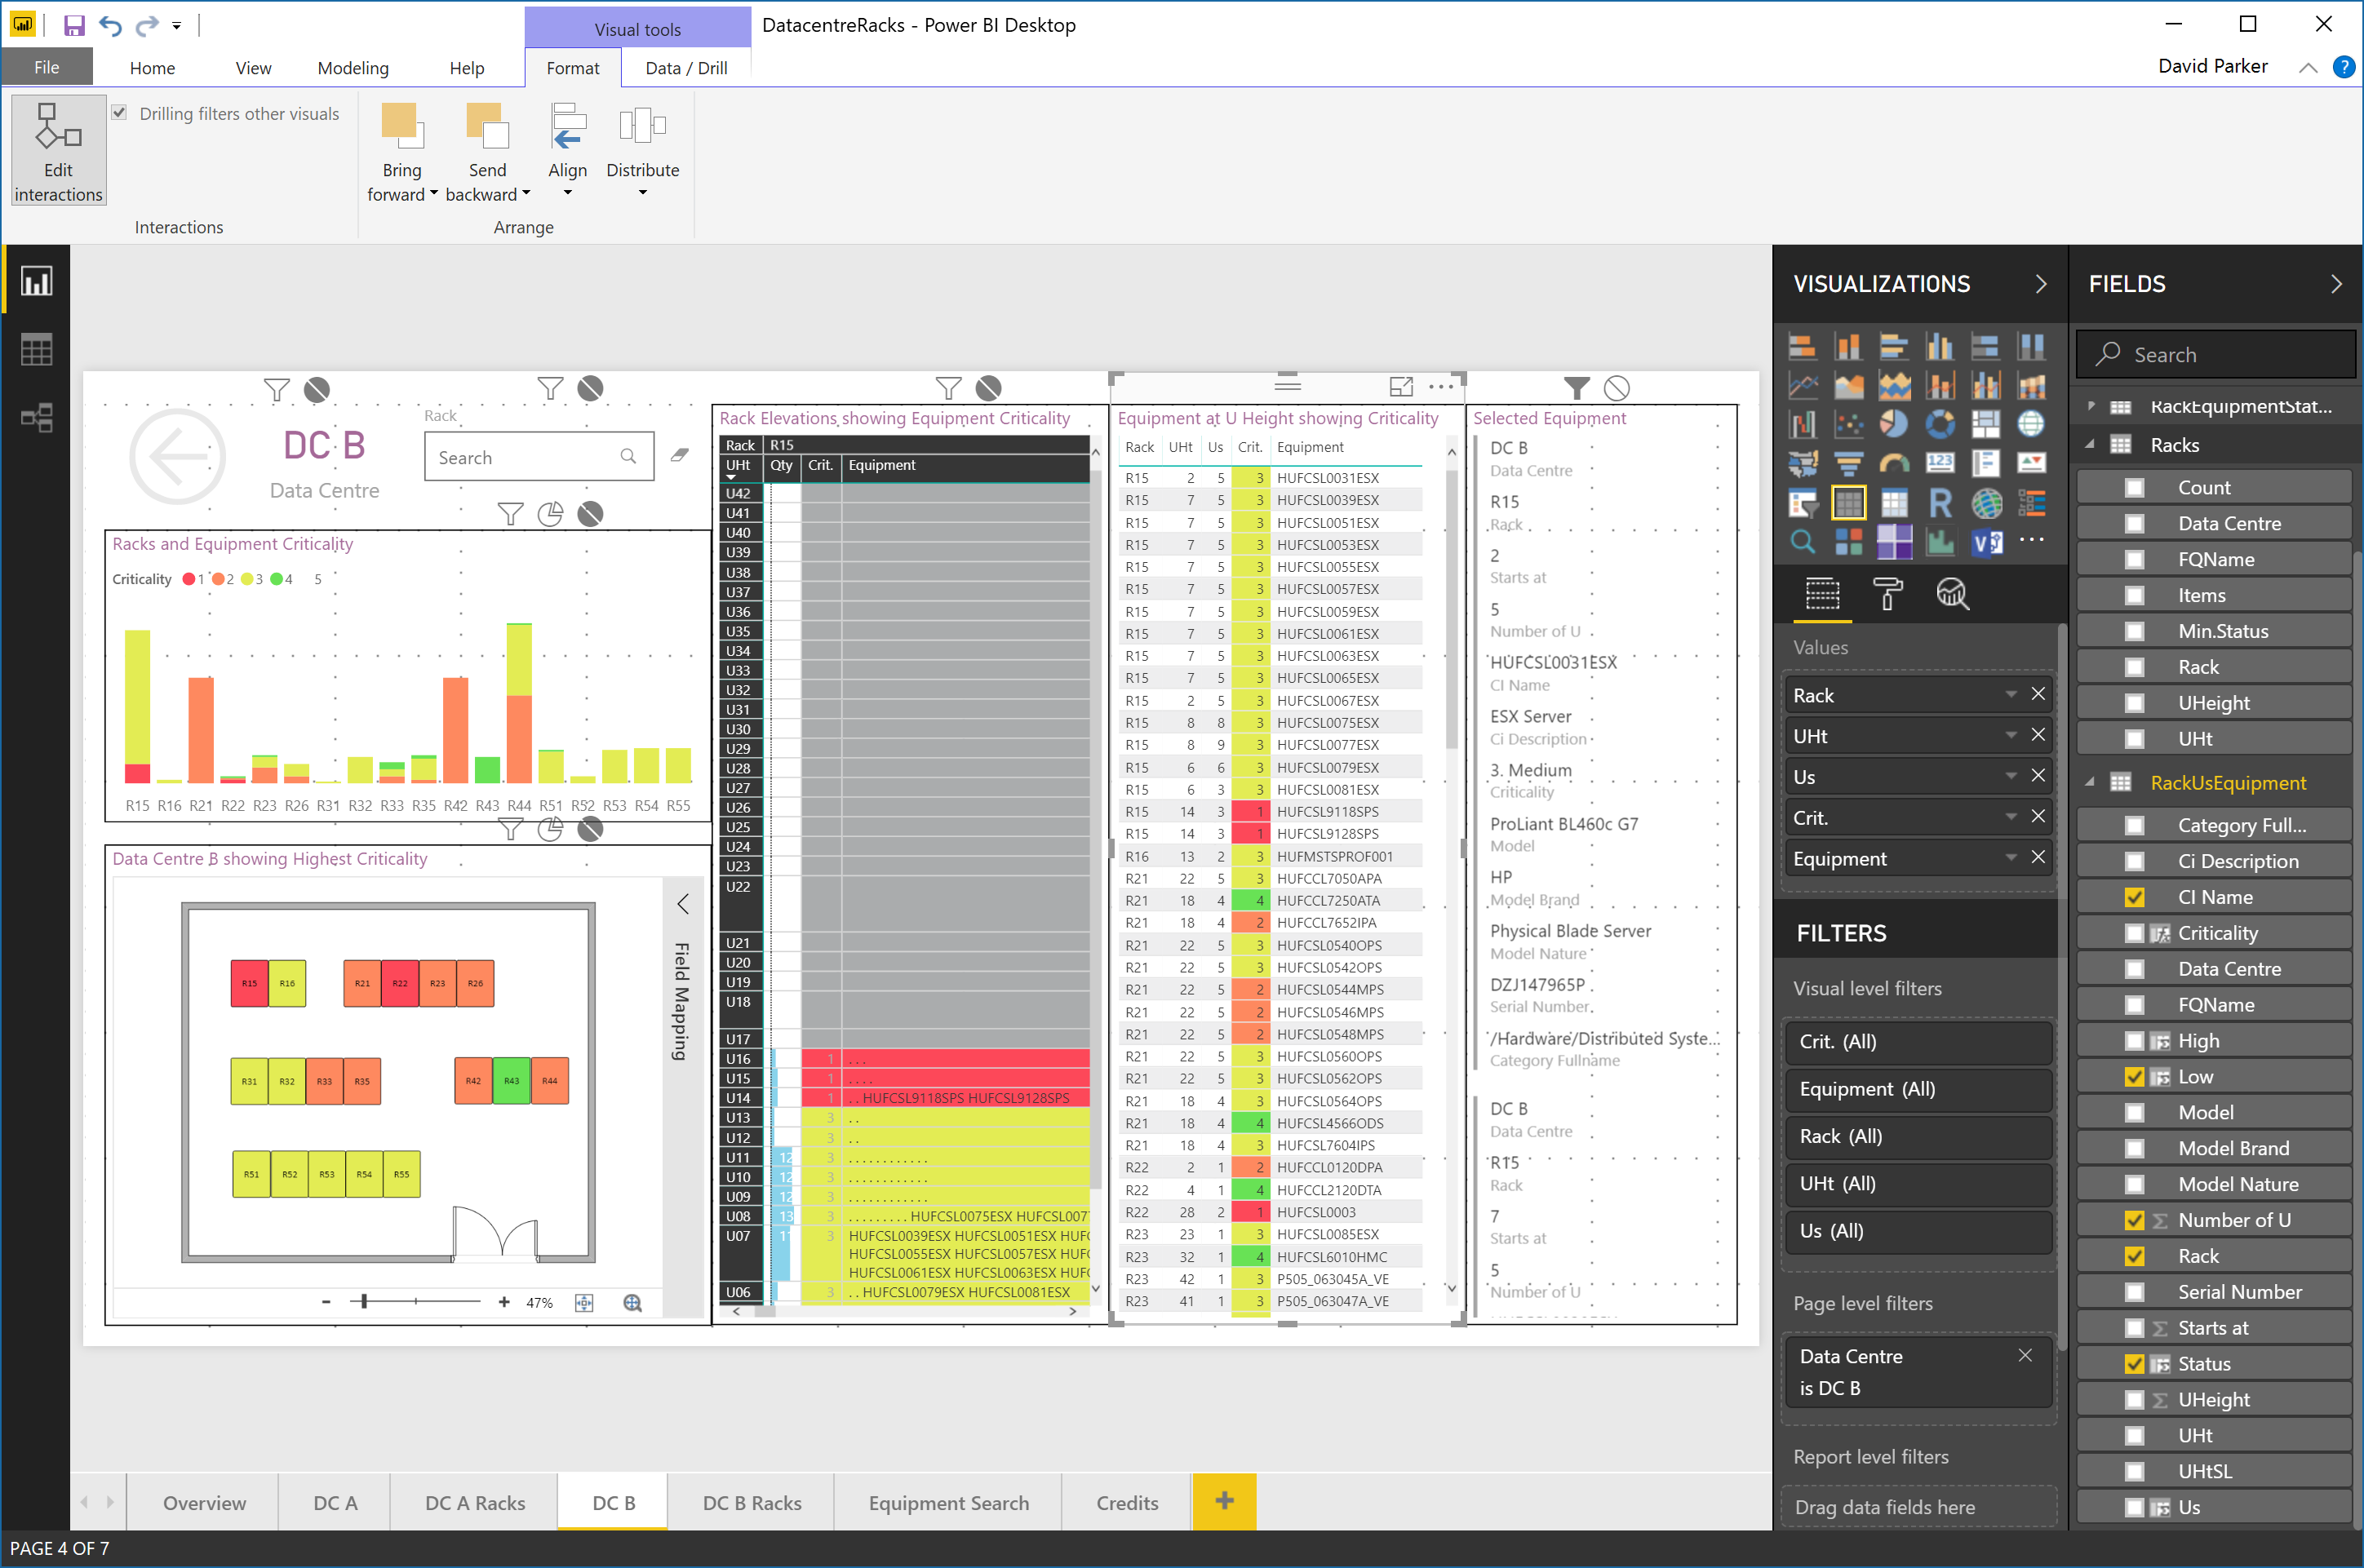
For one test, I used the standard Microsoft matrix custom visual to arrange the U heights vertically with the highest equipment criticality of the equipment at each U color-coded.


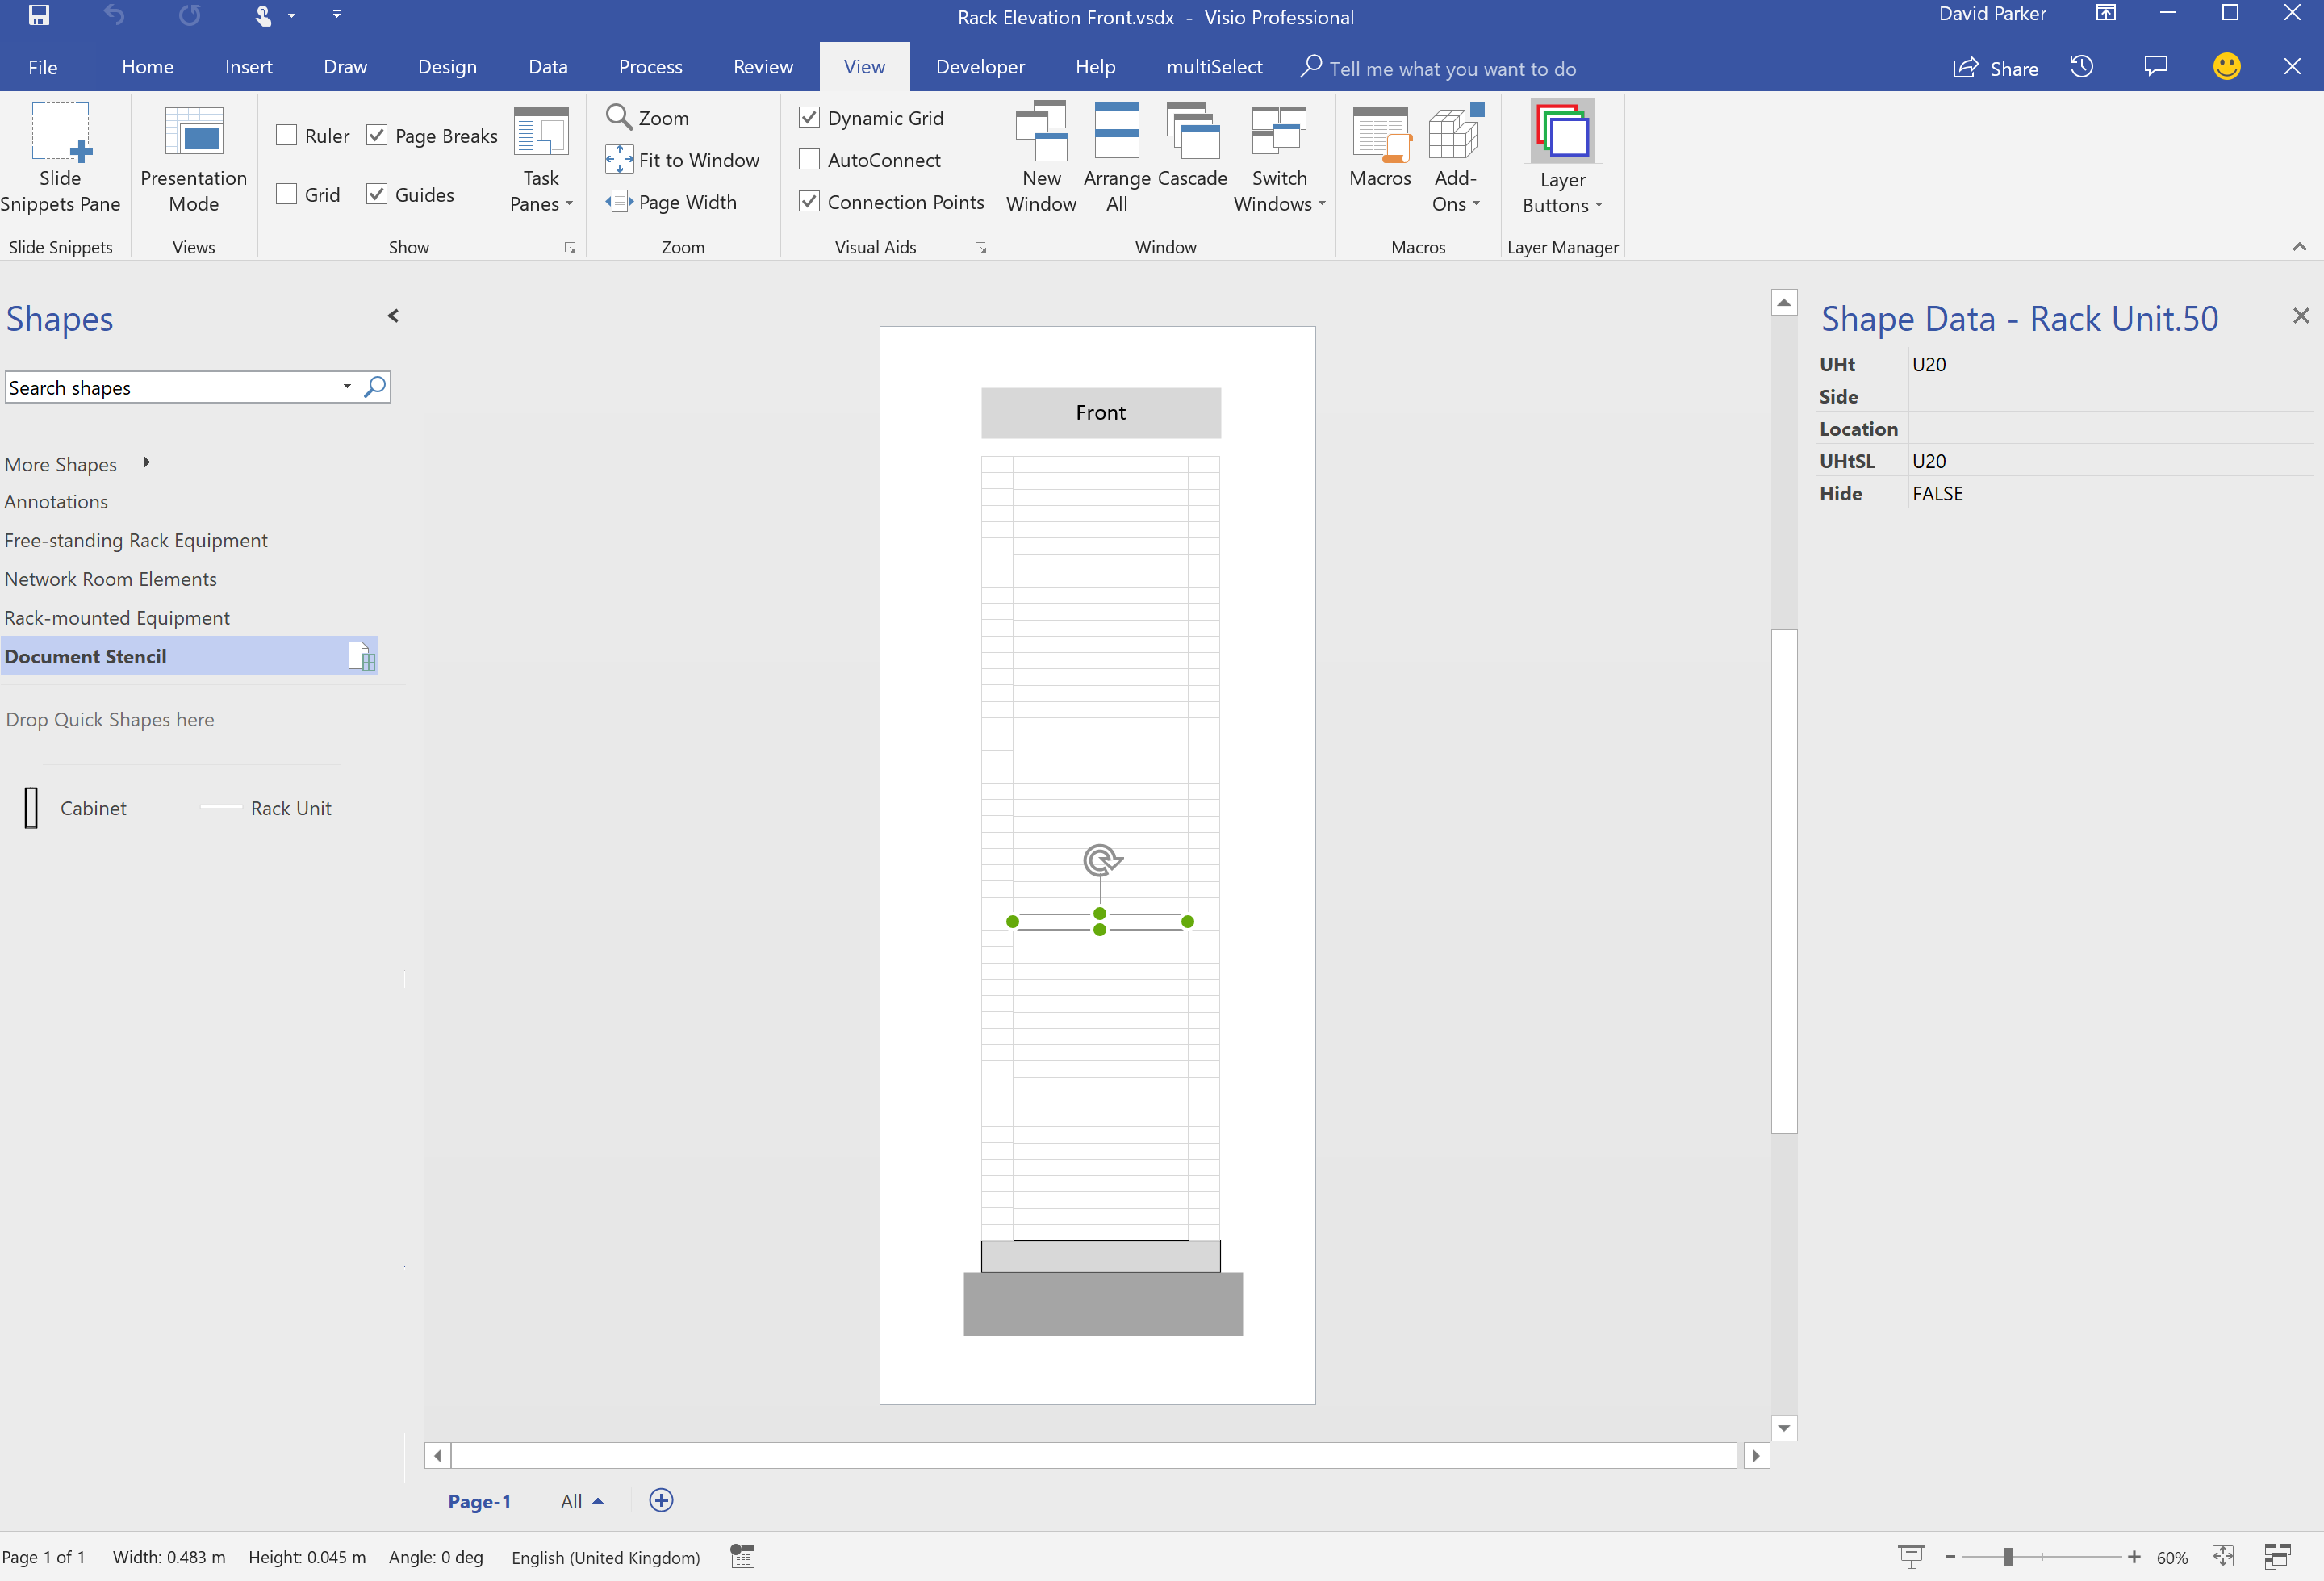
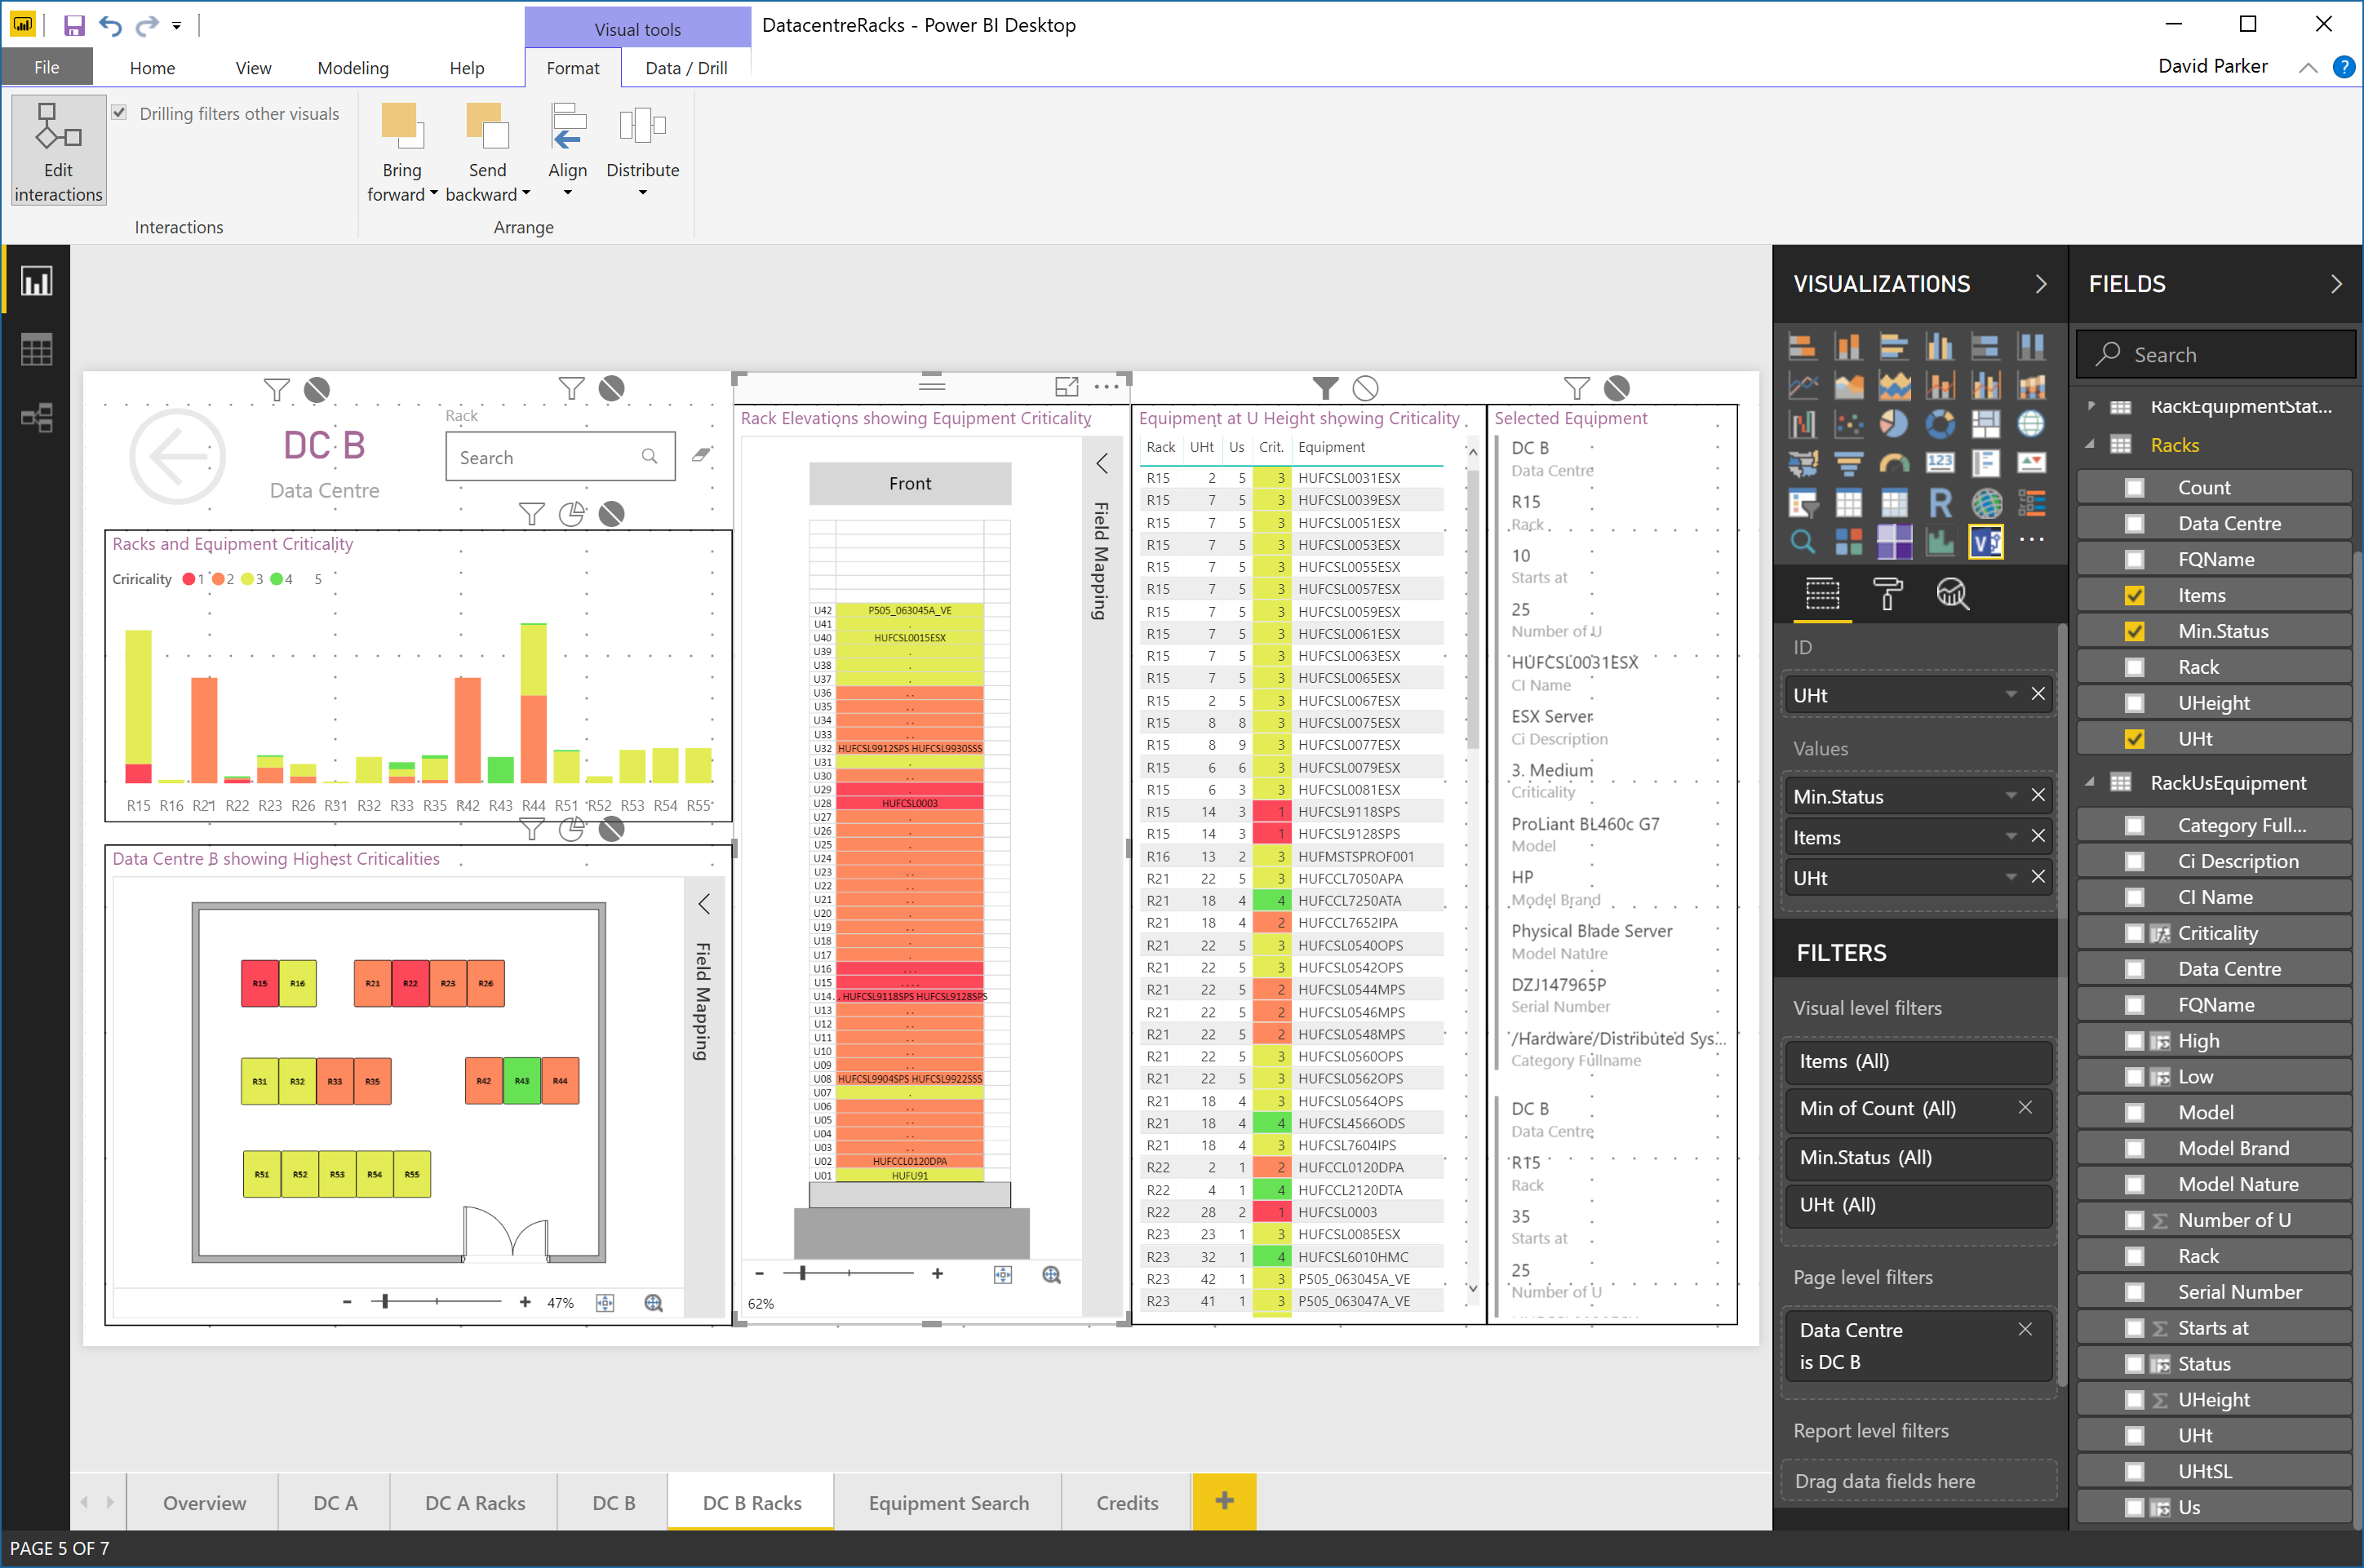
For the second test, I used the preview Visio custom visual of a blank rack elevation with just coded rectangles for each U height. I could then link the rack equipment summary data for each U height to each rectangle automatically, and color code the highest criticality again. I think the visual is more pleasing than the matrix, and of course I can zoom in on the graphic.


Well this was my experiment in creating a visual interactive report for data centres. The data can be maintained in Excel or another data source, and the rack elevations do not need to be maintained manually. Of course, the rack elevations are not using the near photo-realistic shapes that some third-party vendors offer, but it does focus the attention on the data, which is, after all, the whole reason for the report in he first place!
You can play with the experiment at Link to PowerBI example
 

Related

Filed Under: Network Diagrams, PowerBI, Visio Tagged With: Excel, PowerQuery, Shape Data

About David Parker

David Parker has 25 years' experience of providing data visualization solutions to companies around the globe. He is a Microsoft MVP and Visio expert.

Reader Interactions

Comments

  1. The DR says

    August 30, 2023 at 9:34 pm

    This is really neat. I was looking at integrating a similar idea using SharePoint list (dynamically update via PowerShell) and Visio but the PowerBI integration has me thinking this might be a better way to go. Do you have an example of this template somewhere we can download it?

    Great work.

    Log in to Reply

Leave a Reply Cancel reply

You must be logged in to post a comment.

Primary Sidebar

  • LinkedIn
  • Twitter

Recent Posts

  • Co-authoring and Commenting with Visio Documents
  • Fixing dimensions of 2D shapes
  • Merging Linked Data from Similar Tables
  • Smart Radio Buttons and Check Boxes in Visio
  • Using Button Face Ids in Visio

Categories

Tags

Accessibility Add-Ins Connectors Containers Data Export Data Graphics Data Import Data Visualizer Educational Excel GraphDatabase Hyperlinks Icon Sets JavaScript LayerManager Layers Legend Link Data to Shapes Lists MSIgnite MVP Office365 Org Chart PowerApps PowerBI PowerQuery Processes Setup and Deployment Shape Data Shape Design ShapeSheet ShapeSheet Functions SharePoint 2013 SQL Teams Validation VBA Video Visio Visio 2007 Visio for the Web Visio Online Visio Services Visio Viewer Webinar

Footer

bVisual Profile

The UK-based independent Visio consultancy with a worldwide reach. We have over 25 years experience of providing data visualization solutions to companies around the globe.

Learn more about bVisual

  • Amazon
  • E-mail
  • Facebook
  • LinkedIn
  • Twitter
  • YouTube

Search this website

Recent posts

  • Co-authoring and Commenting with Visio Documents
  • Fixing dimensions of 2D shapes
  • Merging Linked Data from Similar Tables
  • Smart Radio Buttons and Check Boxes in Visio
  • Using Button Face Ids in Visio

Copyright © 2025 · Executive Pro on Genesis Framework · WordPress · Log in