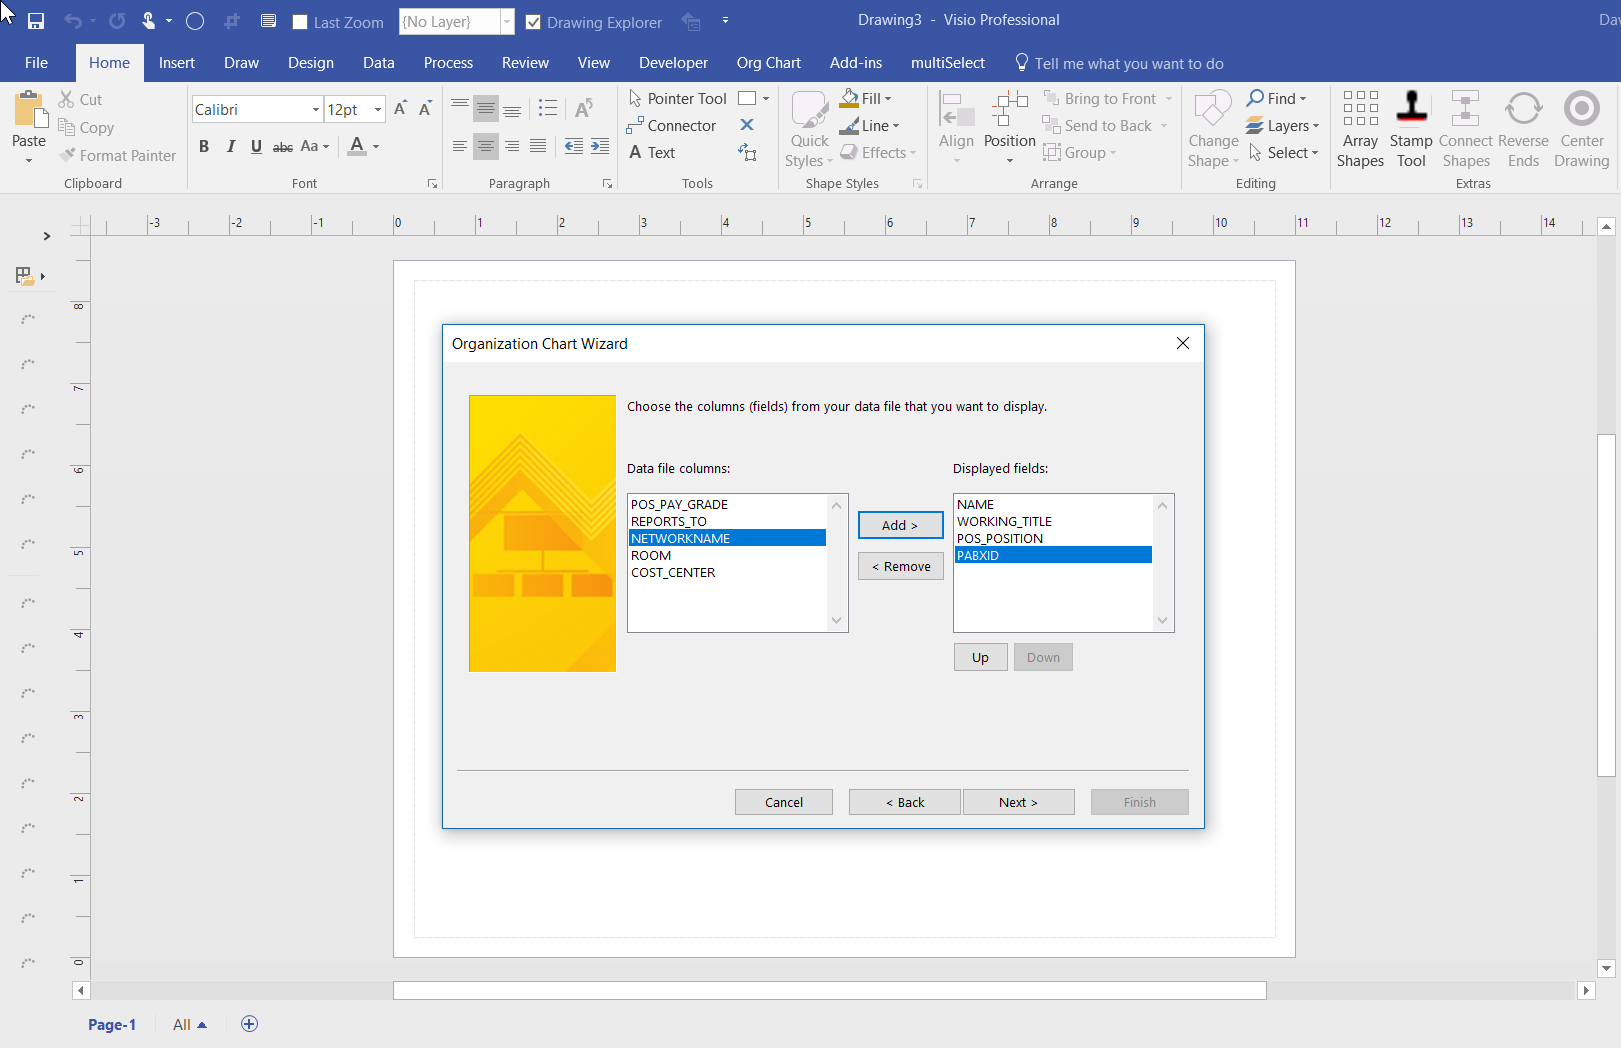
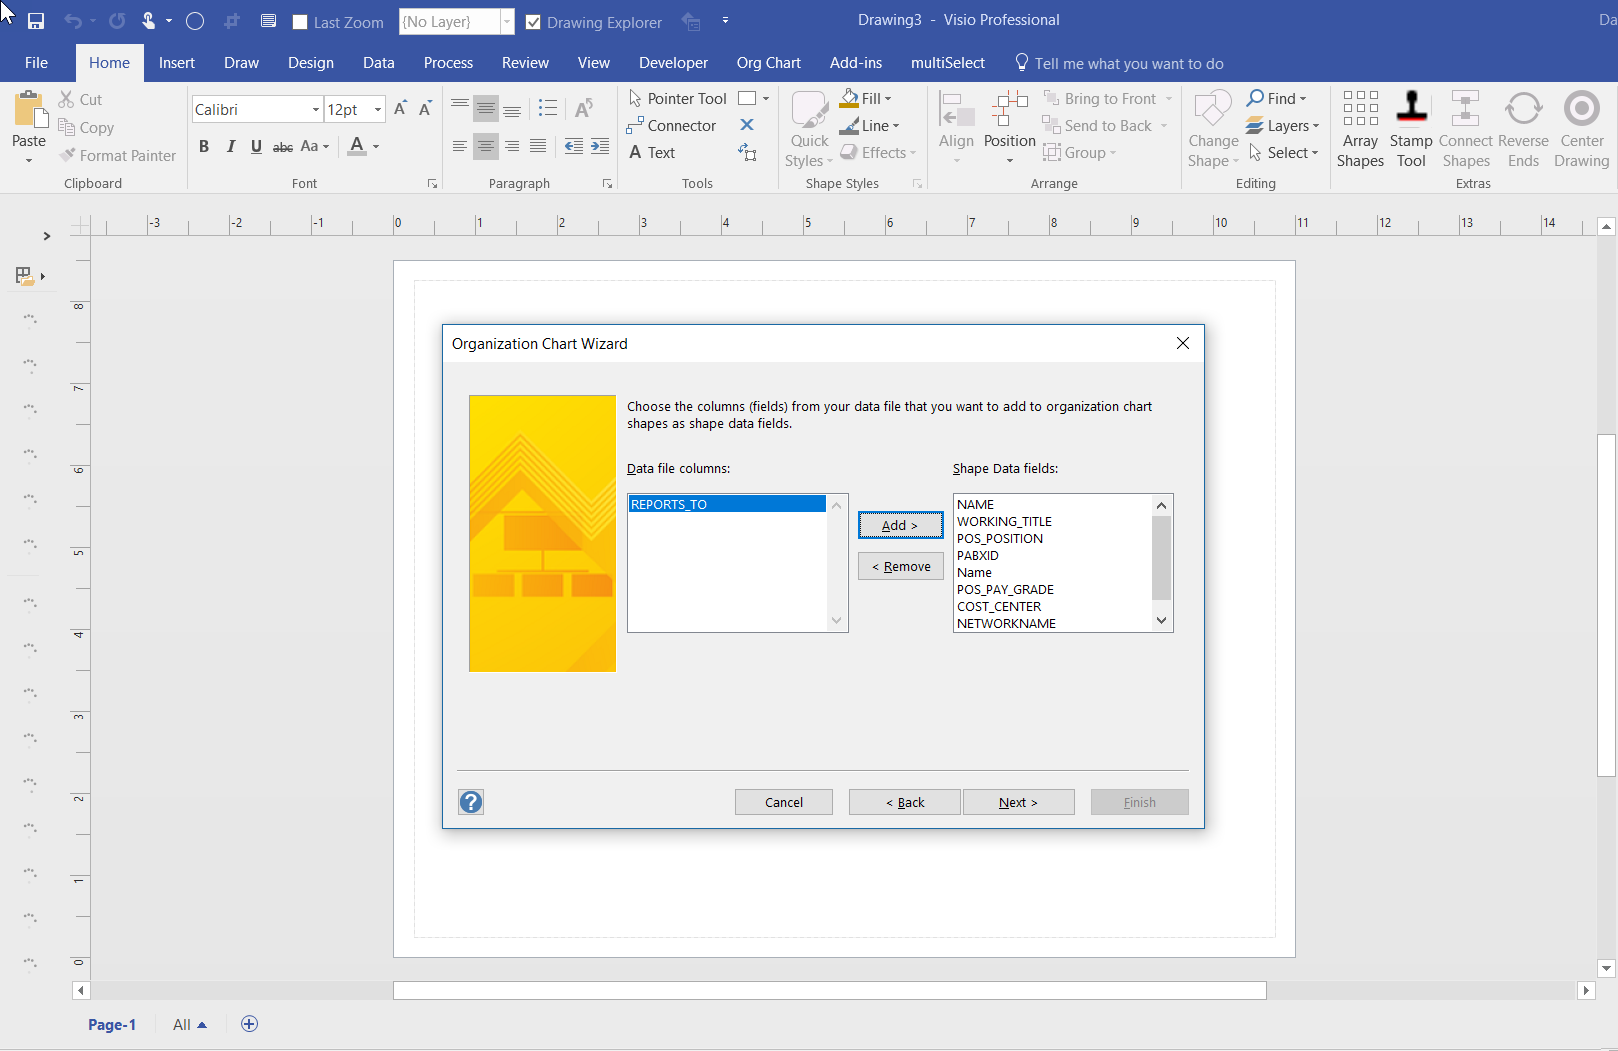
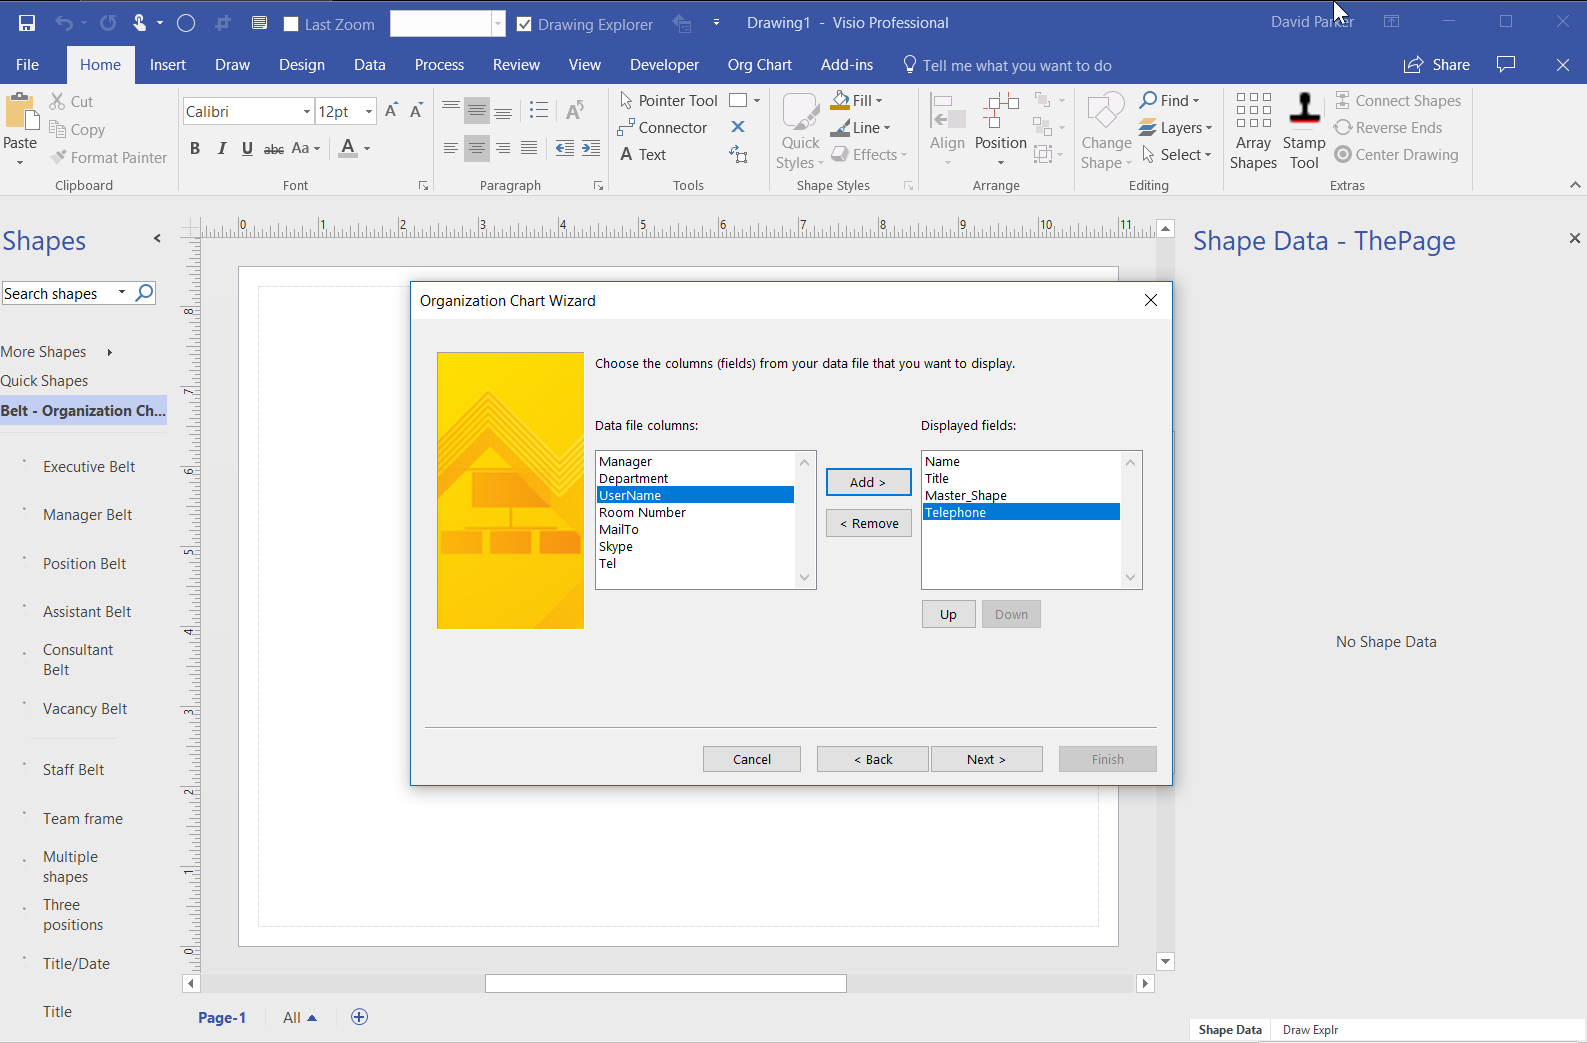
One of the most frequently used components of Visio is the Organization Chart Wizard (OrgChWiz), but it is also one of the most frustrating because of its apparent inflexibility. I was recently asked how to use different table column names with the wizard because the originating ODBC source could not be touched. Well, I have previously used Access to modify and enhance tables in this situation, but the OrgChWiz is quite old, and does not like using the newer Access queries as a data source unfortunately. If the basic table column names do not match the default column names in the organization chart shapes, then there may be superfluous Shape Data rows created on each shape and the ability to change the shape style is compromised, and the Shape Data rows get quite confused!
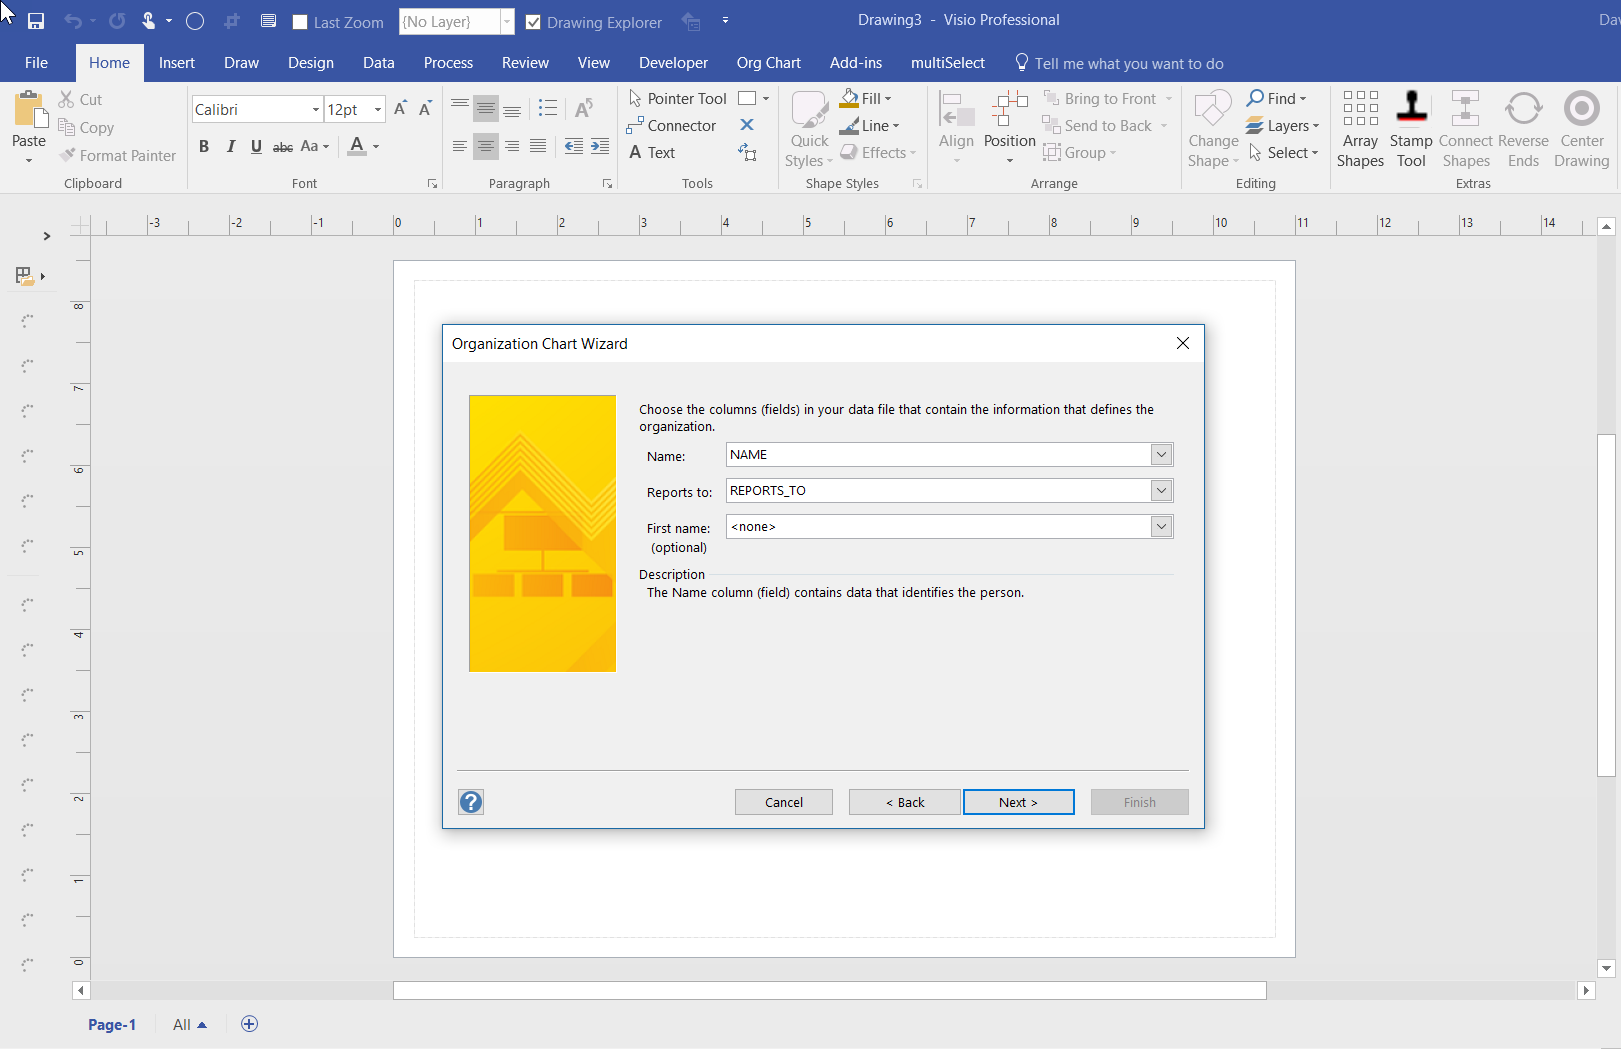
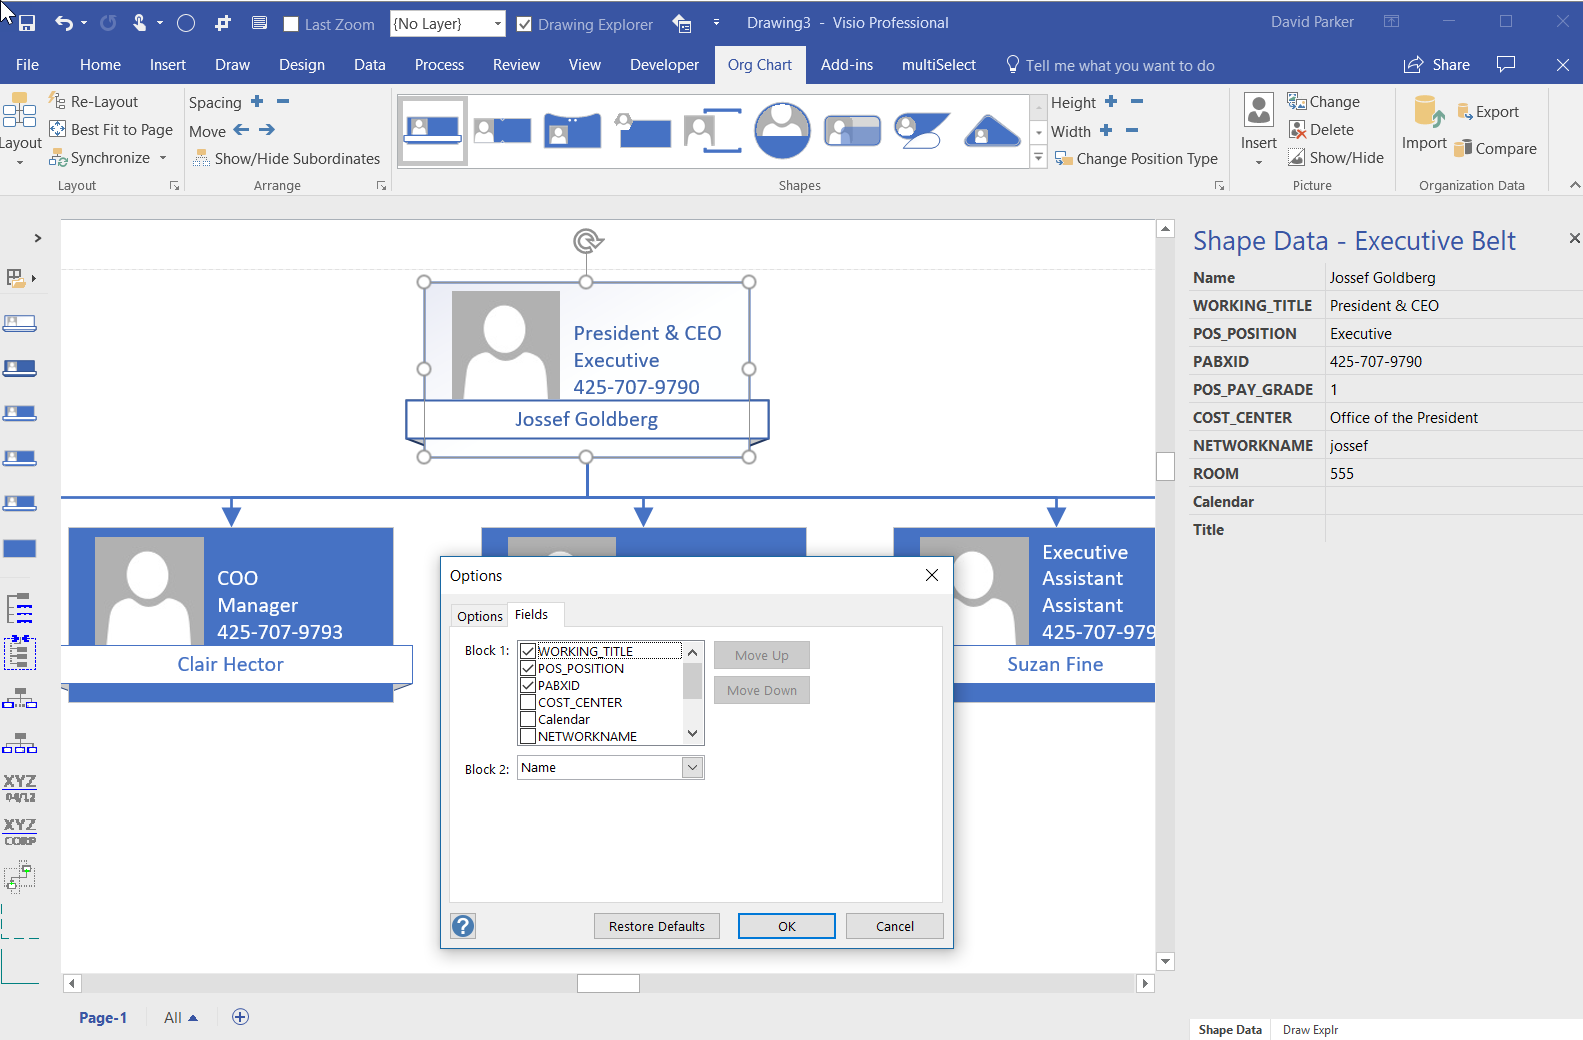
The Organization Chart template opens with the Belts – Organization Chart Shapes stencil open by default, although the Master shapes used can be replaced with those on one of the other nine using the Org Chart / Shapes gallery:
- Belt
- Notch
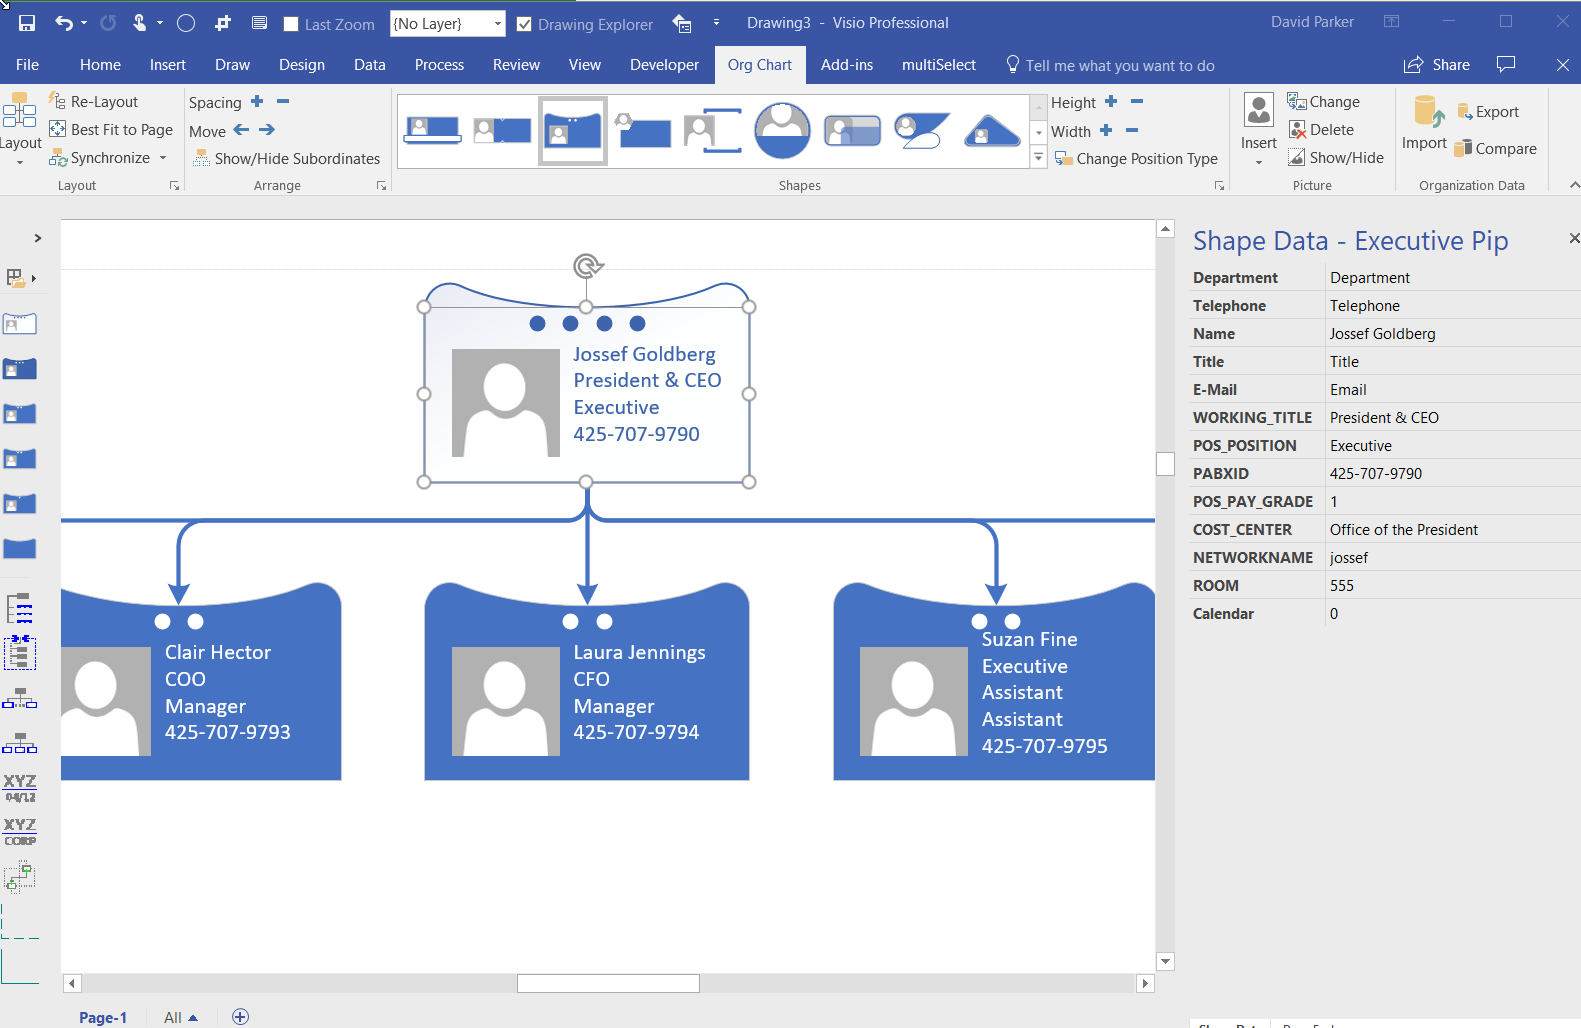
- Pip
- Shapetacular
- Bound
- Coin
- Panel
- Petals
- Stone
- Perspective
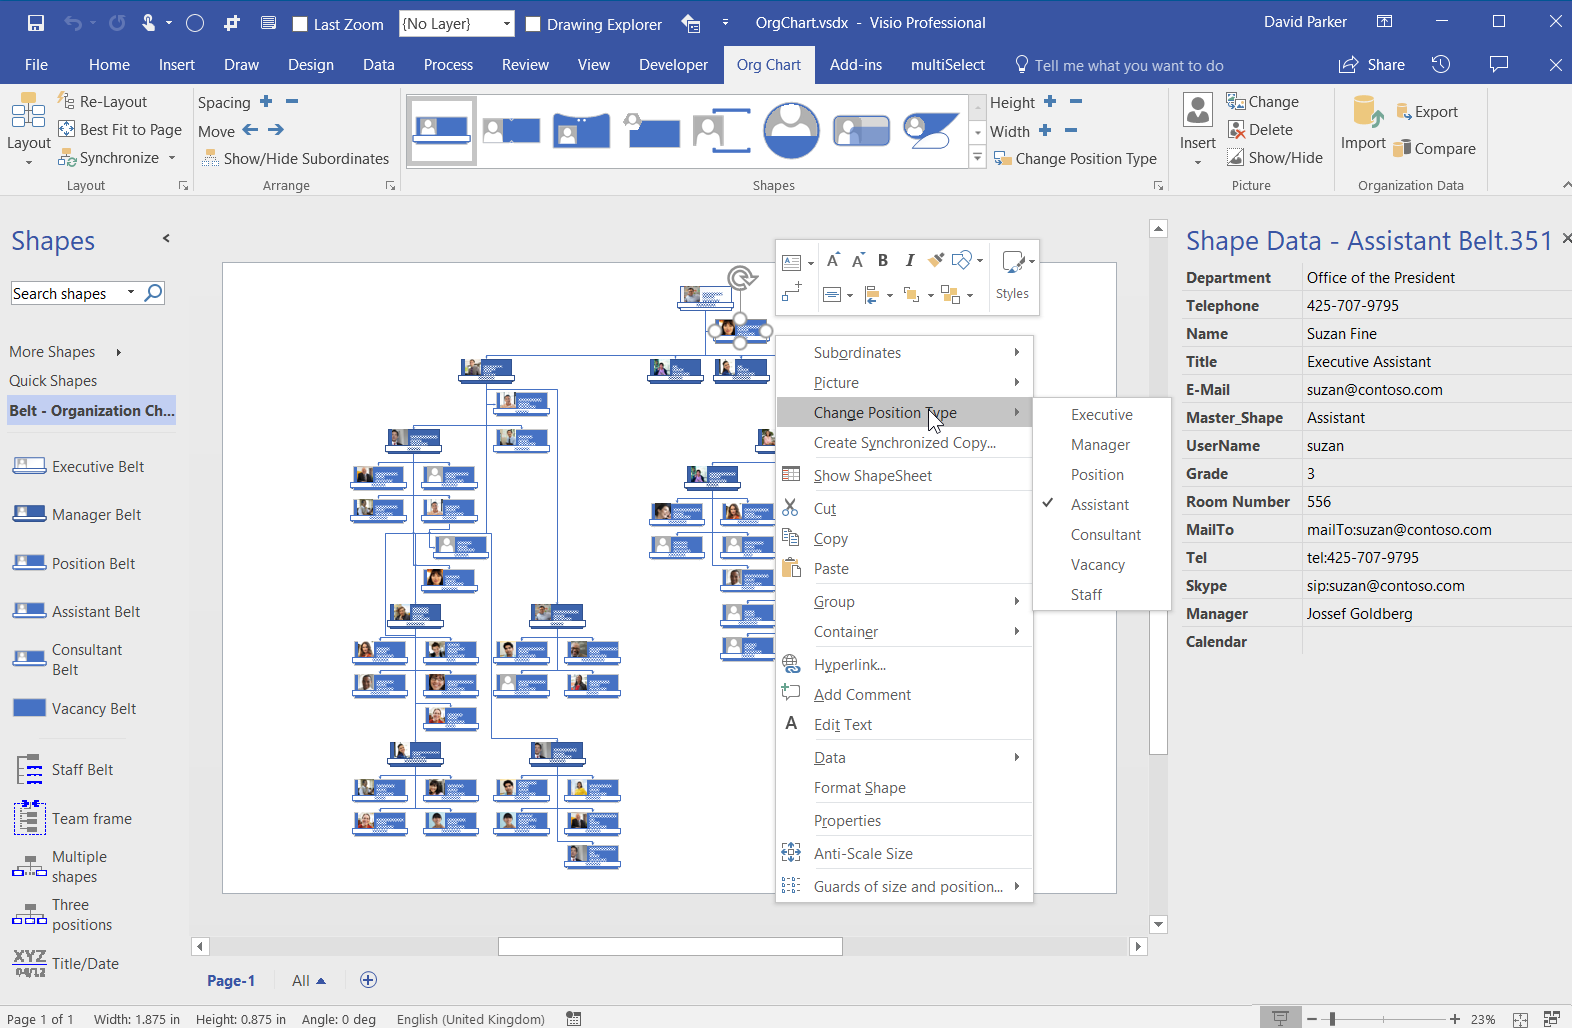
In addition to changing the style of shape, the Position Type for each shape can be any one of seven, either selected for an individual shape from its right mouse menu option Change Position Type, or for a number of selected shapes using the Org Chart / Shapes / Change Position Type button:
- Executive
- Manager
- Position
- Assistant
- Consultant
- Vacancy
- Staff
There is a separate master shape for each of these Position Type values, but in reality, they are all the same with a User.ShapeType value between 0 and 6. The Position Type applied by the wizard can be set by having a column called Master_Shape with one of the 7 values in it. This will automatically change the appearance of each shape to suit, and even the layout location, as in the case of Assistant which will layout differently to the others. The User.ShapeType values are:
- 0 [Executive]
- 1 [Manager]
- 2 [Position]
- 3 [Consultant]
- 4 [Vacancy]
- 5 [Assistant]
- 6 [Staff]
There are some acceptable alternative column names for Master_Shape and other columns, such as Reports_To which can alternatively be named Manager , and will list those in a subsequent article.
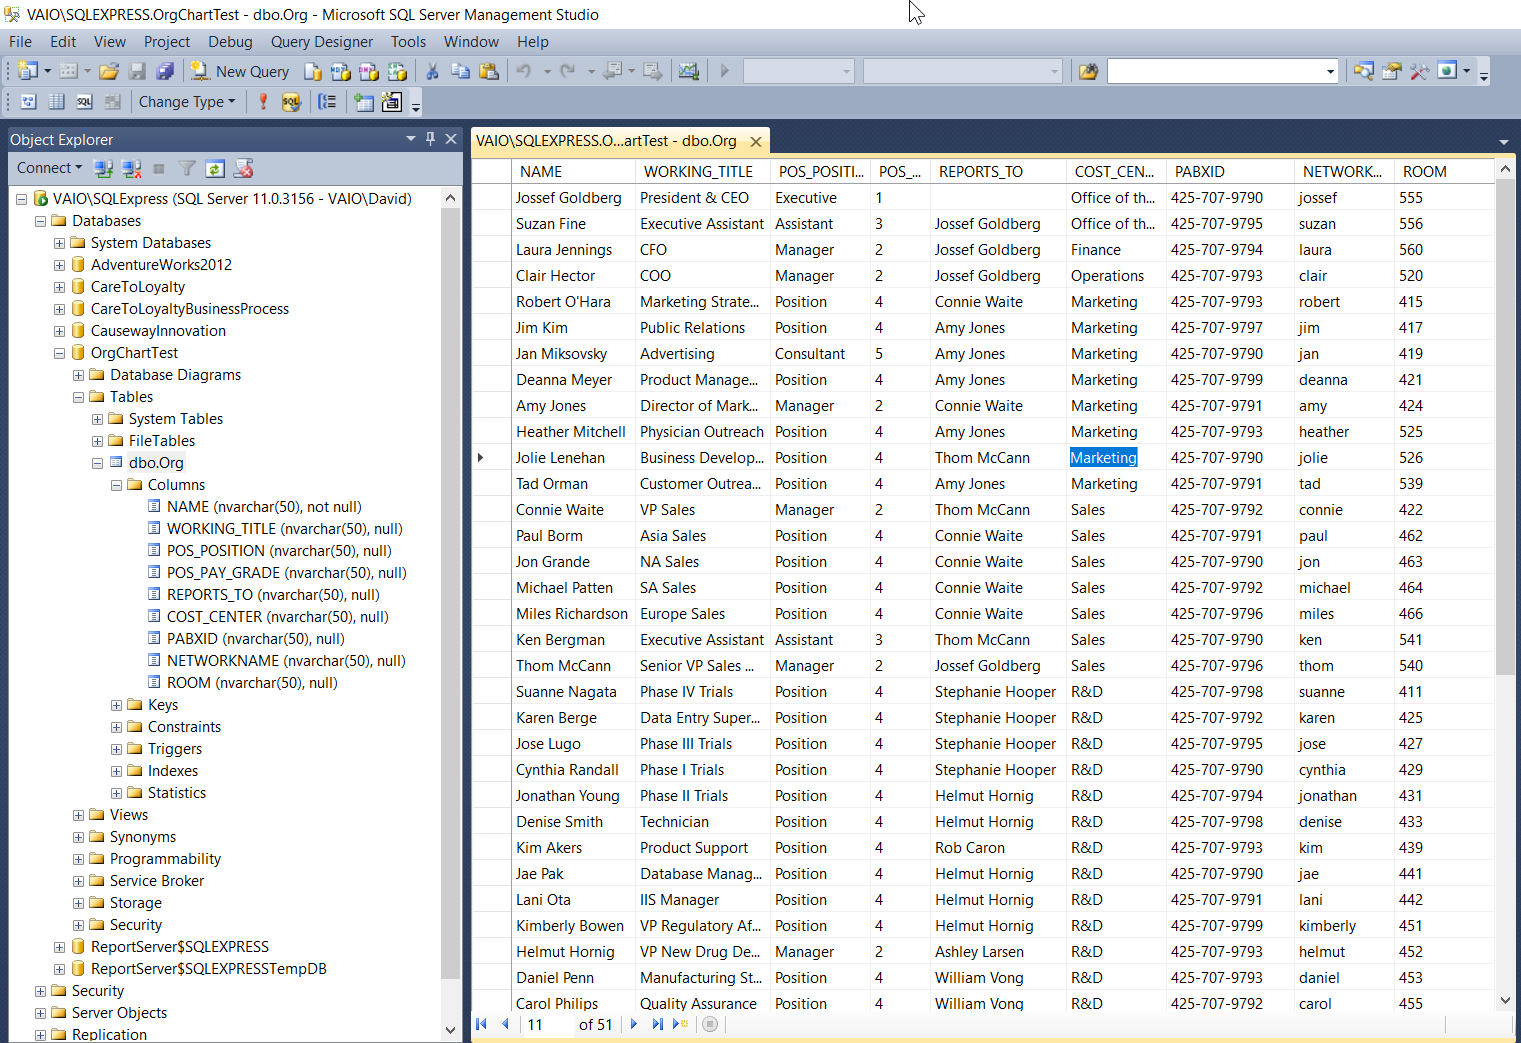
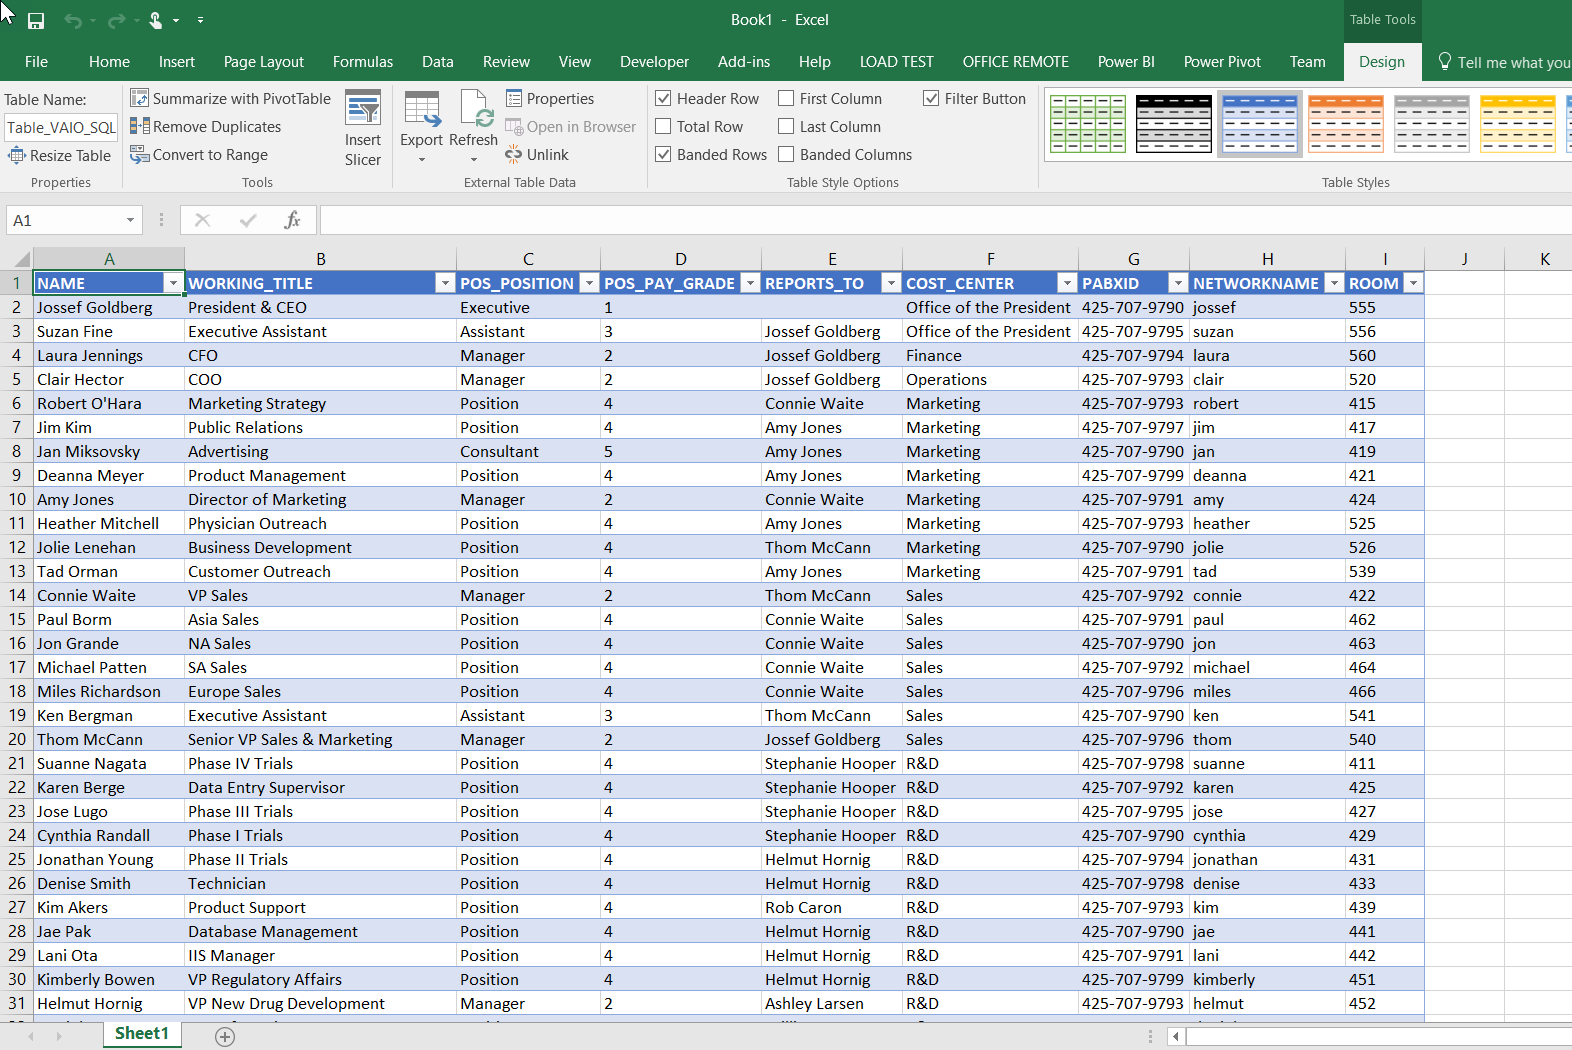
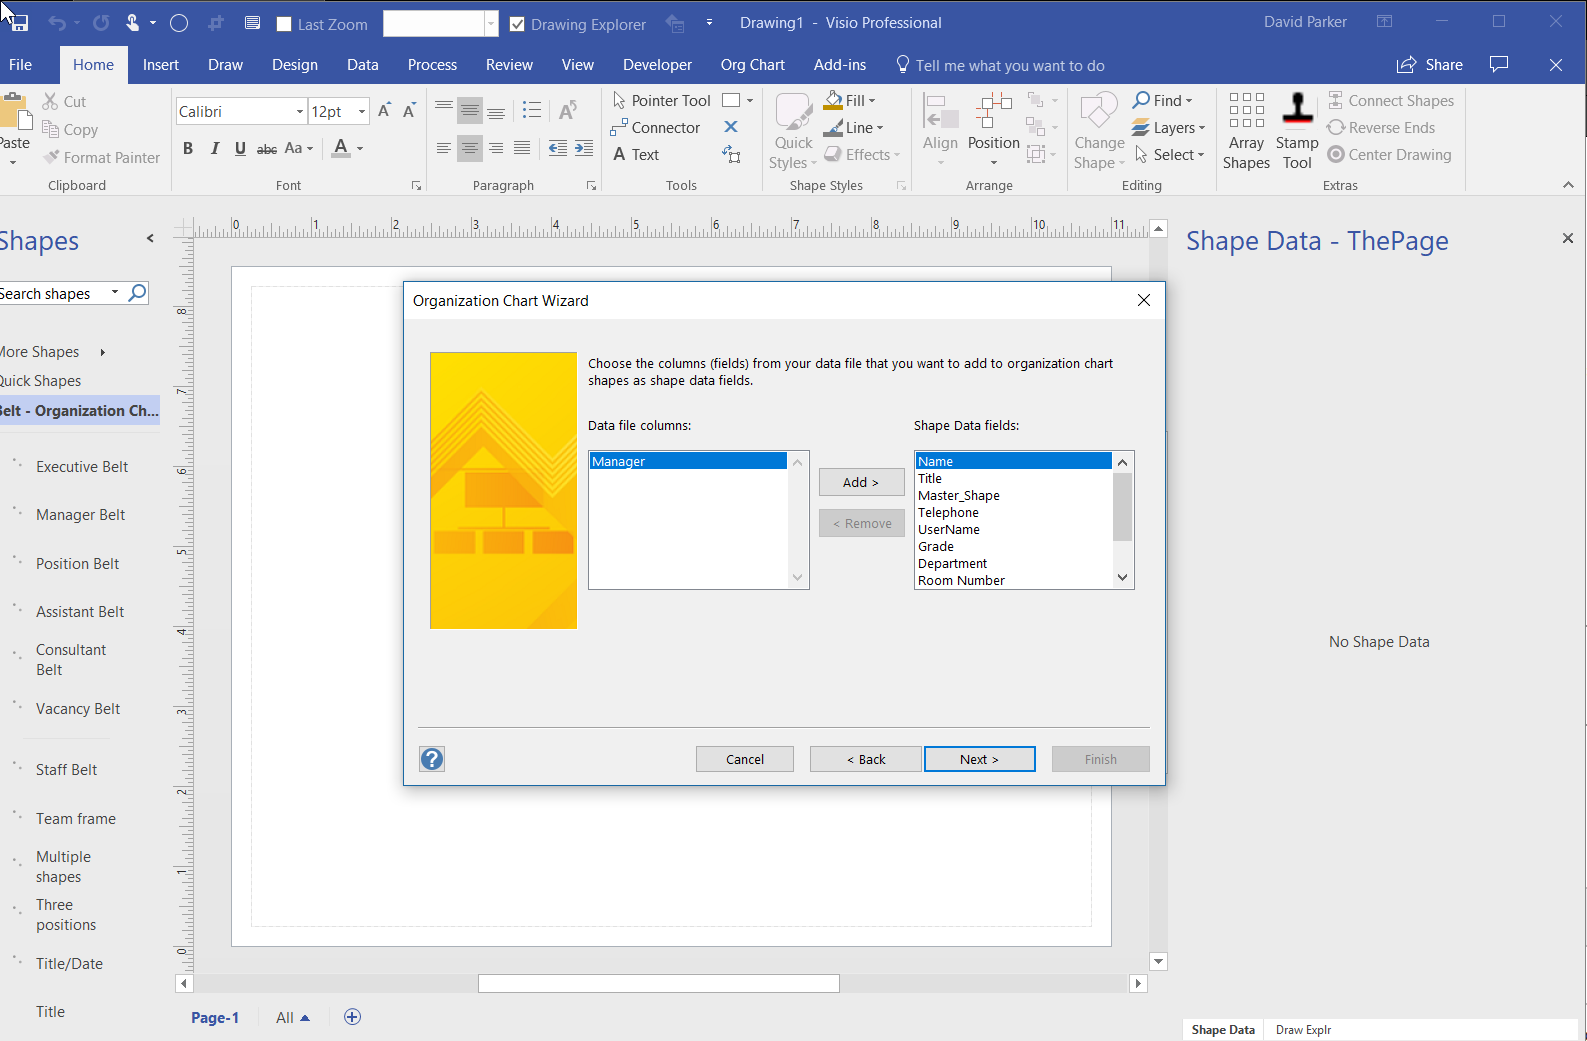
In this example, the original SQL Server table has column names that are uppercase and inappropriate for linking to the default Organization Chart shapes which have the default Shape Data rows:
- Department
- Telephone
- Name
- Title
This is subtly different to the Person shape on the Resources stencil which has the default Shape Data rows:
- Name
- Title
- Phone Number
- E-mail Alias
- Manager
- Department
Note to Microsoft : A little consistency would be a good thing!
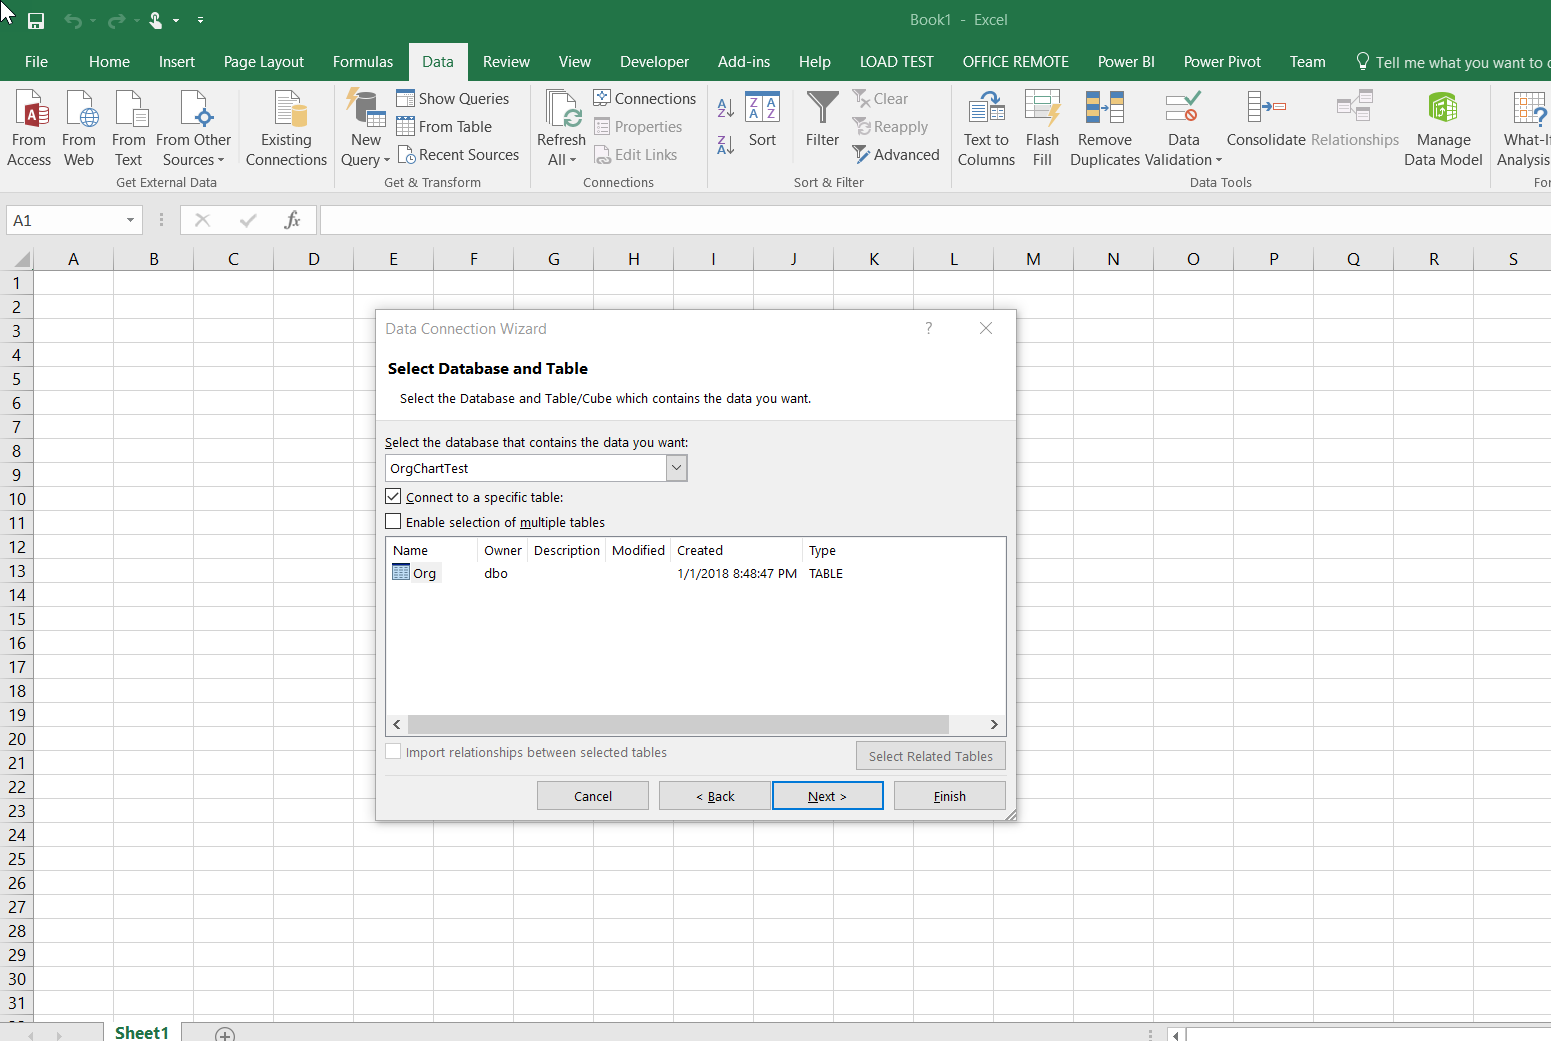
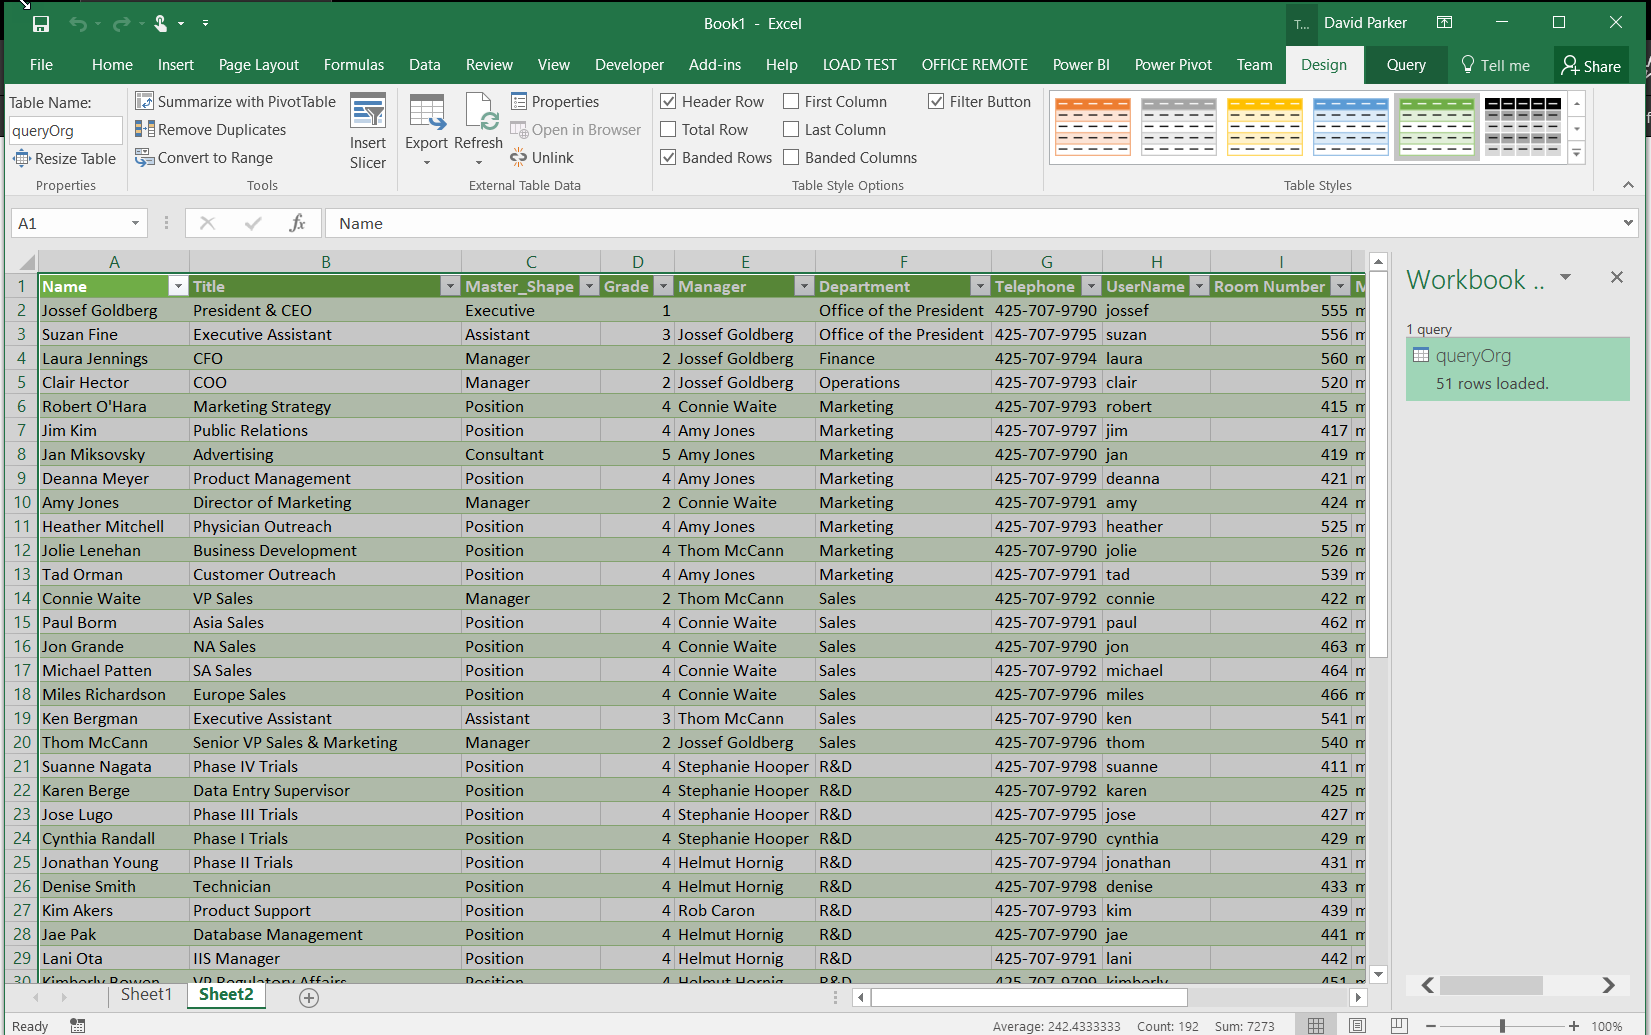
So, I linked the dbo.Org table into Excel in Sheet1 of a new workbook, and then created a New Query, queryOrg, on the table in Sheet2. I renamed the following columns:
- NAME > Name
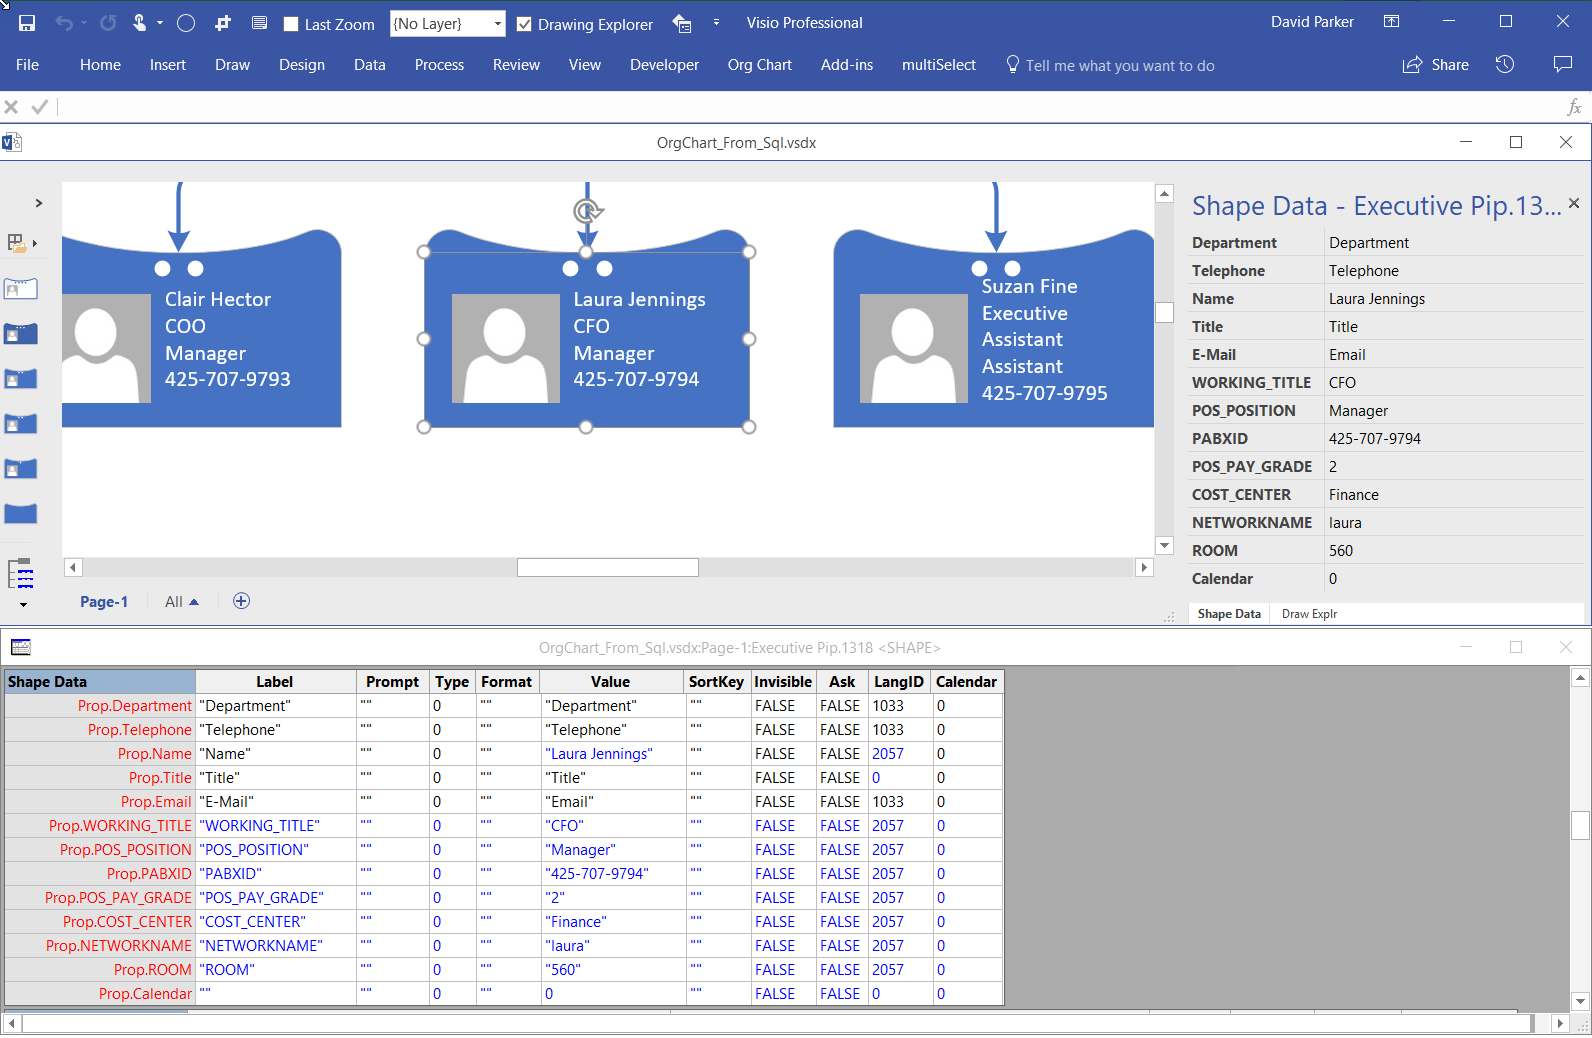
- WORKING_TITLE > Title
- POS_POSITION > Master_Shape
- POS_PAY_GRADE > Grade
- REPORTS_TO > Manager
- COST_CENTER > Department
- PABXID > Telephone
- NETWORKNAME > UserName
- ROOM > Room Number
I then added four calculated custom columns, as follows:
- E-Mail = Text.Combine({[UserName],”@contoso.com”})
- MailTo = Text.Combine({“mailTo:”,[UserName],”@contoso.com”})
- Tel = Text.Combine({“tel:”,[Telephone]})
- Skype = Text.Combine({“im:<sip:”,[UserName],”@contoso.com”,”>”})
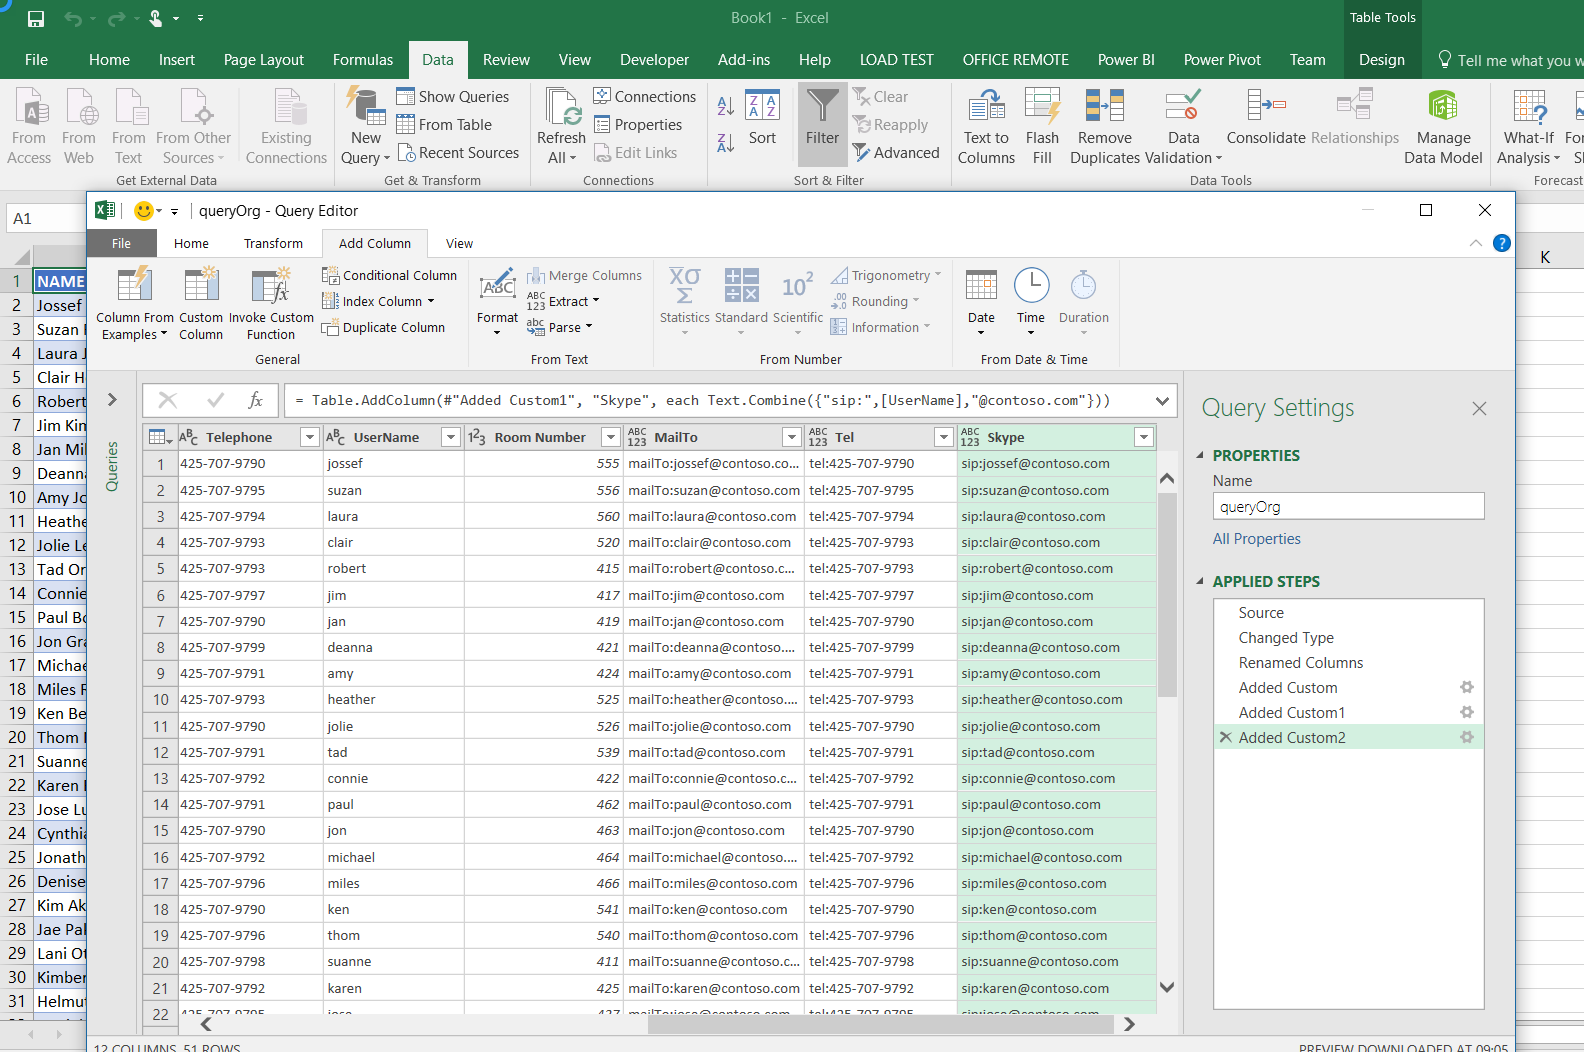
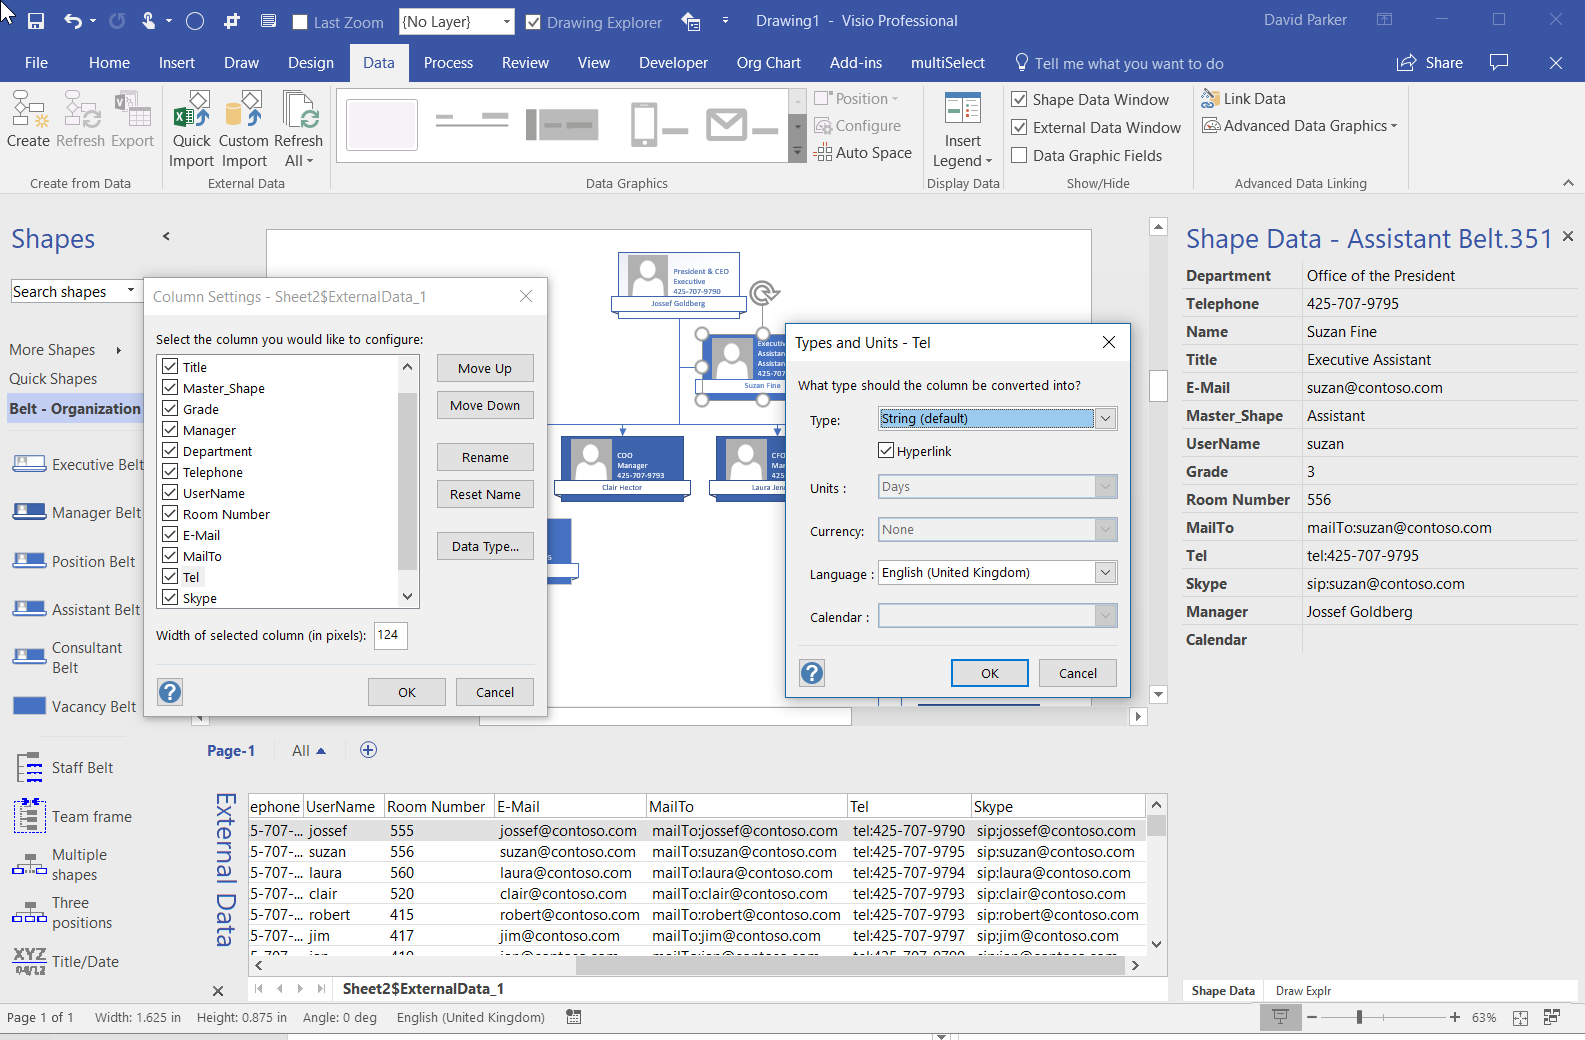
I added the MailTo, Tel and Skype columns to demonstrate how hyperlinks can be automatically added to shapes using Data \ External Data \ Custom Import, although the OrgChWiz can add a single hyperlink automatically too, but this requires a registry hack. The MailTo hyperlink column can also be used in PowerBI, but the others cannot.
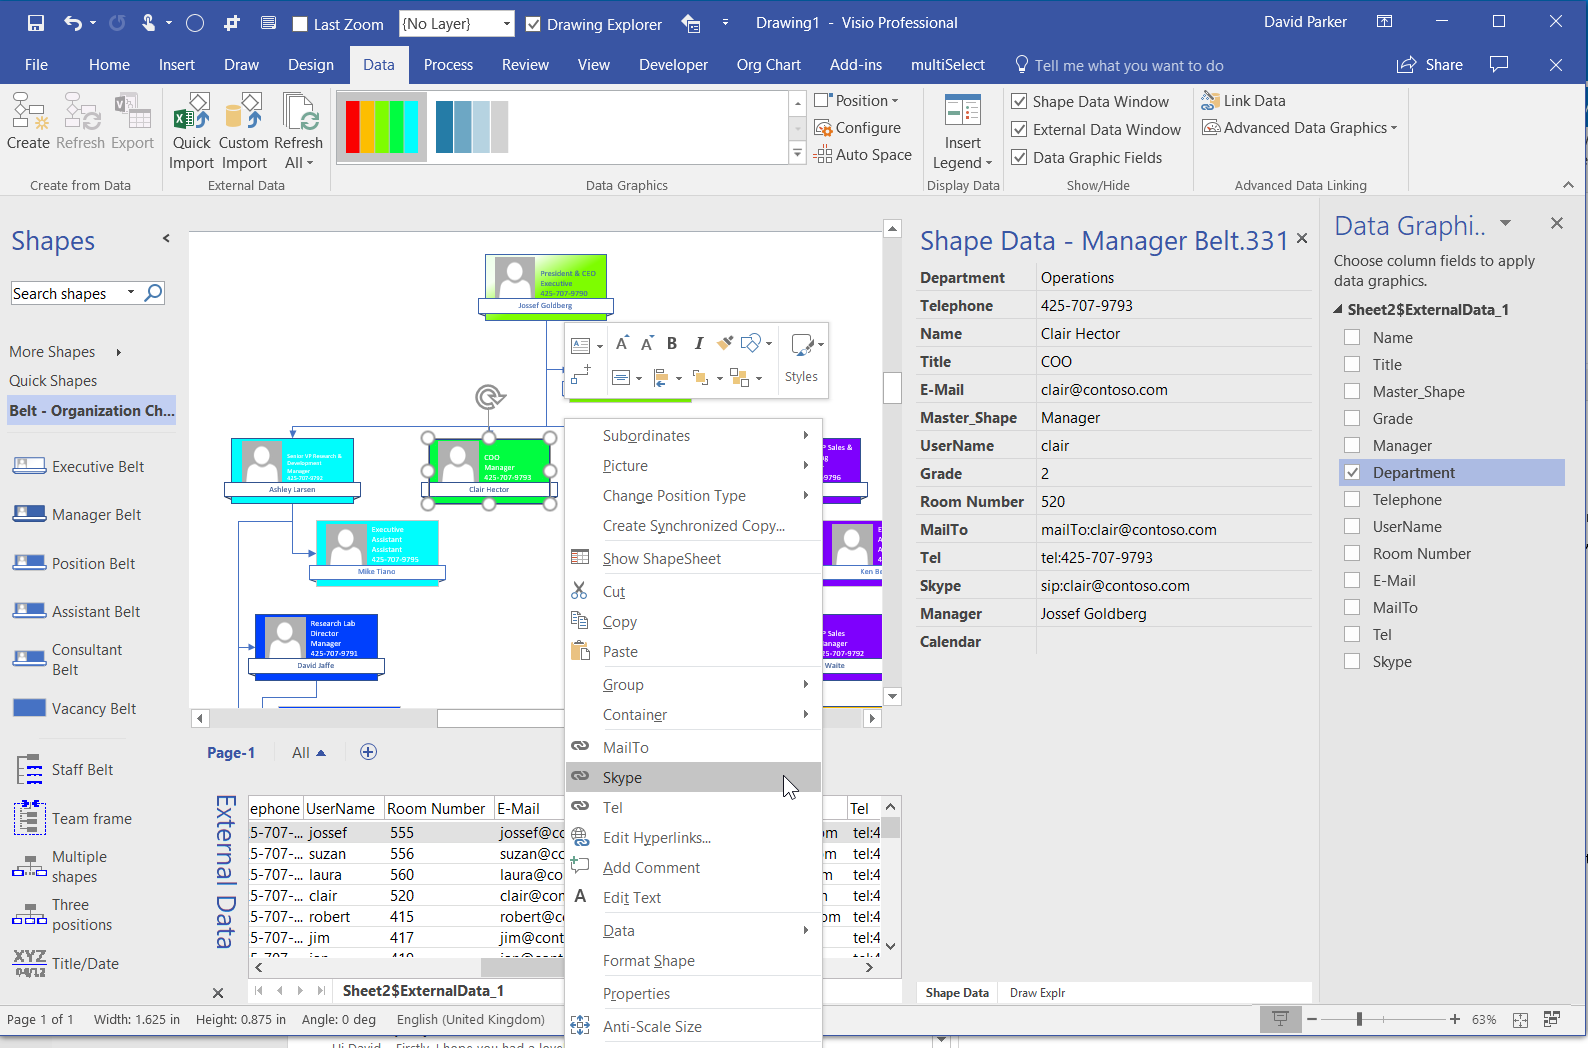
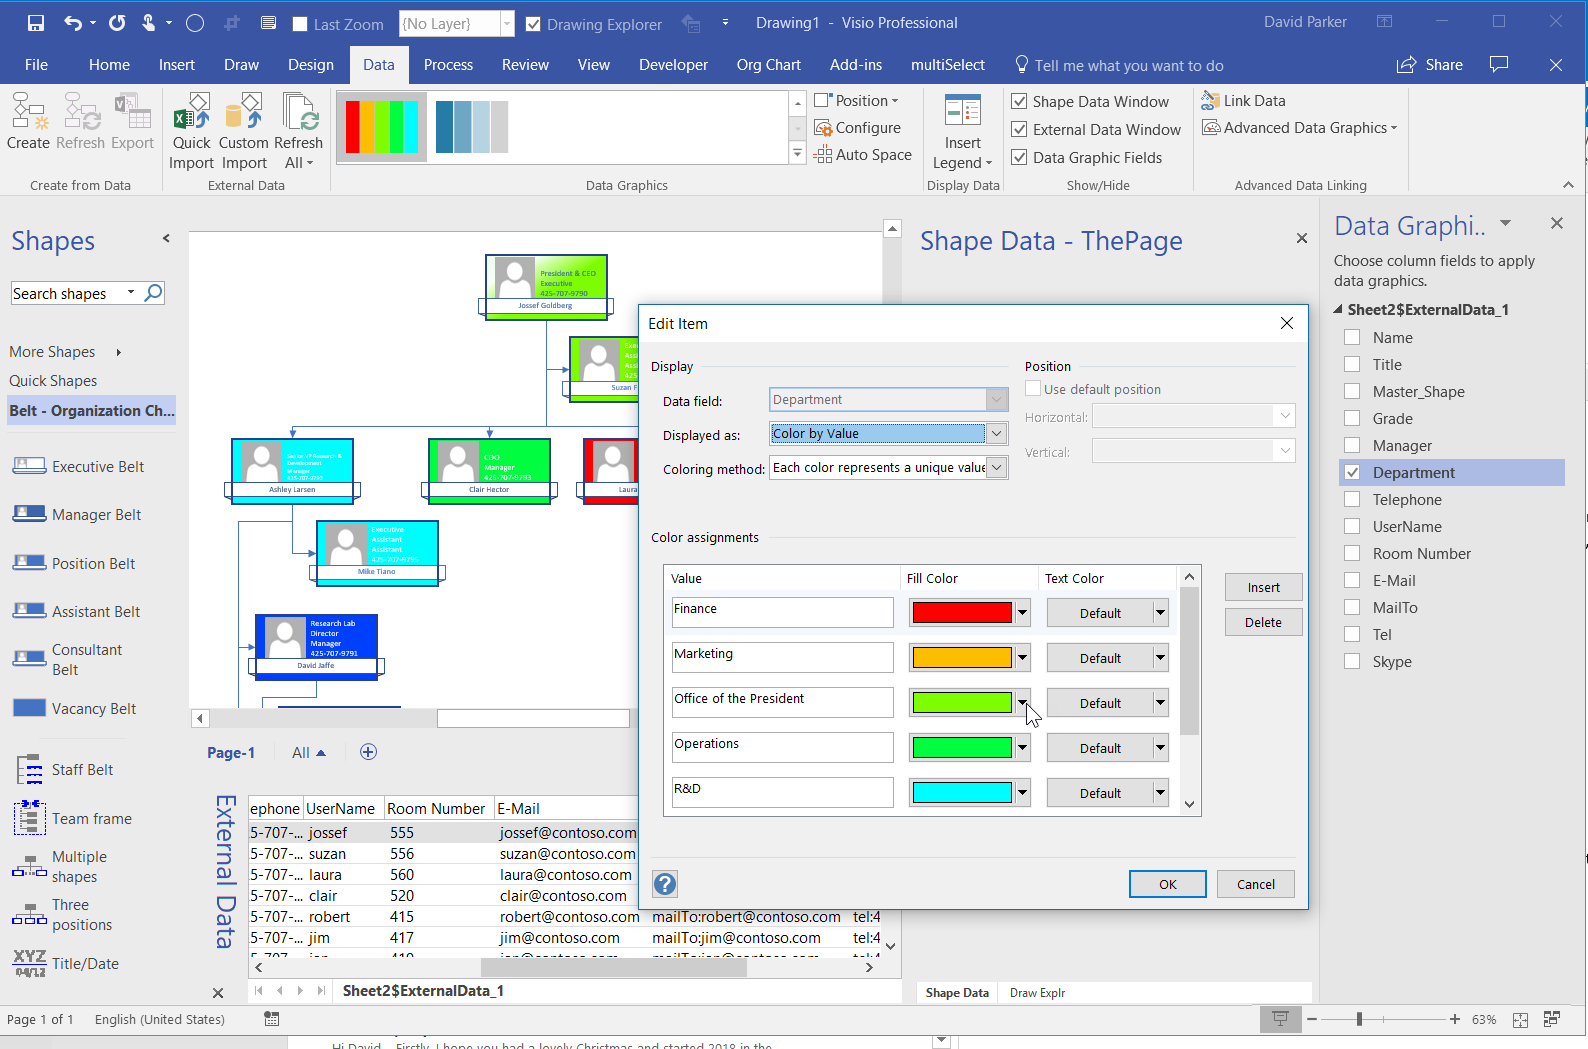
This organization diagram can now be enhanced by using Data \ External Data \ Custom Import to link the rows from the same Excel workbook query. This can be used to add Data Graphics, such as Color By Value for the Department, although any extra Icon Sets, Text Callouts or Data Bars can interfere with routing the connectors between each shape. Additionally, the hyperlinks can be automatically created if the required String type columns are ticked as Hyperlinks.
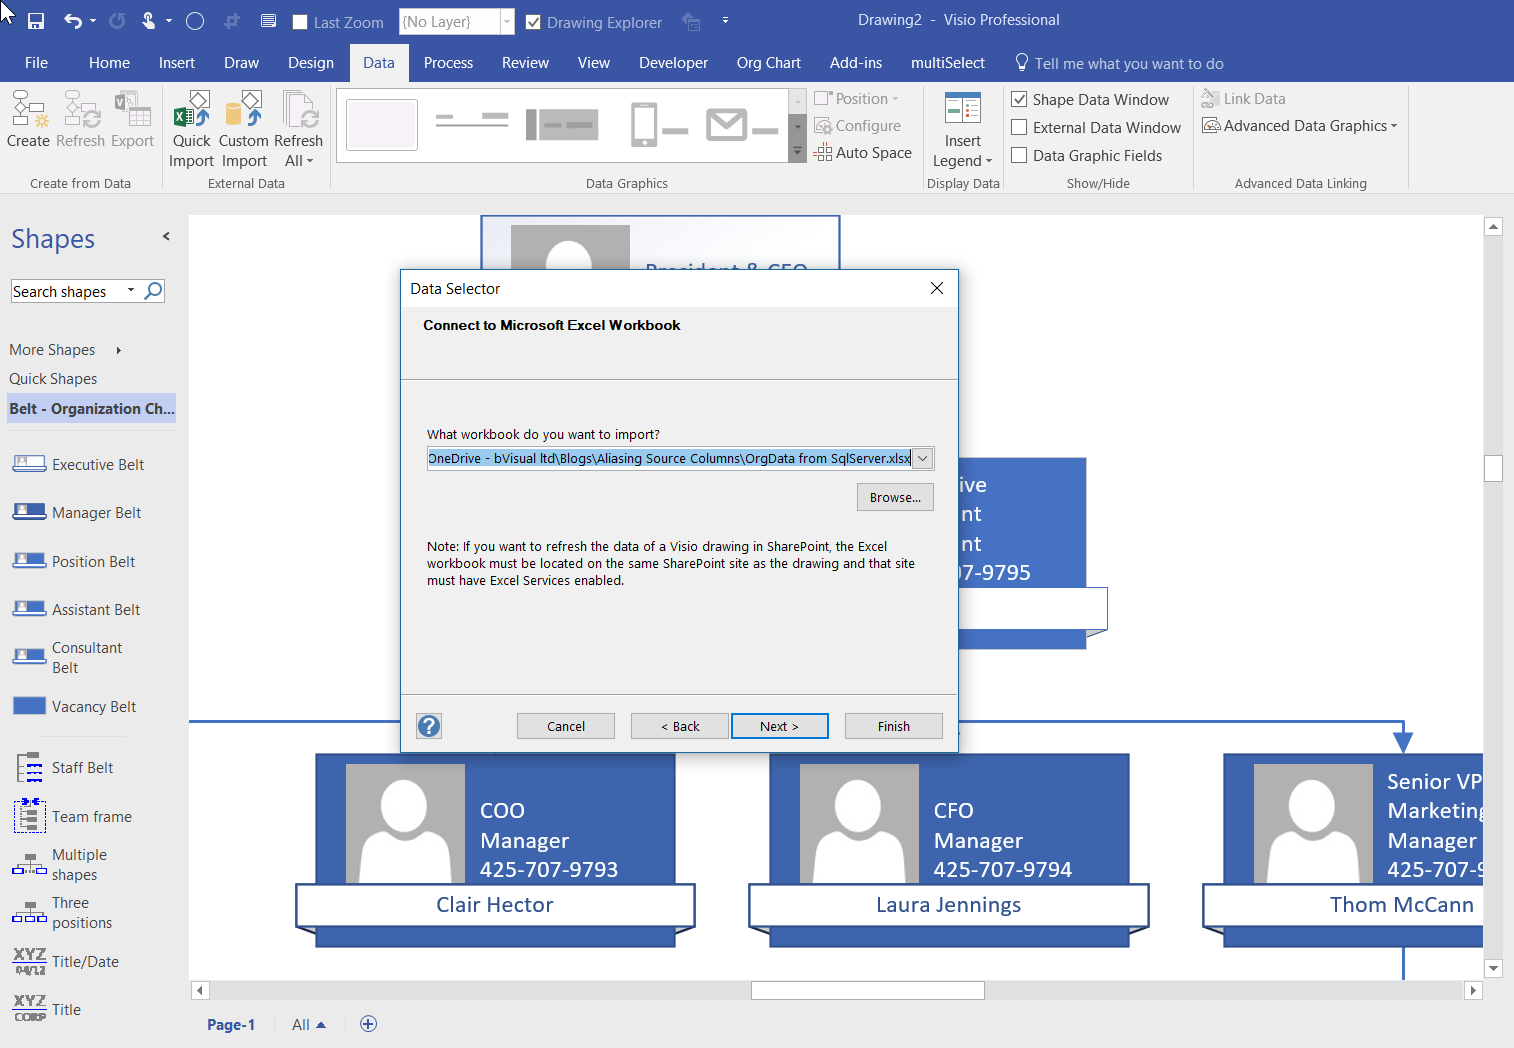
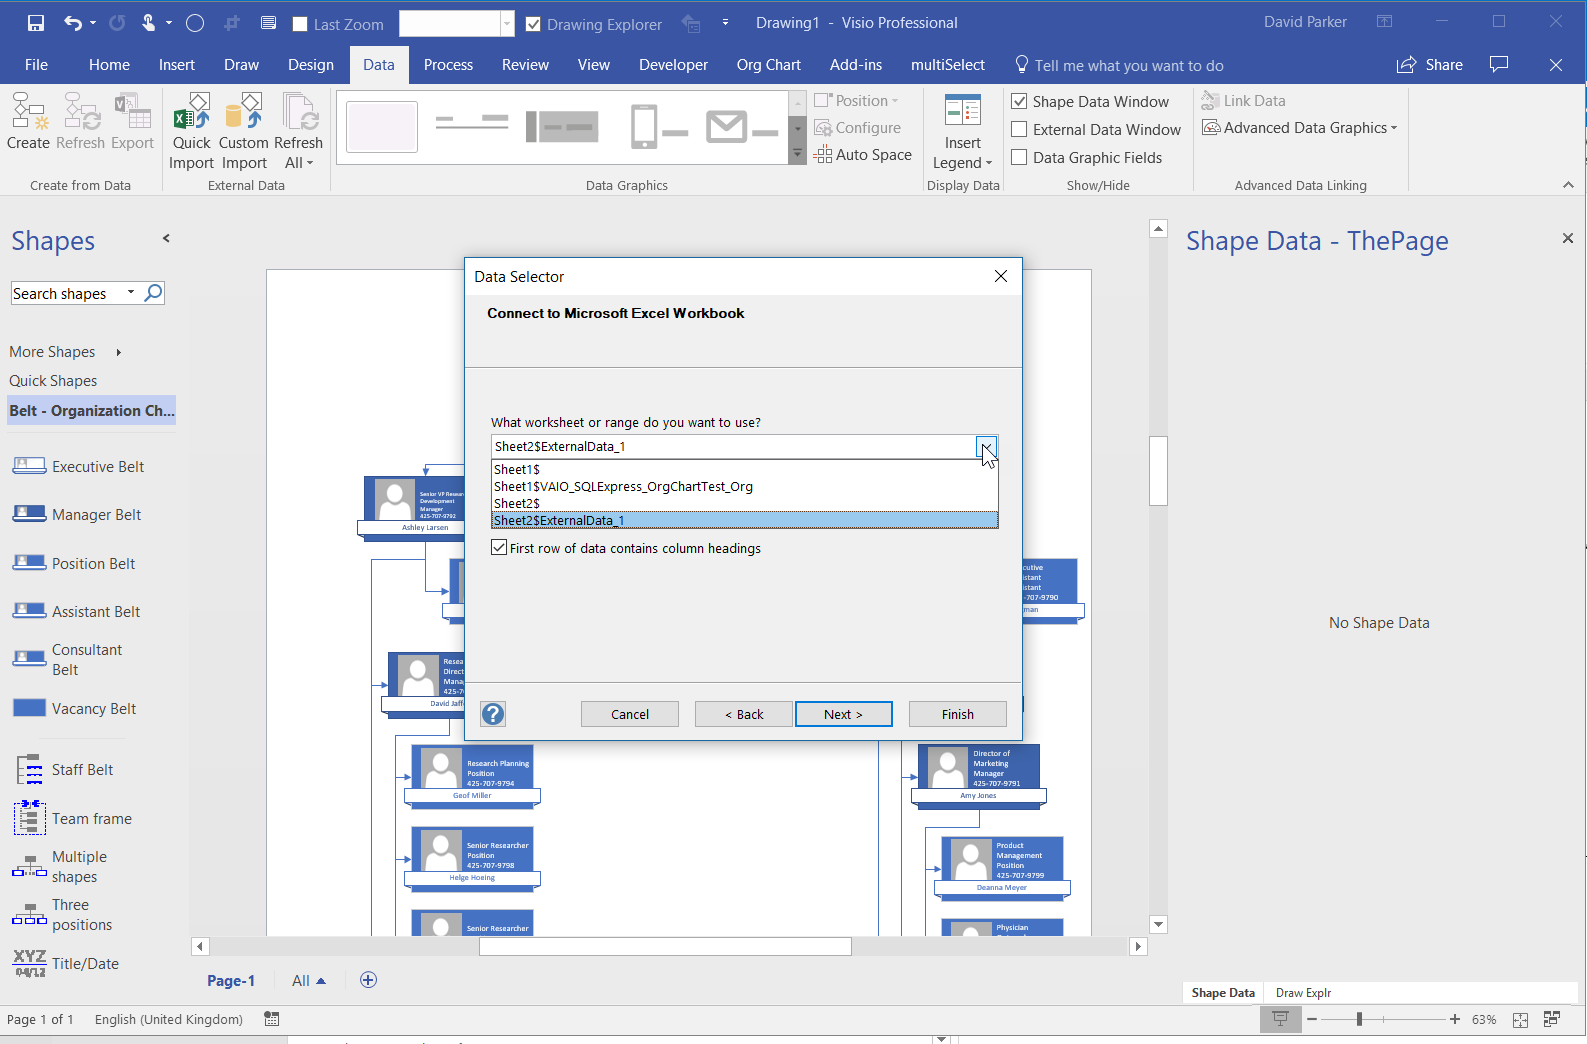
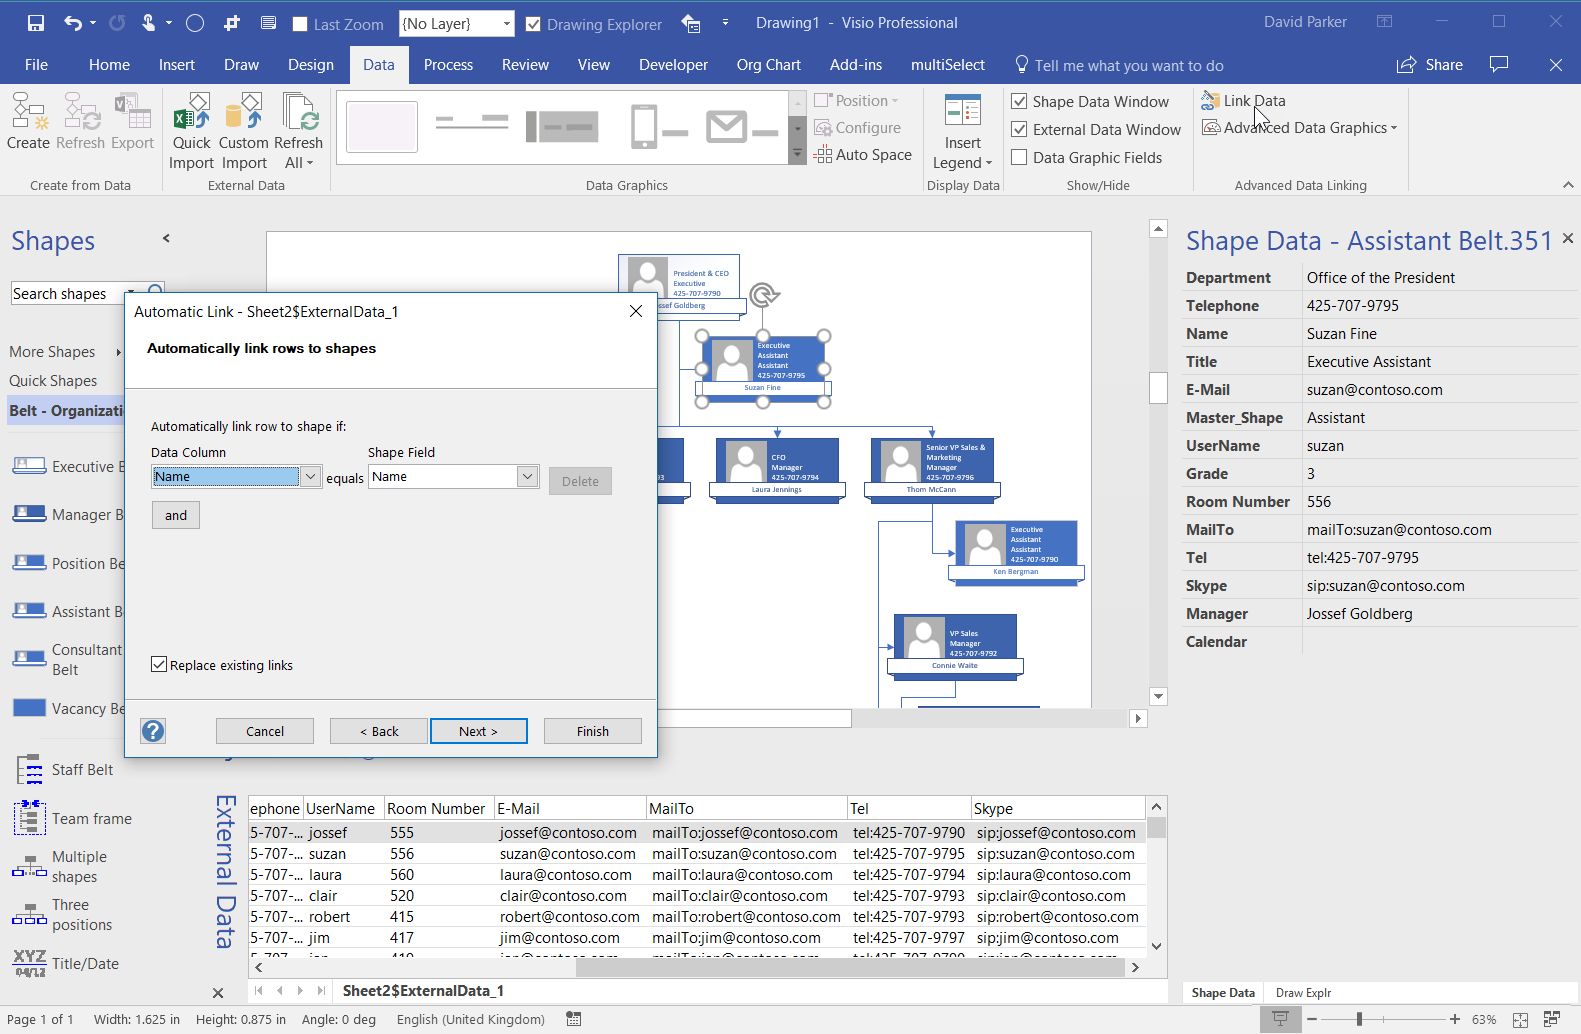
It is slightly disappointing to see that the Data Selector in Visio only lists the ranges, and not the Excel Names, thus the queryOrg Name is displayed as Sheet2!ExternalData_1 in the drop down list for the workbook, but I could link all my Org Chart shapes to the external data, and thus automatically add hyperlinks. This technique can also be used to update any of the other data too, but it will not cause a re-structuring of the hierarchy.
See Create a Visio organization chart for Microsoft help.
Related articles:
Visio Org Charts with Multiple Languages
Creating a Custom Org Chart Template with Extra Properties
Creating an Org Chart without the Org Chart Wizard
Three short Visio 2016 video tutorials
Visio Shape Data Linking Tips
I cannot figure out how to do this with a sharepoint list data connection, all of the data shapes end up outside of the shape as extra data, not inside the shape. If you have any support on this, that would be magic.
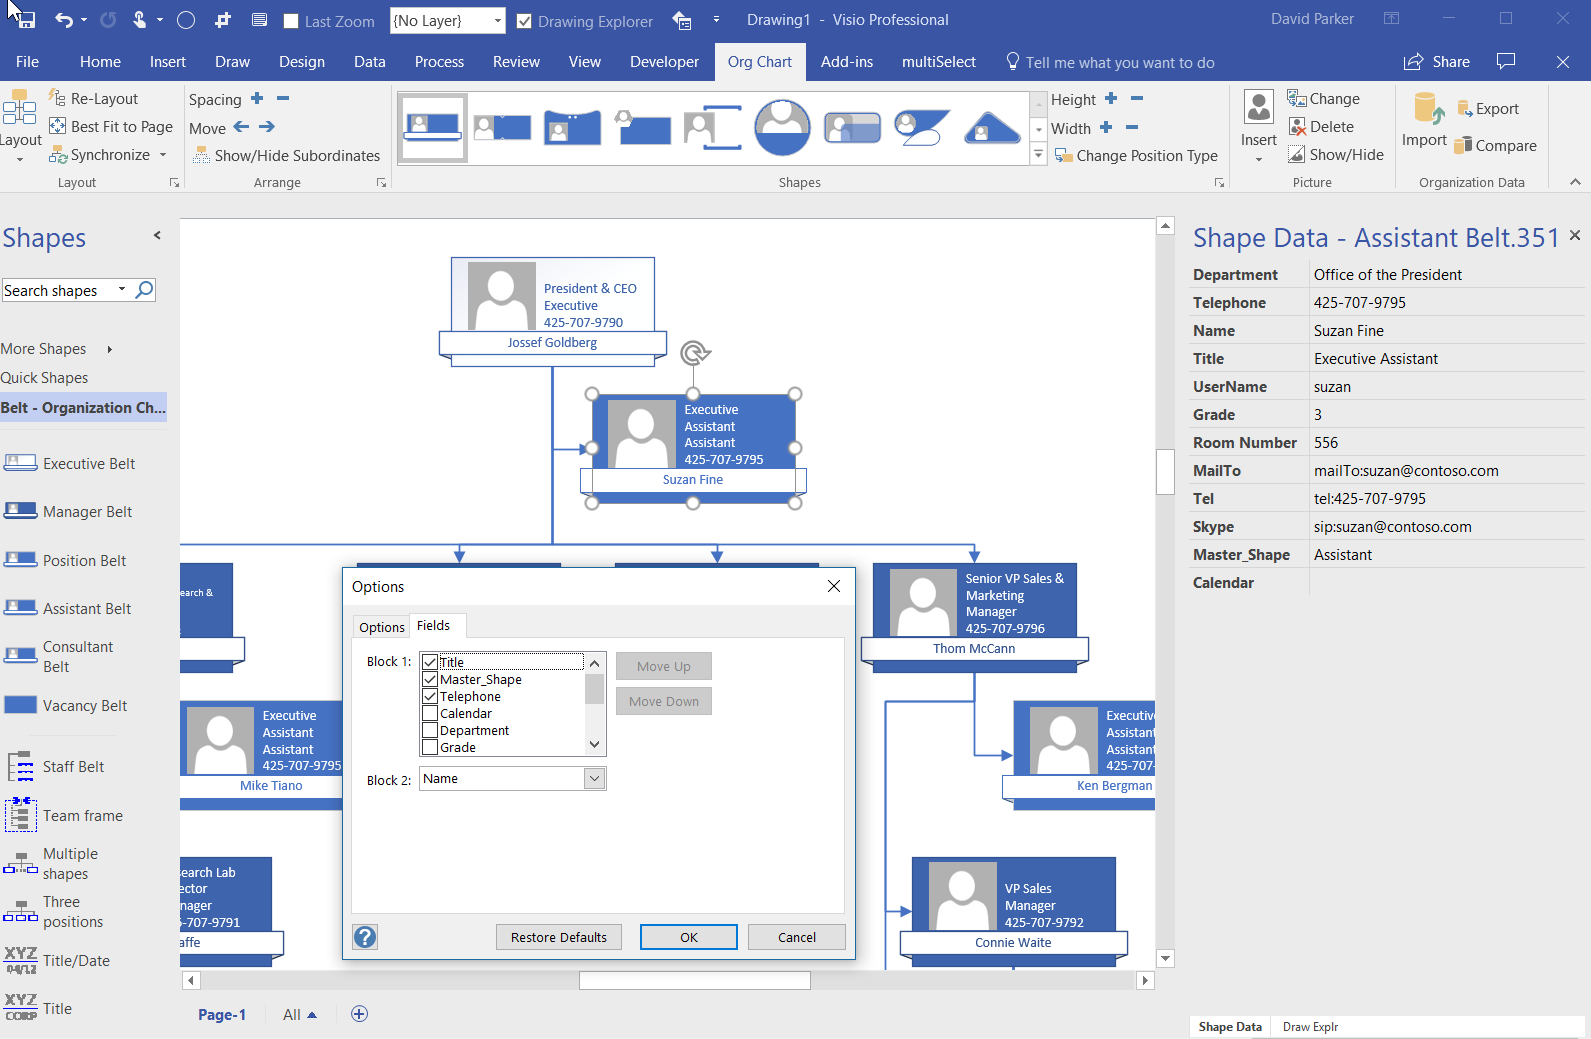
Are you using Data Graphics with the built-in Org Chart shapes? If so, try using the Fields tab on the Options button that can be opened from the Org Chart / Shapes ribbon group (it is the small square button in the bottom right of that group)
Hey David, I have a question/anomaly for you. I’ve created my org charts in Visio 2010 via the Wizard, importing from an excel file, and at first everything is great. I then linked the Data to Shapes, linking to the excel file, and then set to automatically link. Everything appears to work at first, but I come across a recurring anomaly: when I update information in the excel file and then refresh the Visio file, the information in the shape data is correct, but the actual shape DUPLICATES the changes. If I remove an entry on excel, the shape data shows it removed, but it remains on the actual shape, and will again duplicate all the data from that cell.
Ryan,
I am ot sure that I am understanding completely, but if you want to mail me an example, I will take a look at it.
However, do you have the Configure Refresh / Options / Overwrite user changes to data checked? And what is the Unique Identifier for your data?
I discovered the culprit, but not the solution. The problem child is CHAR(10), which is return/line break. In my excel data, I have a cell that contains multiple employees, and I wanted them listed on a separate line each in Visio. Both entering via alt+enter in excel, or combining via textjoin(CHAR(10) produced the same anomaly in Visio in that if you changed any data for that cell, Visio would just duplicate the data (exponentially for each subsequent change). I easily reproduced this many times in trying to find a solution, simply creating a very basic org chart in excel and use alt+enter to enter multiple lines in one cell, use the sheet in Visio and link the shapes and set to automatically link, then alter any of the data in the aforementioned excel cell. For what it is worth, any/all other characters seem fine and don’t cause the issue. I found a workaround using textjoin(” “, which introduced 10 spaces between each entry (rather than a simple return). This allowed Visio to (usually) put each entry on a separate line in the shape if I sized it properly.
Even though I’ve found a workaround, I would like someone else to experience this anomaly and see if they can find a solution to make a carriage return work in the data. To see the Shape Data have exactly what it should be, but the actual shape to have multiple duplicates of everything is very…interesting (frustrating).