I like linking data to shapes in Visio. It saves time in filling in Shape Data and adding text, or any Data Graphic to them. Basically I am lazy, and I also like to create macros for repetitive tasks, so in this blog I provide two macros to save the drudgery of two tasks I do so often:
- Dropping and data linking a number of items from an External Data recordset filtered by values in a column or columns
- Connecting shapes together following a parent-child relationship between Shape Data values
I have provided these two macros in the stencil which can be downloaded from at DataRecordset Utils.vssm, and as usual, I recommend putting the file into you My Shapes folder so that it can be opened easily, just like any stencil.
Dropping and data linking shapes filtered by column values
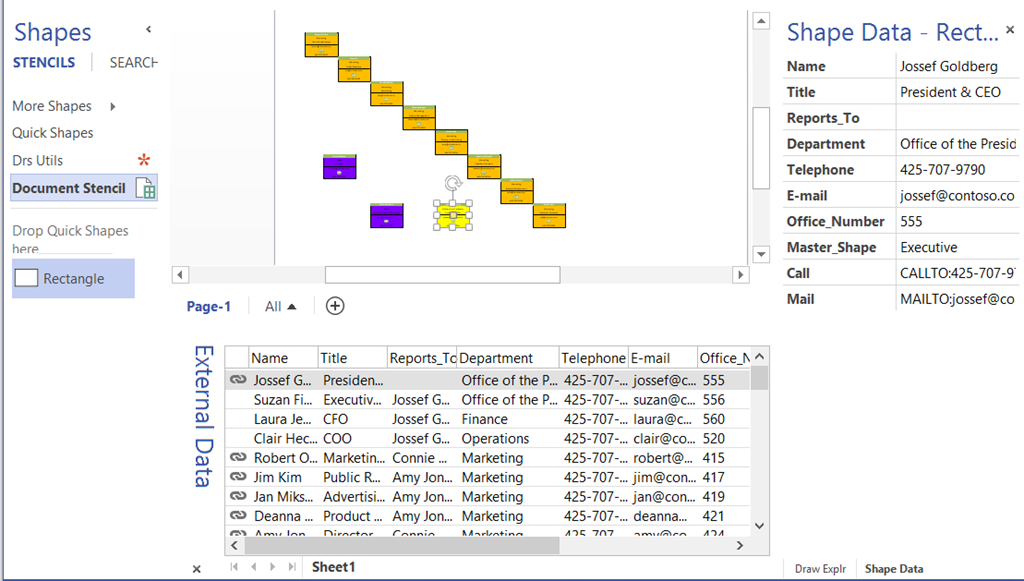
First of all, I use the OrgData.xls file (with two extra columns) that auto-generate hyperlinks provided with Visio as an example data source.
Secondly, I just dragged an dropped one row onto the page because this auto-creates a master called Rectangle.
Thirdly, I created some Data Graphics for this Shape Data, then deleted the shape.
These steps are only necessary for my example, but you could have your own External Data, master and Data Graphics.
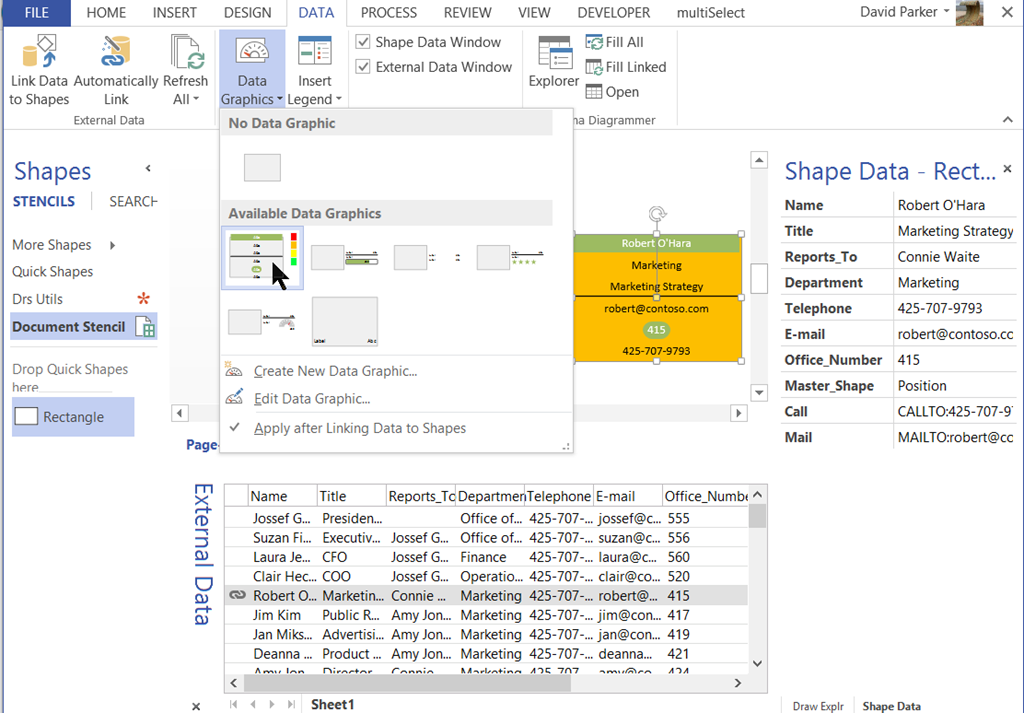
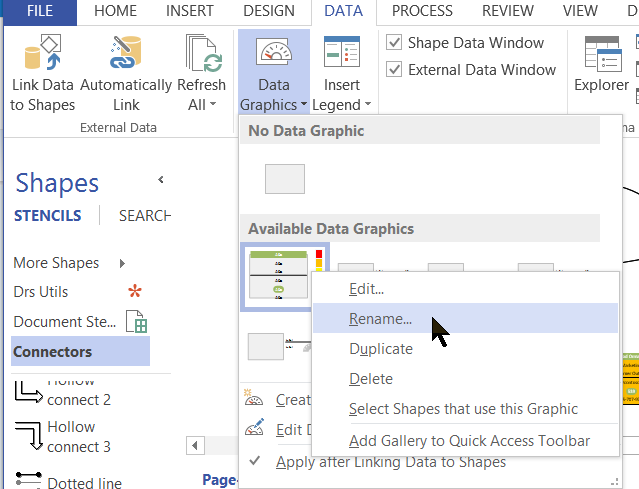
By the way, I can see the name of a Data Graphic in the tooltip of a Data Graphic icon in the DATA \ Data Graphic dropdown gallery, or I could change its name with the right mouse menu.
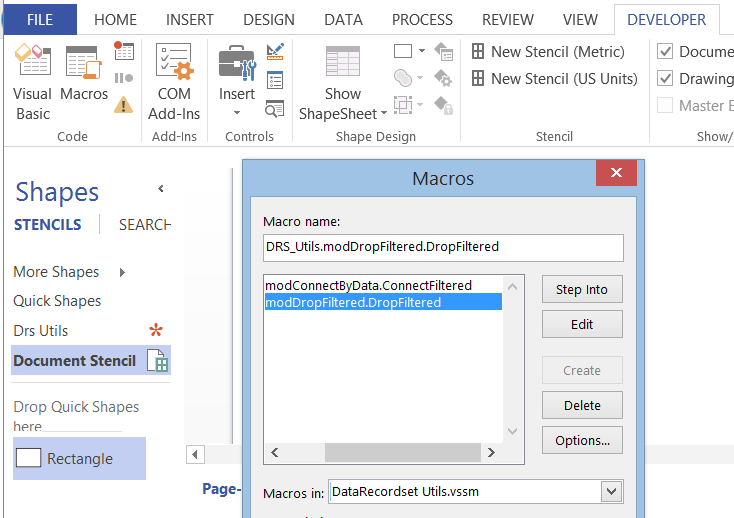
The macro-enabled stencil appears as Drs Utils in when opened, and does not contain any shapes.
So, the first macro, DropFiltered, can be run when a master is selected in a stencil, and a row is selected in the External Data window.
This macro will open a dialog in which I can select the column, or columns, that contain the values in the selected row that I wish to filter by.
It also allows me to optionally select a Data Graphic to be applied to each shape when it is dropped in the page.

The second column displays the data type where 0 is text and 2 is number.
When I press Select, the matching rows are used to drop an array of the selected master shapes, each one linked to each data row.
This saves time on selecting individual rows.
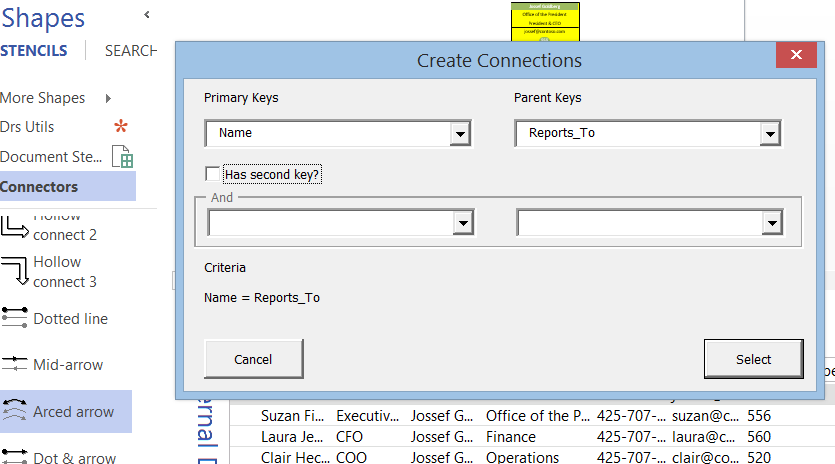
Connecting shapes together following a parent-child relationship between Shape Data values
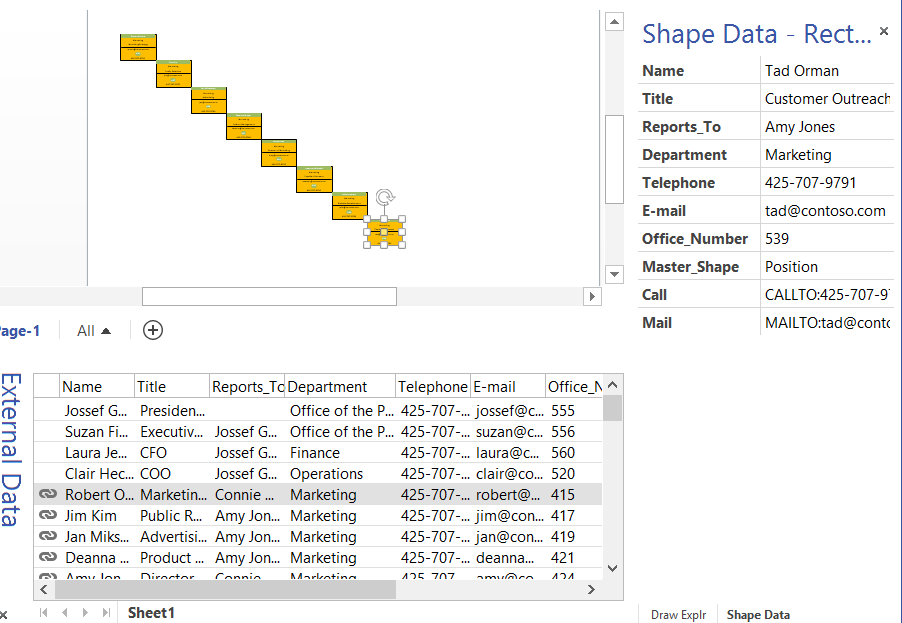
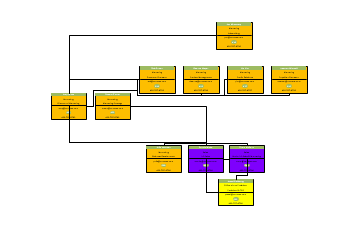
In noticed that the Marketing team reported to managers and directors that are not in the same Department, so I just found those three rows and dropped them into the page.
The next macro, ConnectFiltered, simply requires the Primary Key column, or columns, in the active External Data recordset to be specified, along with the column, or columns, that contains the values for the Parent Key. It also allows for optionally linking the connector shape to the data recordset row, and for applying a Data Graphic.
UPDATE : I have added the ability to optionally delete any existing connections on each shape – I found myself having to delete too often!
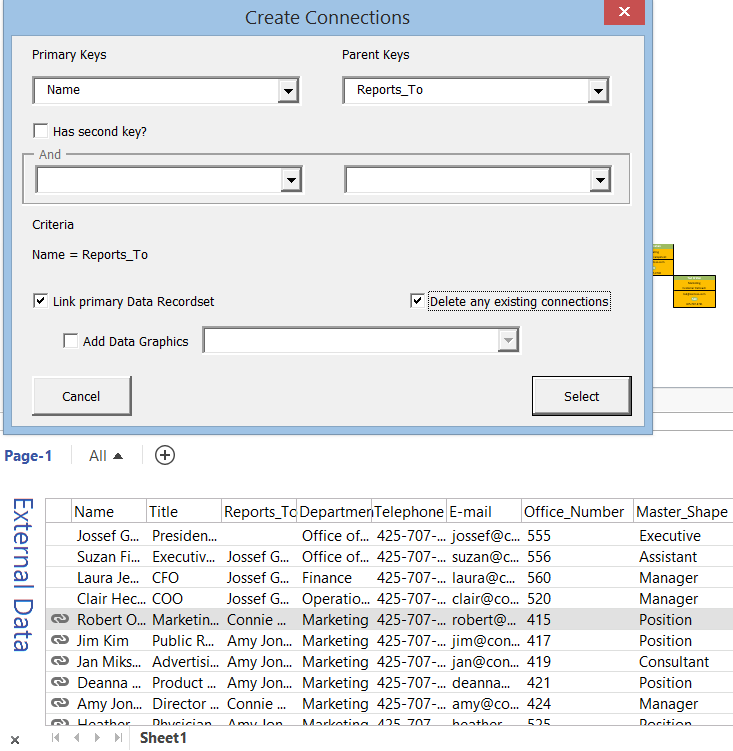
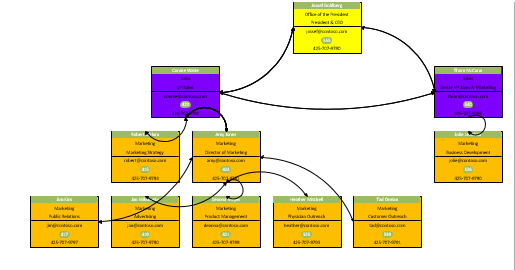
Then, when I click Select, the data values are followed to used to connect the data linked shapes on the page together using the Dynamic connector master shape.
I then used the DESIGN / Layout / Re-Layout Page gallery to choose a suitable style.
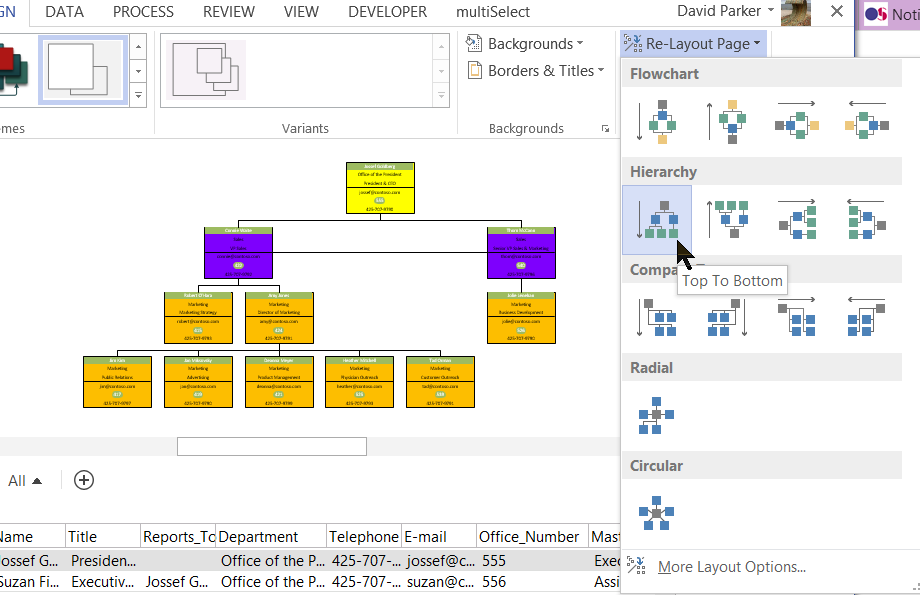
Alternatively, I could have selected a connector type (1D) shape in a stencil in order to use a specific master.
This give me flexibility to choose the appropriate style.
I hope this helps some users to create data-driven diagrams quicker, and replaces some of the functionality that Microsoft deprecated years ago when they cut-out the Flowchart and Network Diagram wizards….
Downloads
Visio 2013 and later : DataRecordetset Utils.vssm
Visio 2010 and earlier : DataRecordset Utils.vss
This stencil provides more generalised code for the action in a previous article : http://blog.bvisual.net/2009/02/24/creating-an-org-chart-without-the-org-chart-wizard/
Related Articles
Counting glued and connected shapes in Visio
I got a surprise in one of my projects when I counted the shapes glued together using the Shape.GluedShapes(…) method … the sum of the filtered glued shapes just didn’t add up to the unfiltered count. So, I thought I should check the Shape.ConnectedShapes(…) method too … and there is a scenario where that has…
Cyber Monday free Visio Checkers!
As it is Cyber Monday, I thought I would give away a compelling checkers board for Visio! In the UK, we call it Draughts, but the rules are the same… in my last post, I showed how to create a chess/checkers/draughts board, and in this one I add some checkers that can glue to the…
Update to multiSelect & tracing sub-shape connections in Visio
Most of my Visio diagrams have simple connections between shapes, and my previous post about connections used a flowchart as an example (see https://blog.bvisual.net/2016/08/09/understanding-visio-connections/ ). However, it has come to my attention that some Visio developers add connection points to sub-shapes of Visio group shapes, and then connect between the sub-shapes. This means that the…
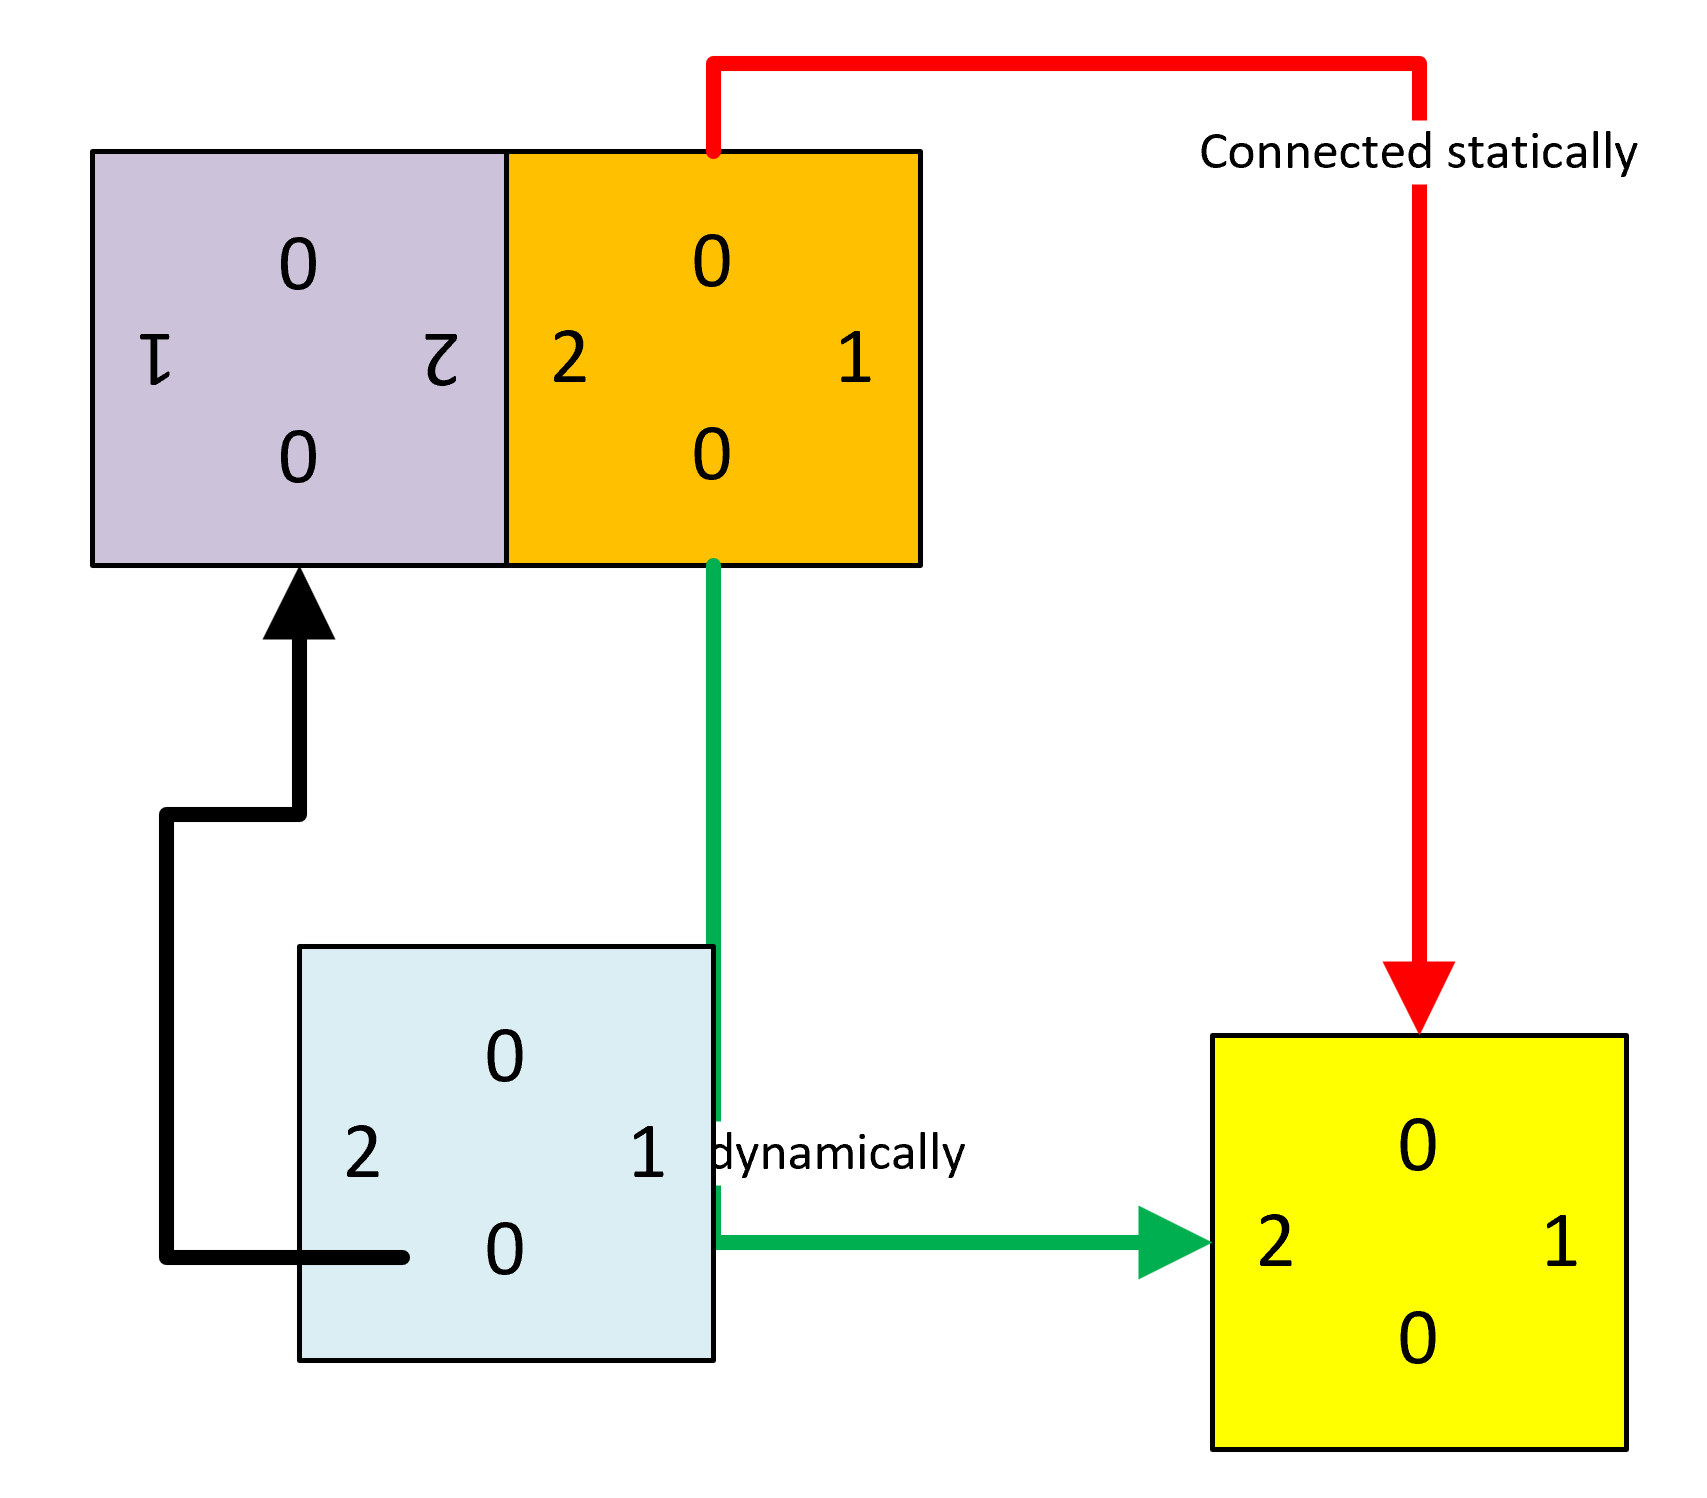
Understanding Visio Connections
A reader recently asked if I could explain how to programmatically get the shapes connected to a shape in Visio. So, I thought I would have a go, because there are alternatives, depending upon which functions are used, and what parameters are passed to them. The following animated gif is rotating around the different types…
Getting the Name of Glued Connection Points
A Visio developer asked me if it is possible to get the name of connection points that a connector is glued to in Visio. Well, it is not possible directly from the ShapeSheet, but is easy if you use a little code. First of all, I created a simple Block shape with 3 named connection…
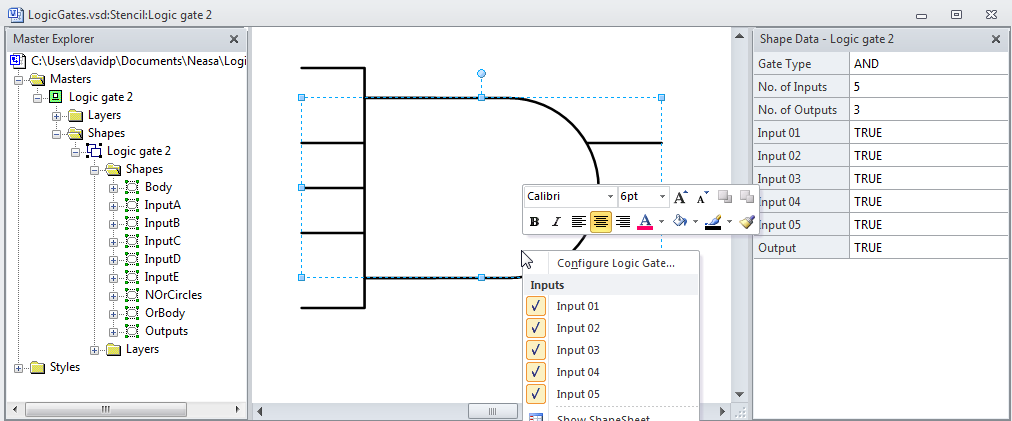
A Visio Logic Gate with Logic
This article shows how the ShapeSheet formulas can be used to add Logic to a Logic Gate shape in Visio.
“I choose a lazy person to do a hard job. Because a lazy person will find an easy way to do it.” – Bill Gates.
Good morning Louise! I like the quote 🙂
http://quoteinvestigator.com/2014/02/26/lazy-job/
Hi David,
I have shapes on my Visio page linked from two External Data Set: some shapes are linked to set People, and other to set called Offices. One of the data field (office) of shapes “People” refer to name of a shape in set “Offices”, and I’d like to connect the People shapes to their respective Office shape using Visio connectors. I thought I could do it with this example, but if I understand correctly, this example here works with a single Data set, not two.
Do you think it would be possible to do such thing?
Certainly it is possible. Simply loop thru the personnel recordset, retrieve the linked shape and office key. Then use the office key to filter the office recordset, and get the linked shape. You can then connect one to the other.
This macro does exactly what it says on the tin (thank you!), but has Microsoft really still not incorporated a function in Visio that can connect shapes from data?
Microsoft have released Data Visualizer for Visio, and Visio Data Visualizer add-in for Excel. They do create connections from data, but they are not a general feature that can be used with any dataset.
Thanks for the fast response, which I first saw now. However, I’ll keep using your macro as it seems the most simple. By the way, do you know how to “pack circles in circles” in Visio with linked data? Something like this: https://www.r-graph-gallery.com/314-custom-circle-packing-with-several-levels_files/figure-html/thecode2-1.png
Hi David,
Liked your article but your links are not working. Could you forward the marco to me?
Hi Greg,
I have updated the links in the article … thanks for pointing it out
Hi David,
Any chance you can send me the macros? You links are not working again.
I checked the links … seem to be working (with the usual security prompt) but I will send you an email direct