• Skip to main content
  • Skip to primary sidebar
  • Skip to footer

bVisual

  • Home
  • Services
    • How Visio smartness can help your business
    • Visio visual in Power BI
    • Visio Consulting Services
    • Visio Bureau Services
    • Visio Training and Support Services
  • Products
    • Visio Shape Report Converter
    • SS Plus
    • LayerManager
    • visViewer
    • Metro Icons
    • Rules Tools for Visio
    • The Visio 2010 Sessions App
    • Multi-Language Text for Visio
    • Document Imager for Visio
    • multiSelect for Visio
    • pdSelect for Visio
  • Case Studies
    • Case studies overview
    • Using Visio in Education for GIS
    • Visualizing Construction Project Schedules
    • Visio Online Business Process Mapping
    • Nexans Visio Template
    • CNEE Projects, WorldCom
    • Chase Manhattan Bank
  • News
    • Recent news
    • News archive
  • Resources
    • Articles➡
      • ShapeSheet Functions A-Z
      • Comparing Visio for the Web and Desktop
      • Customising Visio Shapes for the Web App
      • Key differences between the Visio desktop and web apps
      • Using the Visio Data Visualizer in Excel
      • Using Visio in Teams
      • Creating Visio Tabs and Apps for Teams with SharePoint Framework (SPFx)
      • Designing Power Automate Flows with Microsoft Visio
      • Innovative uses of Visio Lists
    • Webcasts ➡
      • Visio in Organizations
      • My session and other Visio sessions at MSIgnite 2019
      • Power up your Visio diagrams
      • Vision up your Visio diagrams
      • The Visio 2010 MVP Sessions
    • Visio Web Learning Resources
    • Books➡
      • Visualize Complex Processes with Microsoft Visio
      • Mastering Data Visualization with Microsoft Visio
      • Microsoft Visio Business Process Diagramming and Validation
      • Visualizing Information with Microsoft Visio
  • Blog
    • Browse blog articles
    • Visio Power BI articles
    • Visio for Web articles
    • A history of messaging and encryption
  • About us
    • About bVisual
    • Testimonials
    • Bio of David Parker
    • Contact Us
    • Website Privacy Policy
    • Website terms and conditions
    • Ariba Network
You are here: Home / Visio / Visio 2013 / Visio Org Charts with Multiple Languages

Published on April 17, 2015 by David Parker

Visio Org Charts with Multiple Languages

I had an enquiry recently about displaying Organisation Charts with text in different languages. This set me thinking, and, if you have Visio Professional, then you can use Link Data to Shapes to add this capability to existing diagrams, but Visio Standard users can just the Org Chart Wizard.

I will use the OrgData.xls file that is provided in the <Program Files>\Microsoft Office\Office 15\Visio Content\<LCID>\ folder to demonstrate this. I have English US (1033) and Norwegian Bokmal (1044) available to me, as shown below:

In Englsih

image

In Norwegian:

image

As my Visio installation is in English, I need to use the column headings in the English work book for matching with the Shape Data labels, so I copied the Tittel, Avdeling, and Originalfigur columns from the Norwegian and appended to the English one, before saving the Excel workbook.

Using the Org Chart Wizard

I can then use the Org Chart Import wizard to create a new Org Chart from the Excel table:I c
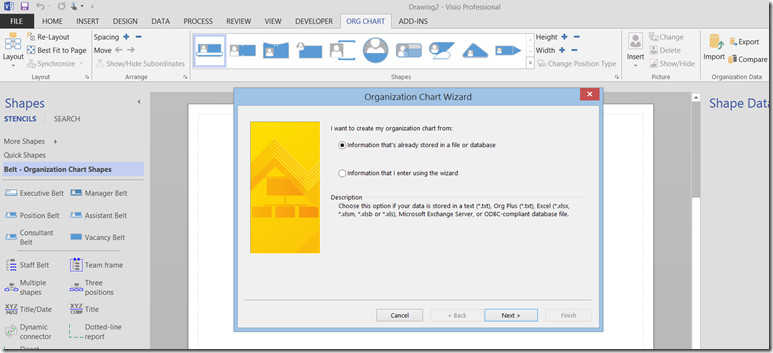
image

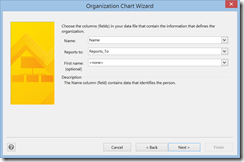
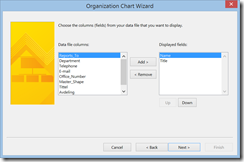
I can use the English column headings to match the Name and Reports_To fields, and choose to display just the Name and Title fields for now, but add all of the other columns as Shape Data fields.
17-04-2015 10-57-24
17-04-2015 10-57-59
17-04-2015 10-58-33

This will create me an organisation chart with shapes that contain all of the text I need.
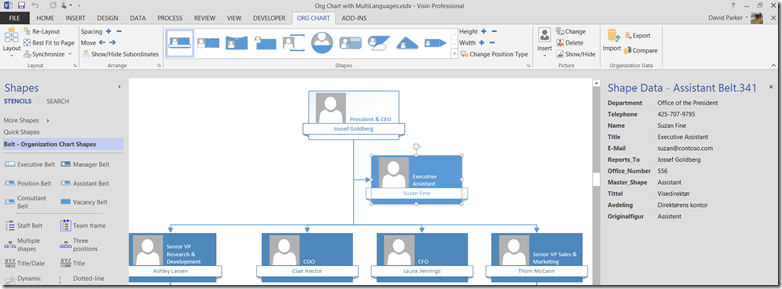
image

I can then change which field text is displayed in the blocks by opening the Options dialog from the little button (highlighted with a pink circle). This change will apply to all Org Chart shapes on all pages.
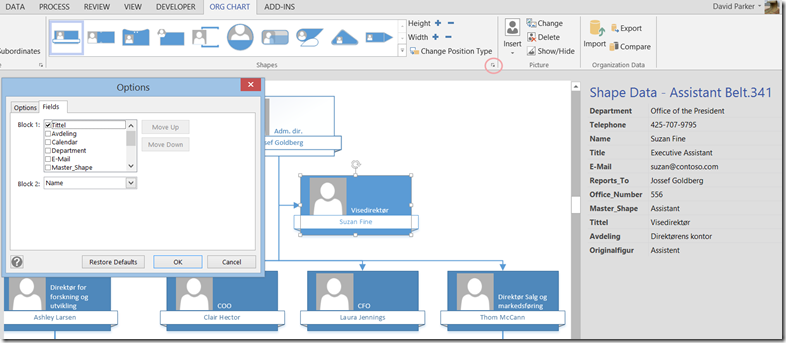
image

Using Link Data to Shapes

If I had already created an org. chart without the extra language fields, then that is also no problem if I have Visio Professional, because I can use the Link Data to Shapes function to add them.

Firstly, I uncheck the Apply after Linking Data to Shapes option from the DATA \ Data Graphics dropdown menu, if I do not want Data Graphics to be automatically added to each shape.
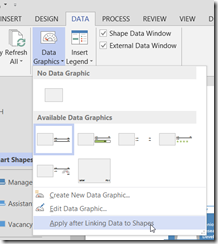
image

Then I select the Excel workbook that contains my data. In fact, I really only need to have the key column (Name) and the extra columns I want, but I included them all in my example. This means that I will be able to refresh these values on the shapes automatically when I change them in the Excel workbook.

image

I then need to select the columns that uniquely identify the row in the table.
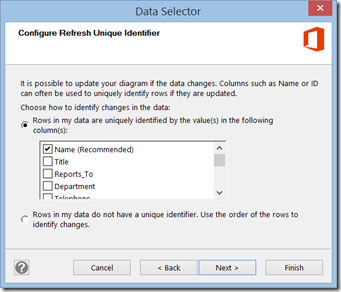
image

Then I need to ensure that it applies to all shapes on the page.
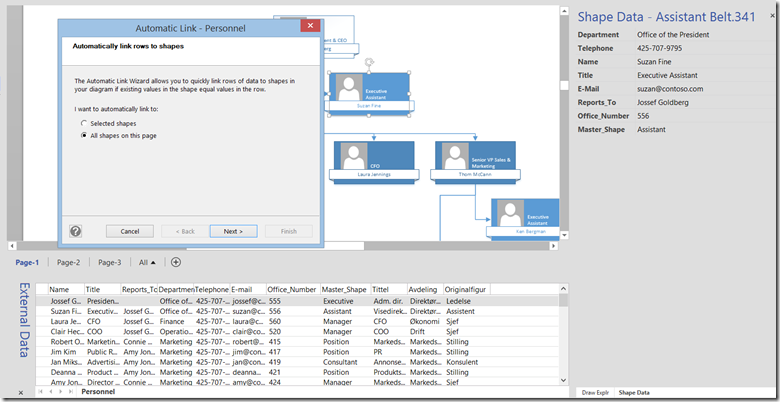
image

Their needs to be at least one column that can match a shape field value in order for the shapes on the page to be automatically linked.
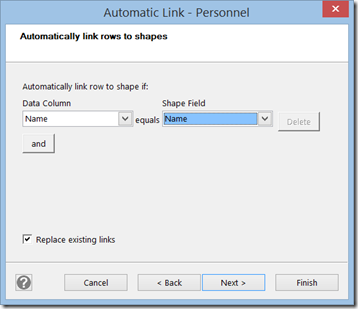
image

The only drawback of the Link Data to Shapes method is that it needs to be repeated for each page, but that could easily be automated with a macro.

Once the extra fields exist on the shapes, then I can use the Options dialog, just like before:
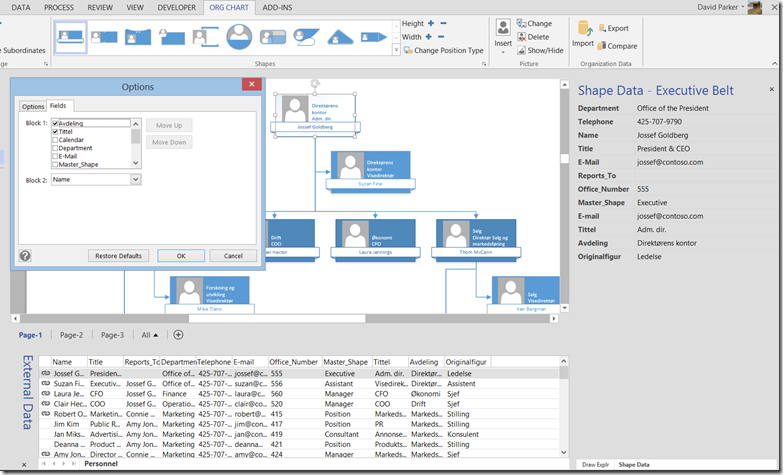
image

Using Data Graphics

Finally, I can use Data Graphics to add interest, as I did with Color By Value for Adveling below. I could just as easily have used the English alternative, Department, and thus used the Insert Legend with that field.
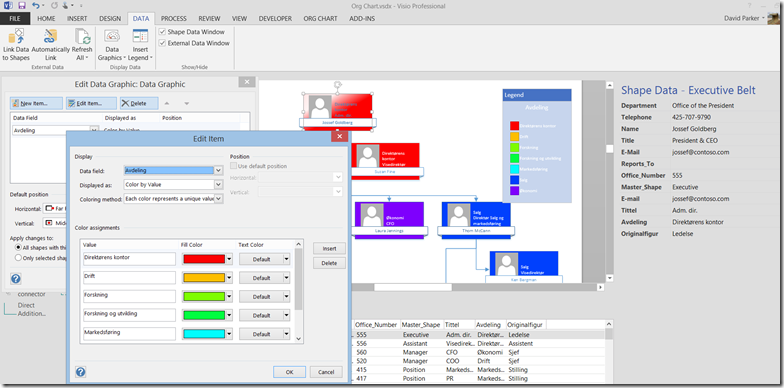
image

Related

Filed Under: Data Graphics, External Data, Org Charts, Shape Data, Visio 2013 Tagged With: Link Data to Shapes, Org Chart

About David Parker

David Parker has 25 years' experience of providing data visualization solutions to companies around the globe. He is a Microsoft MVP and Visio expert.

Reader Interactions

Trackbacks

  1. Aliasing Data Columns for #Visio Organization Chart Wizard | bVisual - for people interested in Microsoft Visio says:
    January 2, 2018 at 7:37 pm

    […] Visio Org Charts with Multiple Languages […]

    Reply

Leave a Reply Cancel reply

Your email address will not be published. Required fields are marked *

Primary Sidebar

  • LinkedIn
  • Twitter

Recent Posts

  • Fixing dimensions of 2D shapes
  • Merging Linked Data from Similar Tables
  • Smart Radio Buttons and Check Boxes in Visio
  • Using Button Face Ids in Visio
  • Grid Snapping Revisited

Categories

Tags

Accessibility Add-Ins Connectors Containers Data Export Data Graphics Data Import Data Visualizer Educational Excel GraphDatabase Hyperlinks Icon Sets JavaScript LayerManager Layers Legend Link Data to Shapes Lists MSIgnite MVP Office365 Org Chart PowerApps PowerBI PowerQuery Processes Setup and Deployment Shape Data Shape Design ShapeSheet ShapeSheet Functions SharePoint 2013 SQL Teams Validation VBA Video Visio Visio 2007 Visio for the Web Visio Online Visio Services Visio Viewer Webinar

Footer

bVisual Profile

The UK-based independent Visio consultancy with a worldwide reach. We have over 25 years experience of providing data visualization solutions to companies around the globe.

Learn more about bVisual

  • Amazon
  • E-mail
  • Facebook
  • LinkedIn
  • Twitter
  • YouTube

Search this website

Recent posts

  • Fixing dimensions of 2D shapes
  • Merging Linked Data from Similar Tables
  • Smart Radio Buttons and Check Boxes in Visio
  • Using Button Face Ids in Visio
  • Grid Snapping Revisited

Copyright © 2025 · Executive Pro on Genesis Framework · WordPress · Log in