I have been very busy for the last two months. Too busy to write a blog, I’m afraid, so now I want to tell you what one of those months was spent on. I have been chairman of a residents association that has been fighting the overdevelopment of a strip of countryside adjacent to our close. This has been going on for many years, and we successfully persuaded the councillors in January, against the advice of their own officers, that the most recent proposal, for 492 houses and 150 residential care units, was unsound on several grounds (almost literally). The developer appealed, and this was called in by the Secretary of State for a public inquiry. We had this inquiry in June, when I appeared as an expert witness, and used my Visio skills to help build our case.
Before I go one, I must state that any views expressed are my own and may not represent the whole of the residents association. You may wonder how come I am qualified to be an expert witness? Well, two reasons; the first being that I used to be an architect, and the second is that we couldn’t afford anyone else. As it is, we had approximately 300 local residents contributing to our group so that we could be represented at the public inquiry by a barrister, solicitor and a specialist expert witness. I was interviewed by the BBC before the planning committee meeting, see http://news.bbc.co.uk/1/hi/england/berkshire/7817260.stm .
The town where I live in the UK is on the eastern boundary of Reading (not far from Microsoft UK & EMEA). However, Woodley is not politically part of Reading, but part of Wokingham Borough Council, even though it is physically closer to Reading than Wokingham. In fact, access from Woodley to Reading is restricted by the London mainline railways and a urban motorway. On the plus side, Woodley is bordered by many lakes caused by the flooding of old gravel works, but some old pits were used as landfill for refuse then covered over. One such covered landfill site is on the other side of the road from our house. I did not know this when we purchased our house some six years ago, even though it is only 100m or so away, but I found out pretty soon afterwards because there was a plan to develop 350 houses on the site with a passing place for double-decked buses outside or bedroom window which is currently a footpath.
This got me involved in the local residents association that was fighting the development, and I then found out that there had been years of dumping of all sorts of unhealthy waste there, mostly unregulated. The developers dug some trial holes, and we were inundated with flies in all of the houses within half a mile or so of the site. The more I found out about the site, the more I became convinced that it best left well alone. True, our house should never have been built so close, but I cannot afford to sell the house at a loss, but there is far too much risk involved in attempting to clean it up. If anyone needs convincing in the dangers of reclaiming polluted land then they need look no further than the case against Corby Council last week (http://news.bbc.co.uk/1/hi/england/northamptonshire/8173733.stm ) where the judge ruled that the toxic dust from the process of reclaiming the land can cause birth defects, at the very least.
So the dangers of trying to clean-up the land was always at the front of our minds, but we mostly had to fight the developers of this site on more tangible cases, such as housing density, settlement boundary transgressions and visual harm. This is where Visio proved invaluable.
We had been so successful in our opposition to the proposed housing developments of a previous owner of site, that they gave up and sold the land to another company. The site had only become considered for housing because Oracle Corporation had previously managed to get planning permission for a world-class training centre and hotel. This was only possible because these types of building can apparently be built ON TOP of the buried landfill. However, it was necessary to redraw the town’s settlement boundary closer to the visually sensitive Loddon rivers. This scheme had some benefits for the local community, such as providing leisure facilities, and the traffic would be the opposite direction to the morning traffic jam to the local motorway. Unfortunately, the Oracle Corporation has withdrawn their interest in the site, but the current owners are trying to keep their options open by preserving this planning permission.
The Visio timeline diagrams displays the history of the planning applications and site owners quite clearly. The buying of the land on 9th Nov. 2005, selling it on to a related company on the same day, then closing down the first company, strikes me as a curious act,
The shareholders of the current land owning company, Sandford Farm Properties Ltd, are unknown, since the company is registered in Jersey, but we do know that it is now in receivership.
The developer’s proposed 492 houses plus 150 retirement units on the site can be seen in the collage that it was able to do with Microsoft Research’s MapCruncher for Bing (nee Virtual Earth) see http://www.microsoft.com/maps/product/mapcruncher.aspx
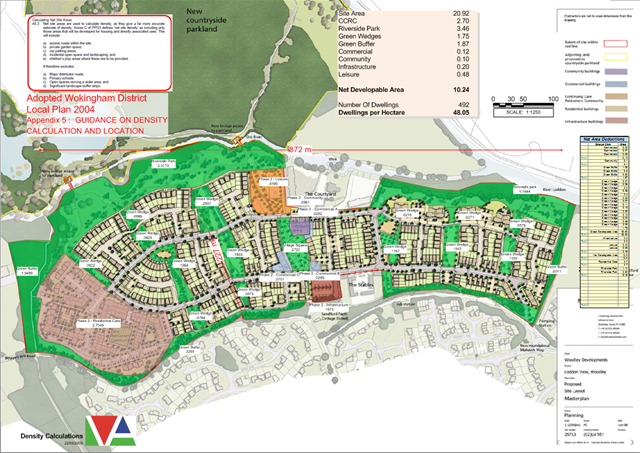
The developer’s submission to the planning committee meeting claimed that the density is 31 dwellings per hectare (dph). The council officer’s report to the committee stated that it is 34 dph. Whilst we were preparing for the public inquiry, a planner colleague of mine suggested that I look more closely at these claims.
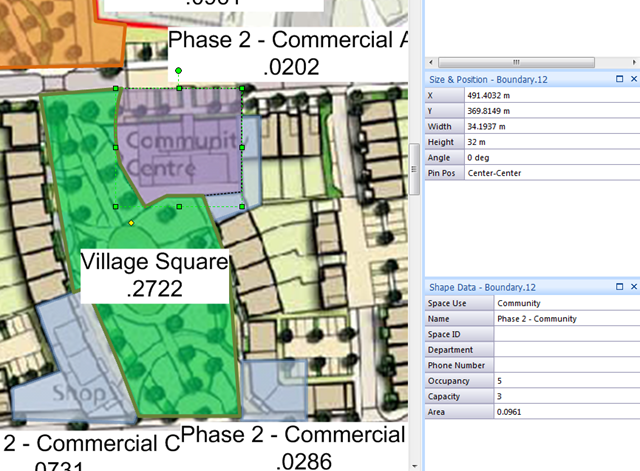
Fortunately, I was able to download the developer’s site plan from the council’s web site as a pdf file, and this plan had the scale and page size in it’s title block. I could therefore create a Visio page of that size and scale, and import the site plan image into the page, then size the image to fit the page.
It was then a simple matter of using a modified Boundary master from the Resources stencil in the Building Plan folder of Visio Professional 2007.
I added a Shape Data Row, Prop.Area, to the Boundary master, and displayed the values in hectares.
The Space Plan solution includes a user cell, visFMArea, which is automatically update with the area of the shape, but you could do set the value in the Prop.Area cell like thus:
For Each shp In Visio.ActivePage.Shapes
If shp.CellExists("Prop.Area", Visio.visExistsAnywhere) Then
area = Visio.Application.ConvertResult(shp.AreaIU, "sq in", "ha")
totalArea = totalArea + area
shp.Cells("Prop.Area").Formula = area
End If
Next
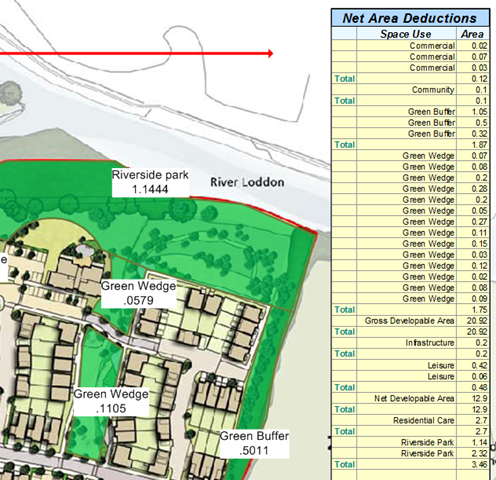
I created a report to sum the areas by Space Use.
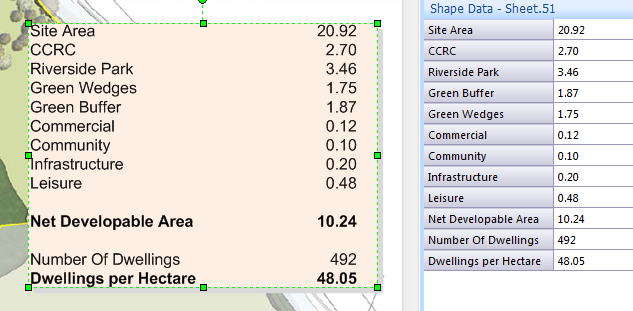
I then entered these total areas into some Shape Data rows on a legend block, and entered formulae to calculate the Net Developable Area and the Dwellings per Hectare.
Formulae can only be entered in the ShapeSheet:
So, the formula in the Prop.NDA cell is:
=GUARD(Prop.SiteArea-Prop.CCRC-Prop.RiversidePark-Prop.GreenBuffer-Prop.GreenWedges-Prop.Commercial-Prop.Community-Prop.Infrastructure-Prop.Leisure)
The formula in the Prop.DPH cell is:
=GUARD(Prop.NumberOfDwellings/Prop.NDA)
You can see that the figure calculated in Visio is far in excess of the 31 dph originally claimed, and the developers did revise this to 37 dph in the process of the inquiry, but the Council appointed an independent planner who confirmed that the figure is 48 dph.
Using Bing (nee Virtual Earth) we proved that the Sandford Farm site is over 800 m walking distance from the nearest local centre. This was important because the council’s planning guidelines allow 40 dph if the site is within 800 m, otherwise it recommends 30 dph.
As far as we could tell, the developers only defence is that the government require so many new houses to be built that they should be allowed to exceed the planning guidelines!
There were other areas where we found the developers to be somewhat misleading. For example, they based their landfill cleansing calculations on 300,000 cu.m. of waste, but we obtained a document from the Environment Agency that shows that 1,000,000 cu.m. was dumped there.
We hope we have done enough to prevent this over-development which could seriously damage our health, but we are still awaiting the verdict because the planning inspector prepares his report and recommendation for the Secretary of State. We expect the result in September sometime.


Leave a Reply
You must be logged in to post a comment.