Visio 2007 Professional introduced the wonderful Data Graphics feature to display Shape Data in a clear visual way, but it is not clear how you may, for example, change the font of even the simplest Graphic Item type, Text Callouts. In this blog, I’ll show you one method that I employ to vary the appearance of Text Callouts. The same technique can be used for other Graphic Item types, Icon Sets and Data Bars.
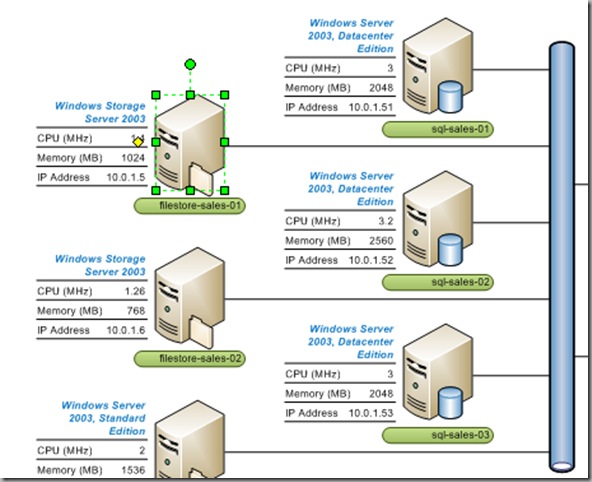
I am using the the sample IT Asset Management drawing to demonstrate throughout, which can be found in the Samples Template Category. In this diagram, the server shapes on the topology page use the Topology 1 Data Graphic, which can be seen in the Data Graphics panel.
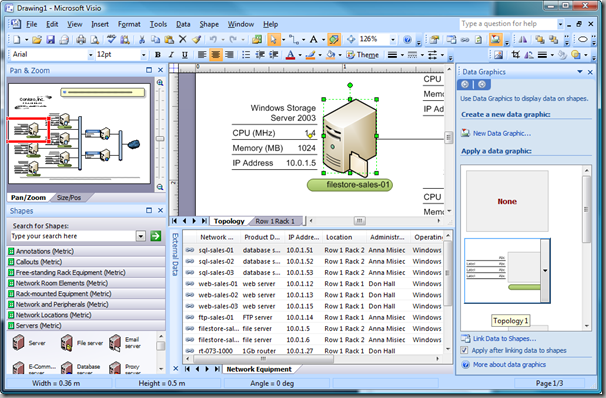
Microsoft had to introduce a new capability in Visio 2007 in order to get Data Graphics working, namely the ability for a shape instance to hold a reference to a DataGraphic master in addition to its normal master. So, if you open the Drawing Explorer window, you can see the normal Server master, in addition to the Topology 1 Data Graphic master. If you open the Topology 1 master, you can see the full Data Graphic, and you can expand the Master Explorer to show that there are multiple shapes inside it. These shapes are the ones that you see displayed in a more friendly way in the Edit Data Graphic dialog.
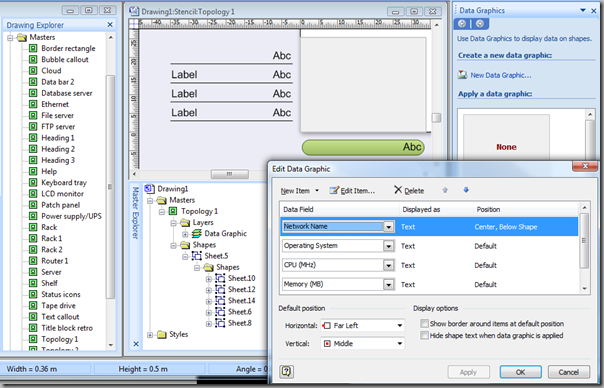
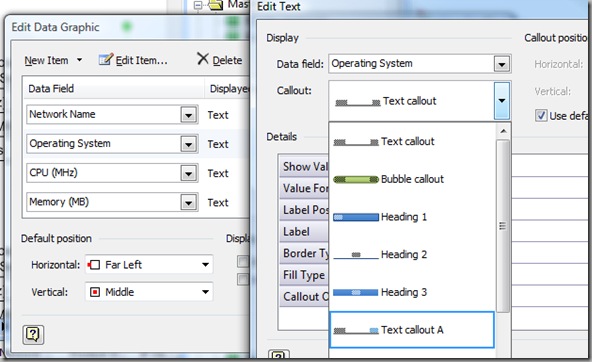
However, you may also notice that this particular Data Graphic uses the same Text callout Graphic Item multiple times. This is evident if you select Edit Item for Operating System, CPU (MHz), Memory (MB) or IP Address Data Fields in the Edit Data Graphic dialog. In fact, you can only tell which Graphic Item master is being used in the Data Graphic master in code, or by opening the ShapeSheet of each of the sub-shapes.
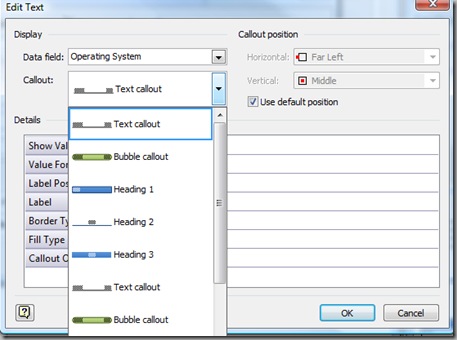
You can see on the Edit Text dialog that you can edit certain properties, but font is not one of them! SO, how can you edit the font? Well, you could go around each shape in the diagram, sub-select the shapes and change it that way, or you can create a variation of the Text callout Graphic Item master.
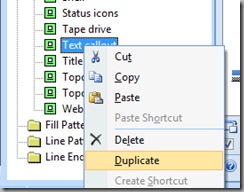
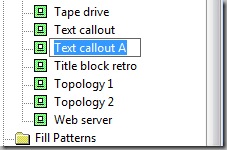
In the Drawing Explorer window, select the Text callout master, then Duplicate on its right mouse menu. You can then rename the new Text callout.xxx as whatever you like (I have used Text callout A).
Once you have a copy, you can double-click (or use select Edit Master Shape from its right mouse menu). You will see that the Text callout master is comprised of two shapes, Sheet.5 (which is the group) and Sheet.6 (a sub-shape of the group). The Label text is part of Sheet.5, whilst the value (Abc) is part of Sheet.6.
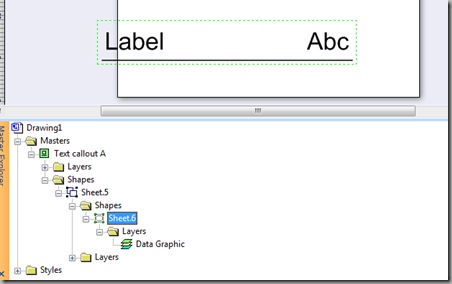
You can now edit the font of either the whole lot by selecting the shape, or you can just do the value by selecting Sheet.6 in the Master Explorer window.
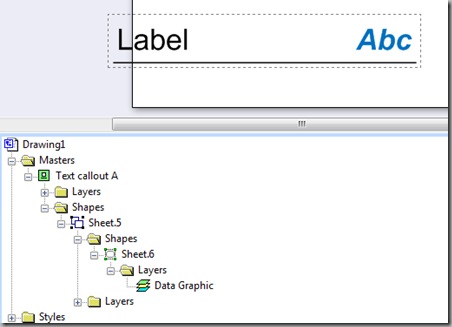
Now, you can close the Master Edit window to save the changes.
Now, when you go to the Edit Data Graphic dialog for Toplogy 1 Data Graphic, and select Edit Item for, say, Operating System, you will find your new variation, Text callout A, listed.
So, when you select your new variation of Text callout, all of the shapes that use it will be updated automatically!
Q.E.D.
By the way, there’s more like this in my book …
Nice article, David. Data Graphics will add another ten pages to all of our text-handling training slides, books, e-books, blog articles, and other media.
And, folks, David is being too shy. His book is excellent. Check it out: Visualizing Information with Microsoft Visio 2007!
The images on this page are not displaying.
They appear quite clearly for me … perhaps you could try again?
This works really well with the text format mods. I am now trying to rotate my text in the data graphics but have not had success. I’ve seen this request several times on the internet for folks who want to display data on mechanical and electrical shapes that are typically rotated.
When i rotate the text callout master, all text on shapes come out overlaid. When i try to rotate the text in the data graphics master, the data graphics wizard reflects the change, but the end shape is overridden so that it looks like nothing happened. Any ideas? I’m still using Visio 2007.
I am not sure I understand. In Visio 2013, I just created a text data graphic with rotated shape, and one with just rotated text. Both seemed to work OK.
Did you re-apply the changed data graphic to the shapes? You need to do this because they get created when they are applied.
I am trying to rotate my text. I have created a new master call out that is rotated and apply it to the data graphic. The problem is when i have several rotated text callouts on the same shape. When i leave the callout position as default, they all show up overlaid on top of each other. I can go through the extra strep to adjust the position of each but this makes the text show up far from each other. I am using Visio2010 but not sure that makes a difference.
Is there a way to customise text in a Data Graphic. Im pretty sure i did it yesterday without really paying attention, now i am stuck.
Lets say i have a data graphic, and the top field of ‘Name’ appears with a purple fill behind the white text. I want to change that purple fill to some other colour, for this one shape/data graphic. I just cant seem to figure out how that might be done.
Hmm … the Data Graphic item is just a sub-shape in the group. You should be able to sub-select it by clicking on it twice, then formatting it.
Double click seems to bring up the text for the main shape, not editing the graphic 🙁
I should have said click twice rather than double click …. It is Dow to the speed between clicks…
Sent from my Windows Phone ________________________________
Hi,
Useful article and based on it and a few others I have purchased your book.
However, whilst it is still on its way, I wondered if you could tell me how I can align the value on a text callout?
I followed the steps above and tried a few other modifications, however, I cannot seem to find the Shapesheet condition for text alignment. Is this possible?
I managed to find the condition I needed and it works perfectly now.
So glad because I was on holiday!
Hello, David!
Do you know how to draw a conditional text callout?
I have two fields dependent on a ‘flag’ field (if value of flag is TRUE then they appear for the users to fill in). I want values of these two fields show under the shape if value of flag is TRUE. And if the value is FALSE I don’t want them to be presented on a diagram.
If you mean a conditional display of a Shape Data row, then you can use the ShapeSheet to set a formula in the Invisible cell that evaluates to True or False. Eg
=LEN(Prop.OtherRow)=0 would make a row invisible if no text been entered in Prop.OtherRow
Thanks for posting this; I knew there had to be a way to modify each of my data graphics without selecting every single instance.
I have been searching for this type of answer for weeks! I’d like to take it a step further and change the font color of the data graphic depending on the fill color of the shape. For example, if the FillForegnd of the shape, not the data graphic sub-shape, is White or Yellow I need the sub-shape font to be black, if the Fill is Blue or Green the font needs to be white. I can get it to work on a single shape using =OR(IF(OR(Sheet.135!FillForegnd=RGB(0,112,192),Sheet.135!FillForegnd=RGB(0,176,80)),1,0),IF(OR(Sheet.135!FillForegnd=RGB(255,255,0),Sheet.135!FillForegnd=RGB(255,255,255)),0,1))) in the Character Color of each data graphic sub-shape, but can’t figure out how to set up a Master Data Graphic that will automatically apply that whenever the data graphic is applied. I typically have 4 different sub-shapes per data graphic so it’s cumbersome to have to change them all manually.