On 02 Aug 2023, Stanley M. Max made a presentation at Towson University (located in Towson Maryland) before the TUgis 2023 conference. (TUgis stands for Towson University GIS.) Stanley spoke about a Visio mapping project that he worked on with David J. Parker. Stanley originated the idea for this mapping project and initiated the process. However, the programming involved in the project was beyond Stanley’s skillset, so he looked on the web for a Visio expert to do that portion. He found David Parker’s information, and Stanley asked David if he would be willing to take over the programming to complete what needed to be done to bring the project to fruition. David kindly agreed with the request.
What follows is a slightly edited abstract of the talk:
Microsoft Visio is a powerful diagramming program used to produce visuals like organization charts, flowcharts, and floorplans. It has many advanced features enabling power users to carry out sophisticated quantitative analysis and generate state-of-the-art graphics. At the same time, newcomers to the program can get started fairly quickly and easily using basic, easy-to-learn procedures. Since Visio forms part of the Microsoft Office family, the program shares characteristics familiar to computer users of all levels. Visio can be used for mapping projects — which provides the central focus of this TUgis project. For a task primarily involving mapping, then, certainly, ArcGIS provides the superior package. However, the versatility that Visio offers — since so much more can be done with it than just mapping — makes Visio an extraordinarily helpful tool for education.
In our project we used Microsoft Visio to produce a map of all 27 member states of the European Union (EU) following the United Kingdom’s withdrawal from the bloc in 2020. We have associated this map with a legend containing the names of these 27 countries. When you click on a country’s name, the country is highlighted on the map and a table pops up containing these key demographic items for the country:
- Population, which Stanley input.
- Area in km², which again Stanley input.
- Percent of the total EU population, calculated by a formula embedded in Visio. David Parker programmed Visio to make this calculation.
- Percent of the total EU area, also calculated by Visio. Again, David carried out the Visio programming.
- Population density, again calculated and again via David’s programming skills, to show the number of people per square kilometre.
This project combines computer mapping, contemporary European politics, and demography. It serves as a case study of Visio’s usefulness in an educational setting.
Related articles

Creating Boolean Context Menus in Visio
Over the many, many years that I have been creating Microsoft Visio solutions, I have had to create numerous right-mouse context menus for shapes to control their Shape Data values. Over that time, patterns emerge, so this article is highlighting three different appearances for simple Boolean values, otherwise known as True/False or Yes/No values, and…
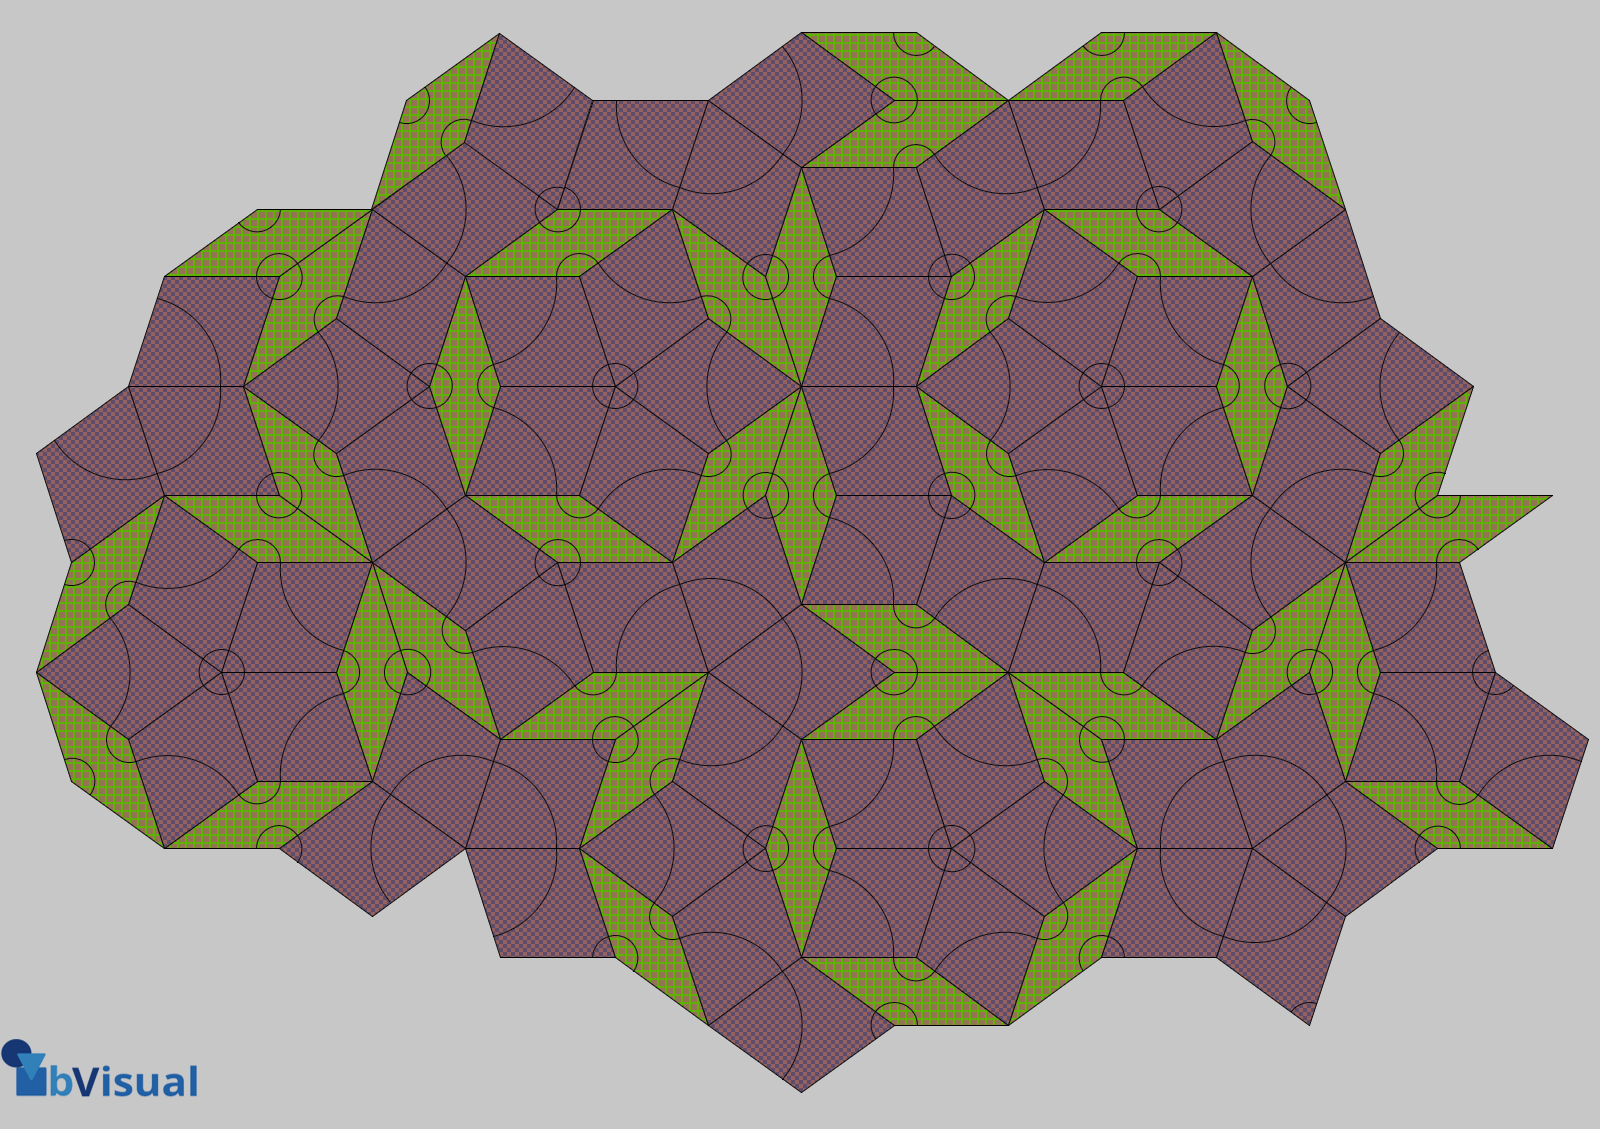
A visual exploration of Penrose Tiling in Visio
Maybe it is because I used to be a building architect, but I have always been fascinated by the relationship between numbers and visualisations. Perhaps the most famous one is the Golden Ratio which has been used as the basis of many building designs and art pieces. It is often recognised to create a harmony…
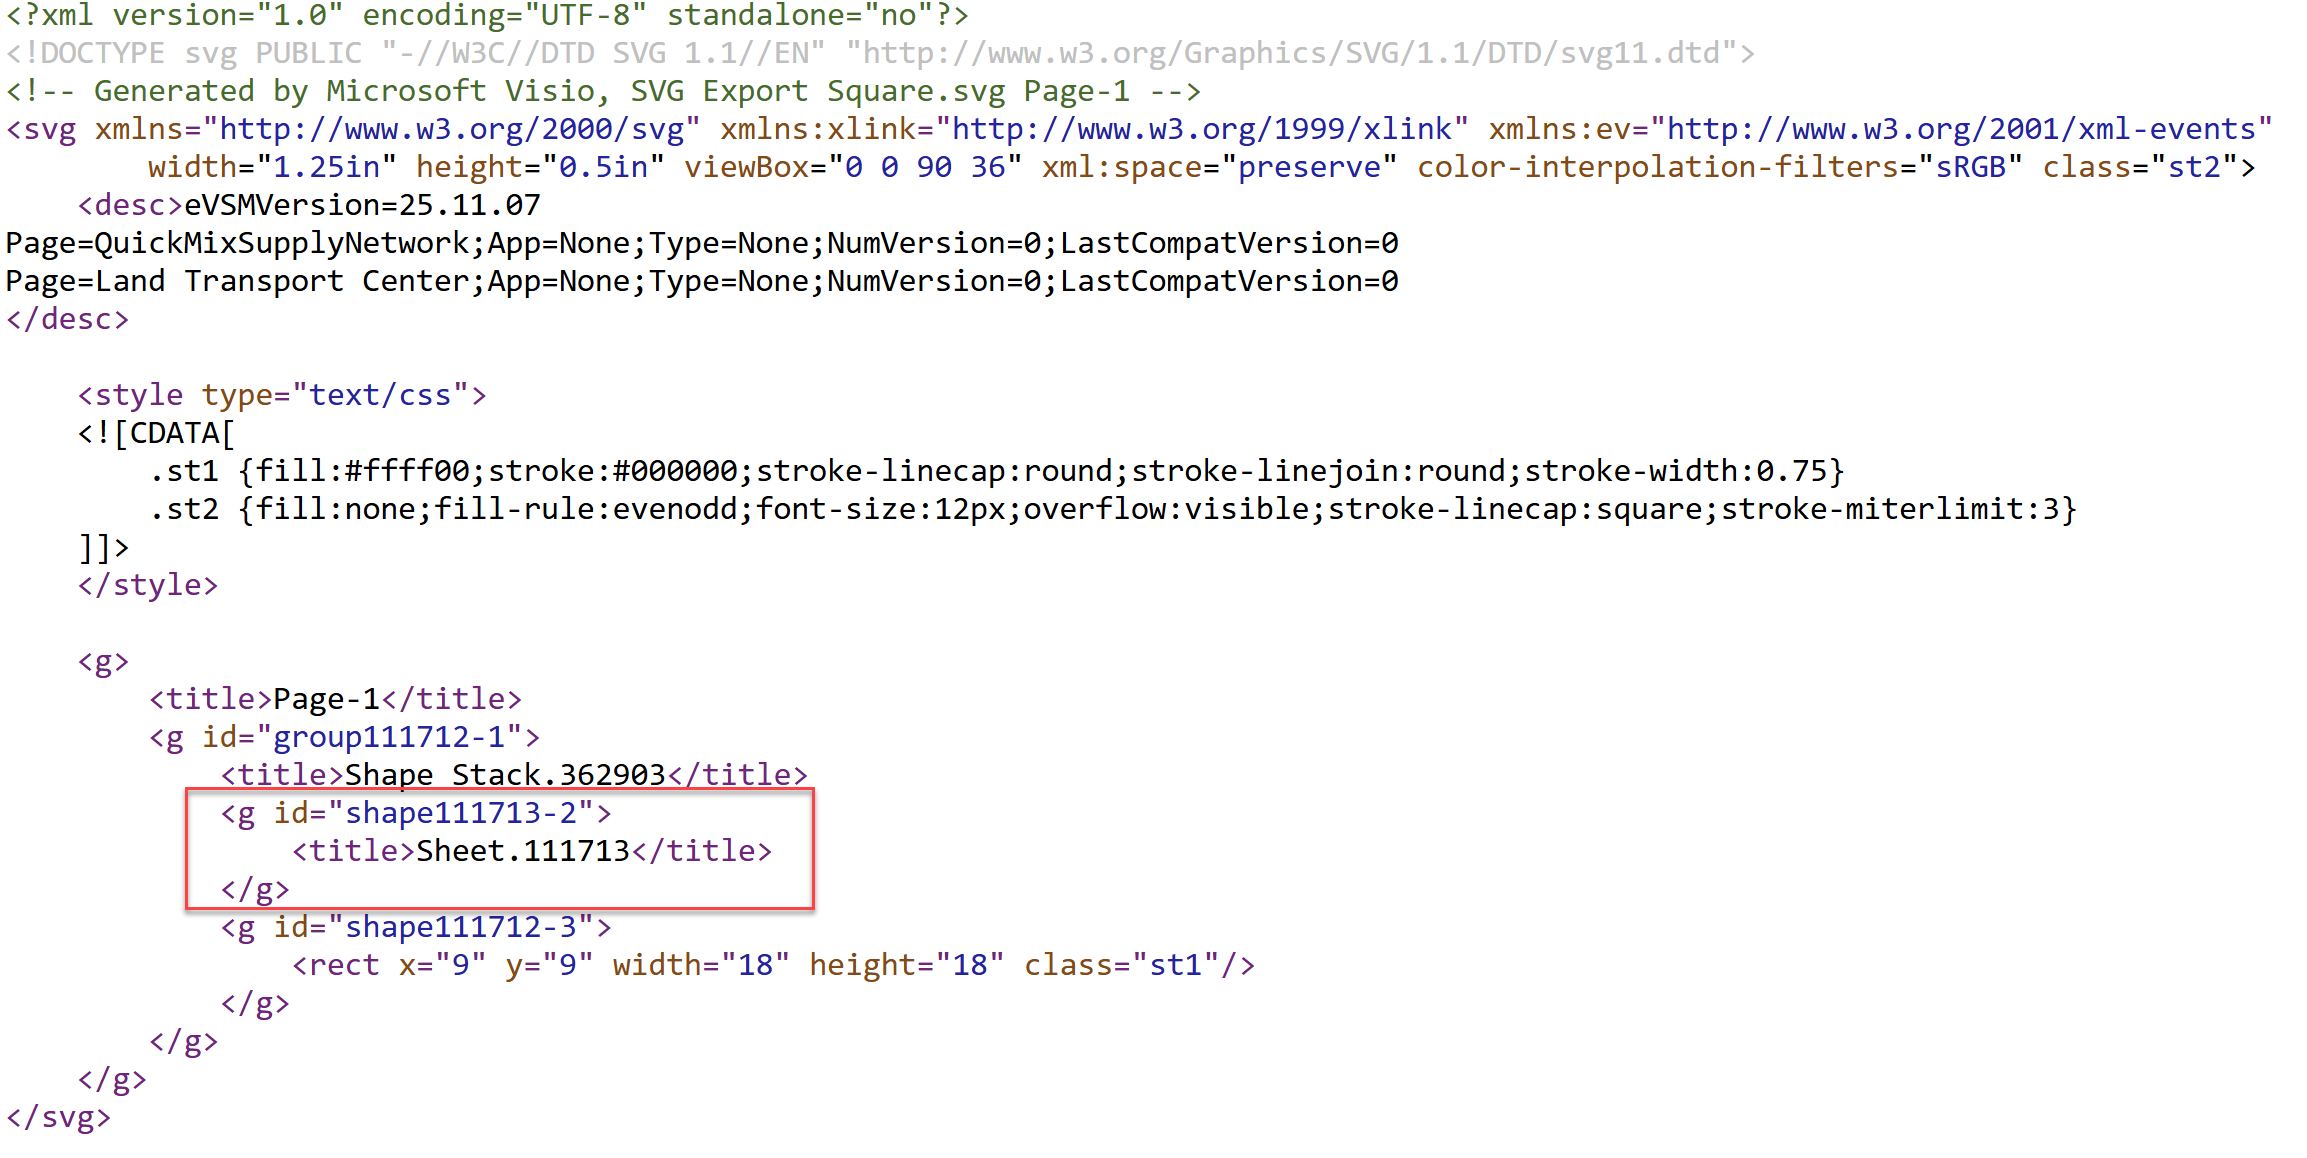
How SVG in Visio can cause a Shape.BoundingBox(…) error
I have used Visio’s Shape.BoundingBox(…) for many, many years and I cannot ever recall it failing, but I have now managed to create some shapes that cause it to error. This caused many hours of confusion, so I nearly abandoned using the method, until I discussed it with my fellow Visio MVP, John Goldsmith (see…

Jumping between Shapes in Visio
Many Visio diagrams get quite large, and sometimes it is useful to provide the ability to jump to another shape quickly in the same document, either on a different page or on the same one. Although there is an add-on provided in desktop Visio that is used by the Off-Page Reference shape provided in the…
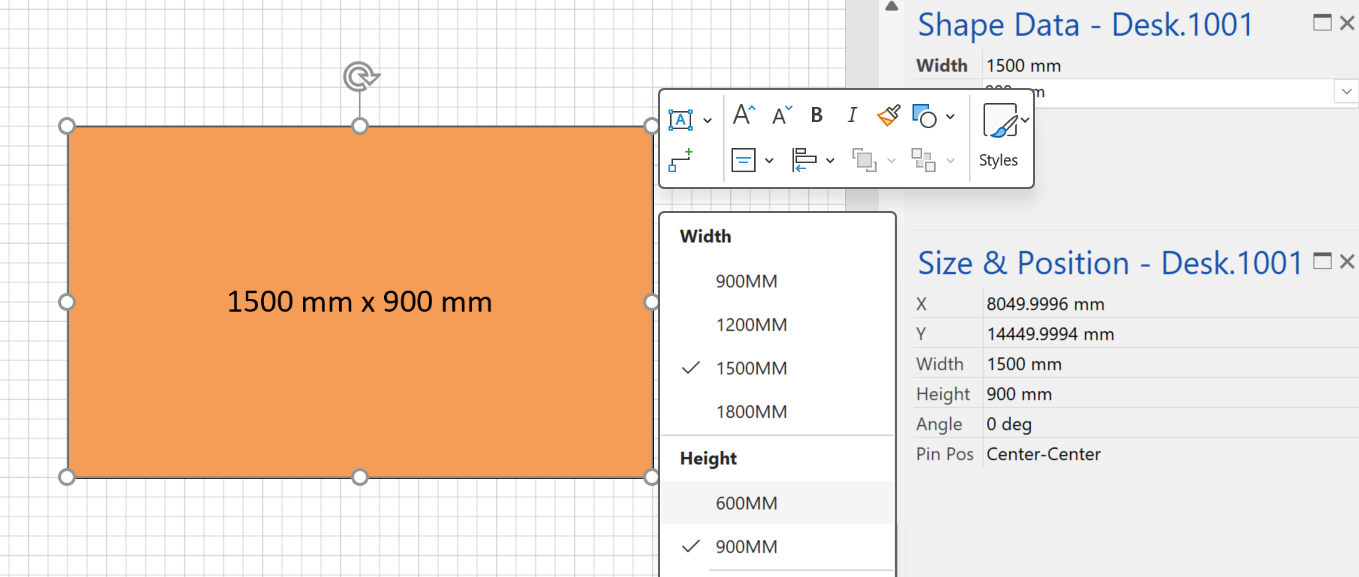
Fixing dimensions of 2D shapes
I am often asked what makes Visio unique and makes it stand out from the crowd, especially in today’s online world. Well, I think there are many reasons, but one of them is the ability to create scaled drawings with parametric components of specific dimensions. This was crucial for my adoption of Visio back in…
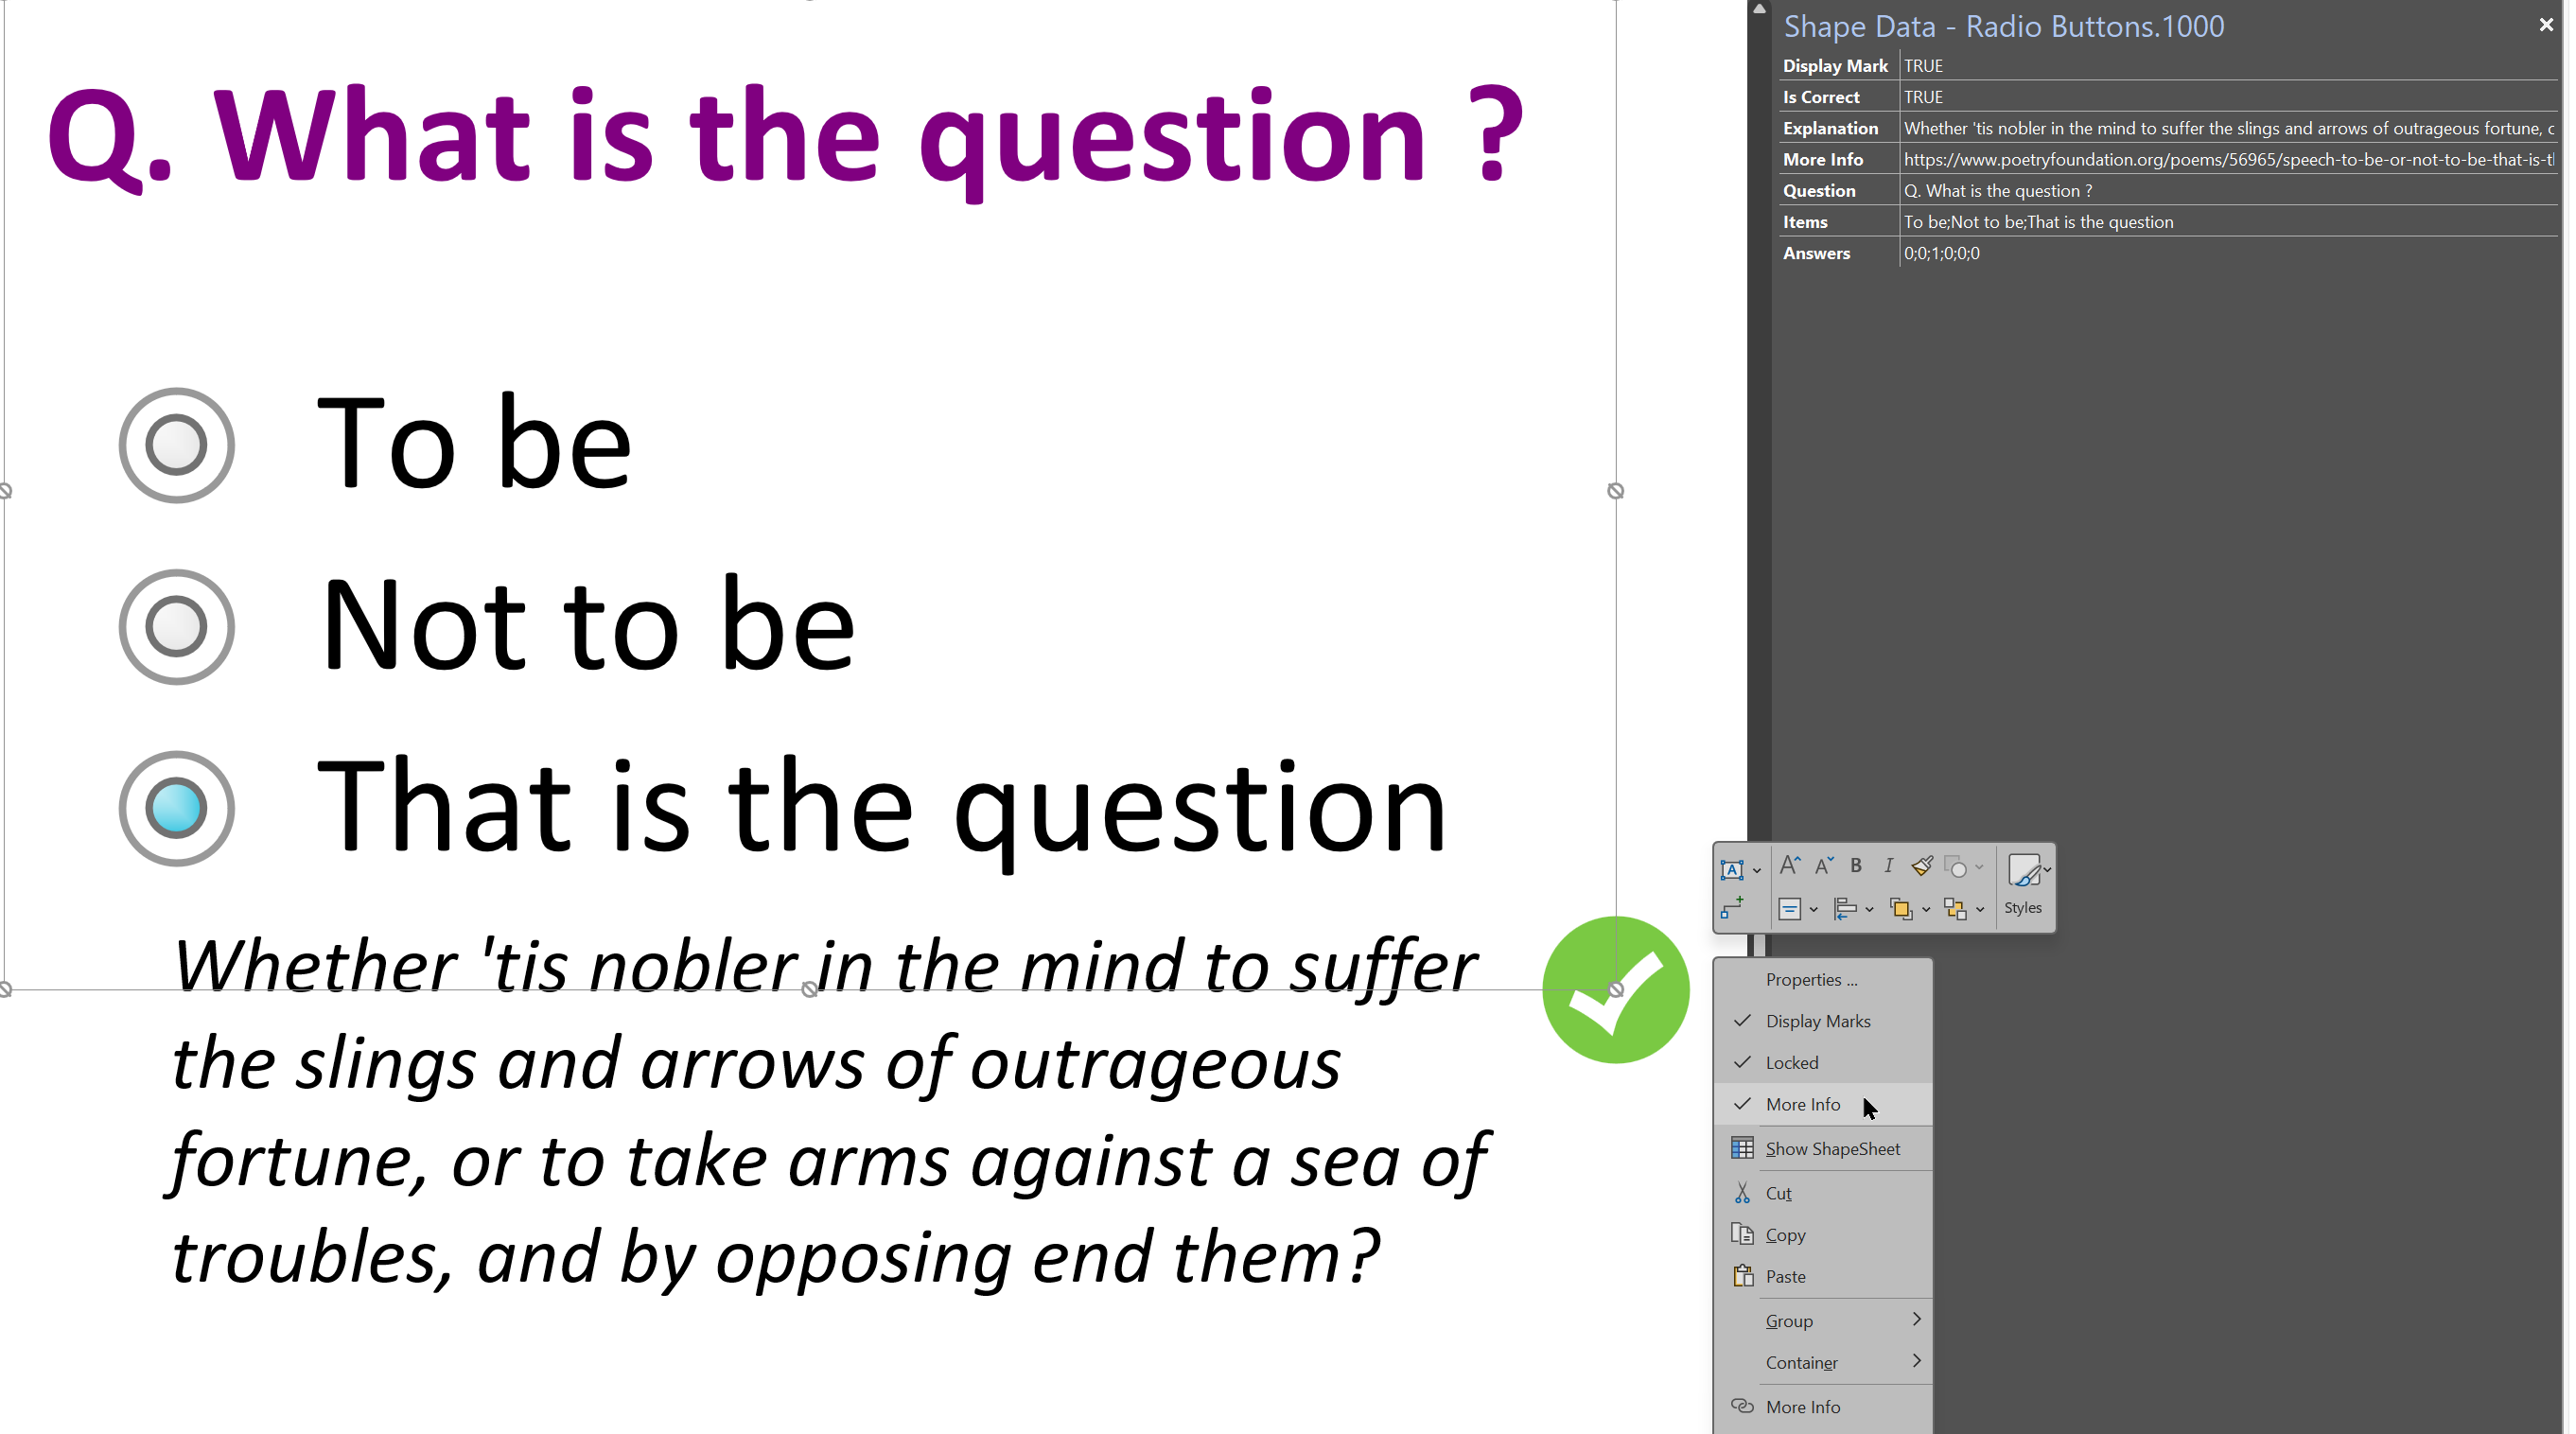
Smart Radio Buttons and Check Boxes in Visio
A recent project requires an interactive tutorial within Microsoft Visio desktop where a lot of the questions need a single answer using radio buttons, or multiple-choice answers using check boxes. I thought that this would be a great use of the list containers capability because the questions and answers could be part of the container…