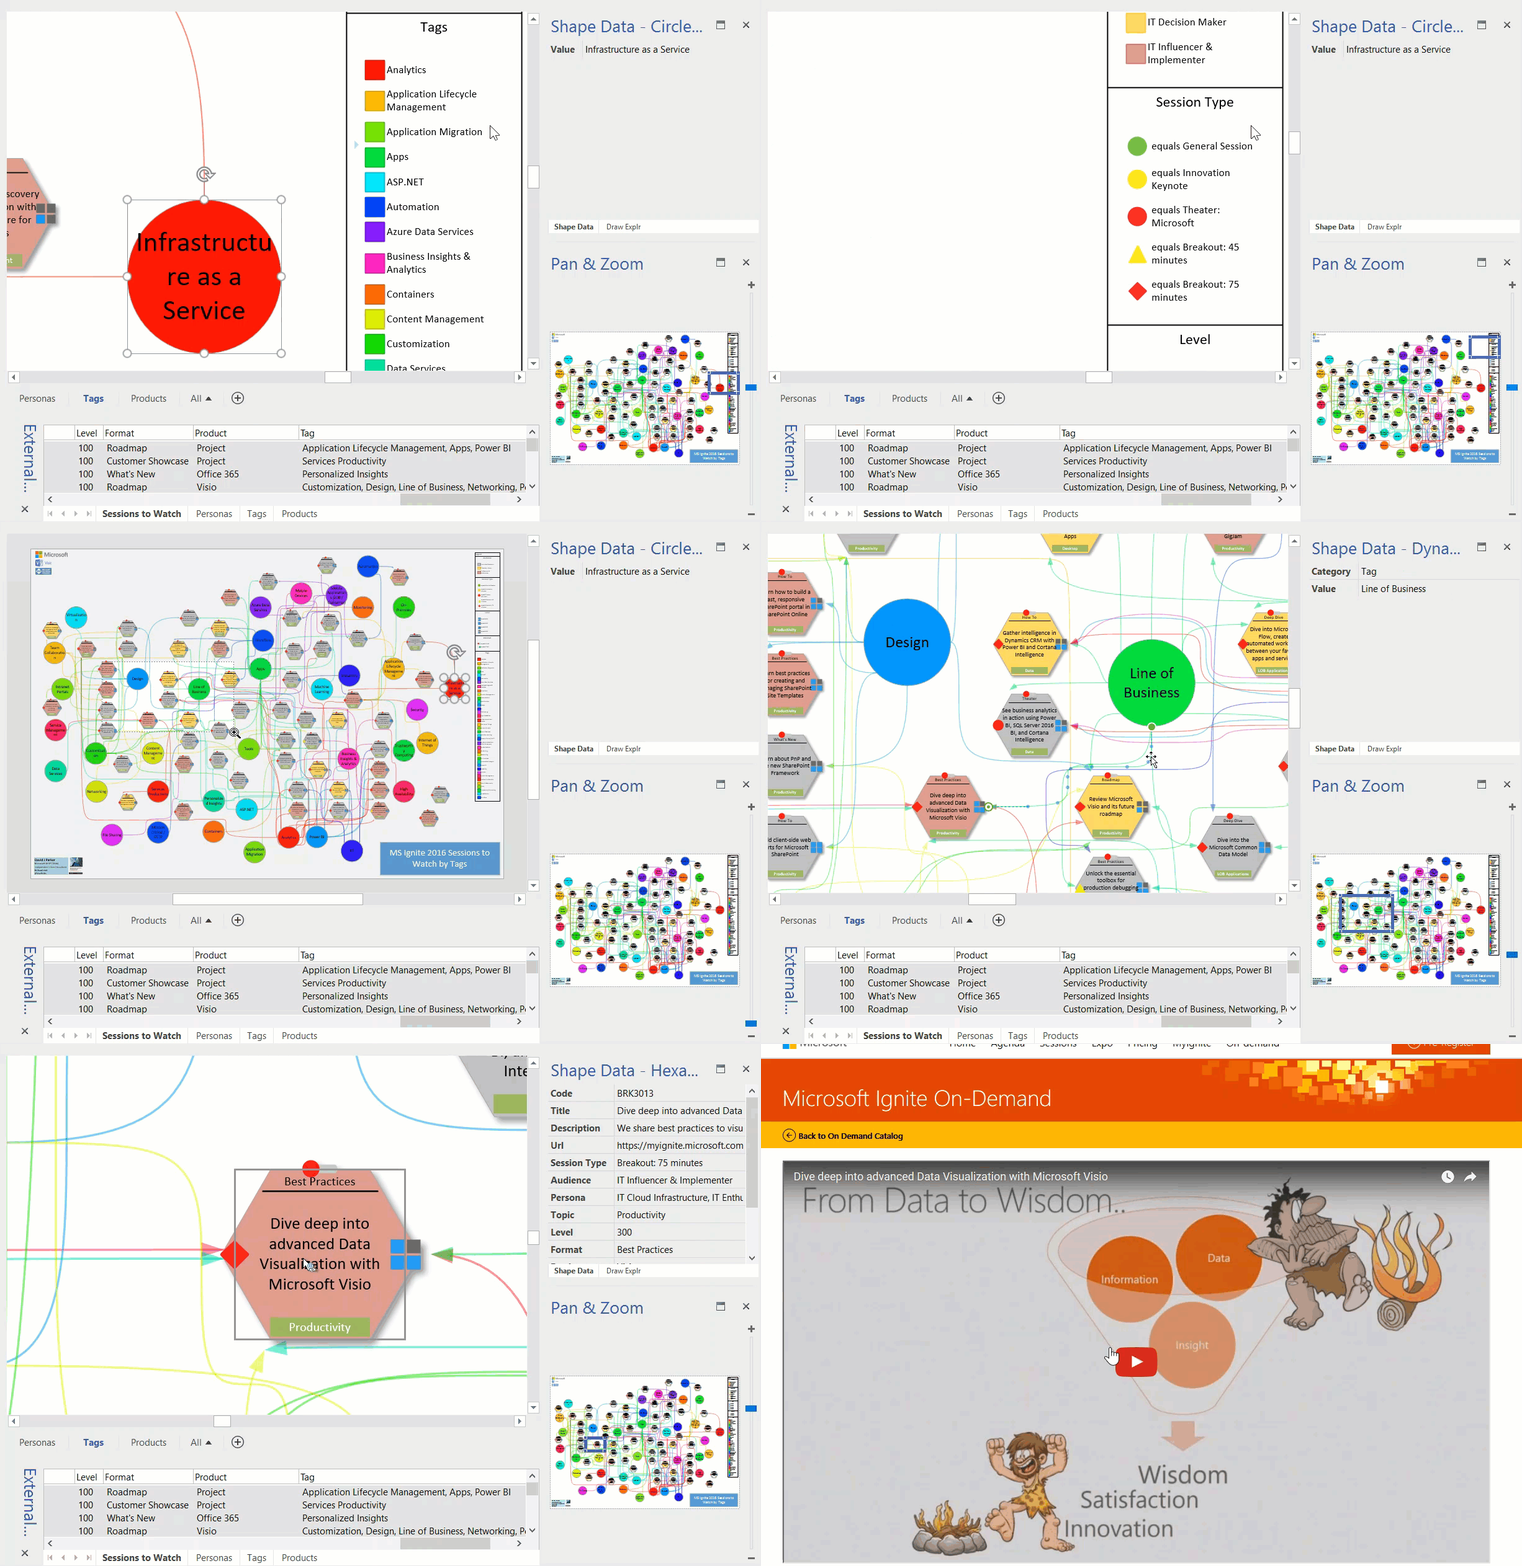
Well, MS Ignite is over for another year. I planned to visit loads of sessions, but the reality was that I spent many hours on the Visio booth. Fortunately, many of them were recorded, including ours, but I don’t have time to watch over 700 videos! So, I looked through them all and picked out 50-odd, and used Get & Transform in Excel again to create suitable queries to link to Visio.
The more I use PowerQuery, the more I like it. I was able to extract the unique values in the Personas, Tags, and Products columns which each contained comma separated lists. I data-linked these values to large circles on different pages, and data-linked the Sessions to Watch to hexagonal shapes. I then wrote a little VBA code to link the circles to the hexagons with data-linked connectors. Data Graphics was applied to all shapes, including the connectors, and a legend added. Each of the Session hexagons have an automatically created hyperlink to the On-Demand Video. I used a standard radial page layout so that I had minimal manual movement shapes.
The end result is a visual dashboard by Persona, Tag and Product to open the videos for the sessions I want to watch.
