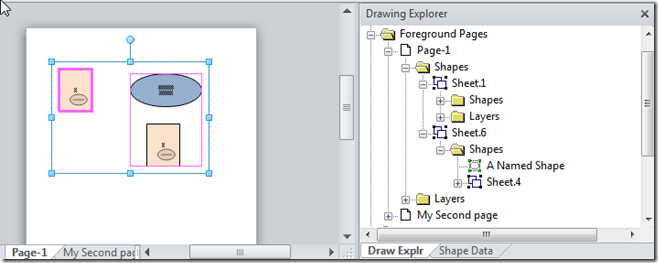
So, we can now all talk about Microsoft Office 2013, and, in particular, Visio 2013! Read about it at http://visio.microsoft.com/en-us/Preview/visio-benefits.aspx and find resources at http://msdn.microsoft.com/en-us/library/fp161226 . As a Visio MVP, I am delighted to see some of the exciting new capabilities. Of course, there are some tremendous visual enahancements, but the really big thing for me is the adoption of the Metro file format.
The Metro file format is the zipped-up, multi-part xml format used by Word, Excel and PowerPoint for several years already, but Visio missed out on this in the 2010 version, probably because so much effort was required to implement the FluentUI (Ribbon).
It may seem a small change, especially since Visio already had an XML format, but this new file format opens up so much more possibilities! One immediate benefit is the tighter integration with SharePoint … no more need to save into Visio Web Drawing format! Other benefits include Duplicate Page, Change Shape and Co-authoring … All of these must have been much easier to implement with the new Metro format. I’ll be blogging more about Visio 2013 in the future, but now I need to go explore …
Visio
Selecting Nodes in Visio PivotDiagrams
Microsoft Visio 2007 introduced PivotDiagrams to Visio Professional, and continues unchanged in Visio 2010 (see http://office.microsoft.com/en-us/visio-help/create-a-pivotdiagram-HA010357089.aspx ). These diagrams are a great way to analyse and visualize data by allowing you to breakdown data in a similar manner to PivotTables and PivotCharts in Excel. Any one who has both Microsoft Project and Visio installed will have seen that all of the extra diagram reports are in fact Visio PivotDiagrams. However, I have always found that selecting the nodes you want is difficult. In this article I will explain the problem and provide a solution … a new free add-in called PdSelect.
Update : Added new features 20 Jul 2012
In the following example PivotDiagram, I used the built-in OrgData Excel workbook as the data source. This example workbook is normally used to demonstrate the OrgChart Wizard, but I have used it to provide an alternative breakdown by Department / Reports_To / Name.
[Read more…] about Selecting Nodes in Visio PivotDiagramsAutomating Page.DropLegend in Visio 2010
Visio 2007 introduced Data Graphics but, in my opinion, didn’t provide any automatic legends for the icons and colour by value options. That is why I wrote DataLegends (see http://www.bvisual.net/Products/DataLegends.aspx ) as an add-in for Visio 2007 several years ago. This oversight was remedied in Visio 2010 when Microsoft introduced their own legends (which were not totally dissimilar to my own), and also added a method (Page.DropLegend) for programmers to automate this task.
MVP Sessions wheel
I wasn’t sure whether to call it a wheel or a clock-face, but since there are 24 MVP Visio 2010 sessions (see http://visio.microsoft.com/mvpsessions ) I decided on a wheel … so in this blog I present my alternative interface into these sessions, created in Visio of course!
I created an Excel workbook in which I listed all of the sessions, their descriptions, and links to the video and any supporting files. I then created the wheel diagram, and used Link Data to Shapes to automatically add Shape Data rows and hyperlinks to each shape, and Data Graphics to automatically colour each shape.
Finally, I saved the Visio page as web pages (VML, XAML and SVG format output), and as pdf.
Open the VML web output : http://www.bvisual.net/resources/mvpsessionsIE.htm
Open the SVG web output : http://www.bvisual.net/resources/mvpsessions.htm
Open the XAML web output : http://www.bvisual.net/resources/mvpsessionsX.htm
Open the Visio file : http://sdrv.ms/NYHH8V
Open the Excel file : http://sdrv.ms/OI3EKU
Open the pdf : http://sdrv.ms/OI2i2I
UPDATE : see http://blog.bvisual.net/2013/07/08/mvp-sessions-for-getting-started-with-visio-2010/
Creating a Custom Org Chart Template with Extra Properties
A Visio user recently asked how to add a salary amount for an Org Chart person automatically, based on their selected Level. I thought it was a bit long to answer in the forum, so I have written my answer below. It demonstrates how you can have your own custom template that works with the Organization Chart add-on in Visio.
My approach to creating a custom template that still uses the Organization Chart Add-On is to create a new drawing from the built-in template, and then to add extra properties to it.
First, select Show Document Stencil to view all of the local copies of the built-in master shapes. If they are not there, then simply drag and drop them from the built-in stencil on to the first page, and then delete the shapes on the page. This will not delete the local copies of the masters.
[Read more…] about Creating a Custom Org Chart Template with Extra Properties
Visio Date Format Pictures Affect Data Entry via the Calendar Popup
I have been creating roadmaps in Visio lately, and the client is only concerned with the months and years, so I thought it would be sensible to use a Date Format Picture to display only the month and year in the Shape Data window. What I did not expect is that the mere existence of this Date Format Picture would alter the actual date stored in the cell. In this blog, I layout my concerns about the Calendar popup that is provided for Date type Shape Data rows.
In the following example, I have created a shape, coloured pale orange below, and added 25 Date type Shape Data rows. I have not applied any format to Property1, but then I have applied each of the 17 suggested Date Format Patterns provided on a drop-down list in the Define Shape Data dialog. Finally, I added a further 7 patterns manually. I then selected Today as the value for every single Shape Data row:
[Read more…] about Visio Date Format Pictures Affect Data Entry via the Calendar Popup