[UPDATE July 2021 : This project has now become the subject of a Microsoft Customer Storey]
Construction projects can last many years and involve a large number of contractors and sub-contractors. It is essential that all of these different areas are co-ordinated and sequenced efficiently for effective and timely progression. This huge responsibility can often fall on the shoulders of a professional scheduler who may use applications like Microsoft Project or Oracle P6 to organize packets of work, sequence and resource them. Great as these tools are, they do not produce an output that can be easily understood on site by the managers, foremen and the tradesmen.
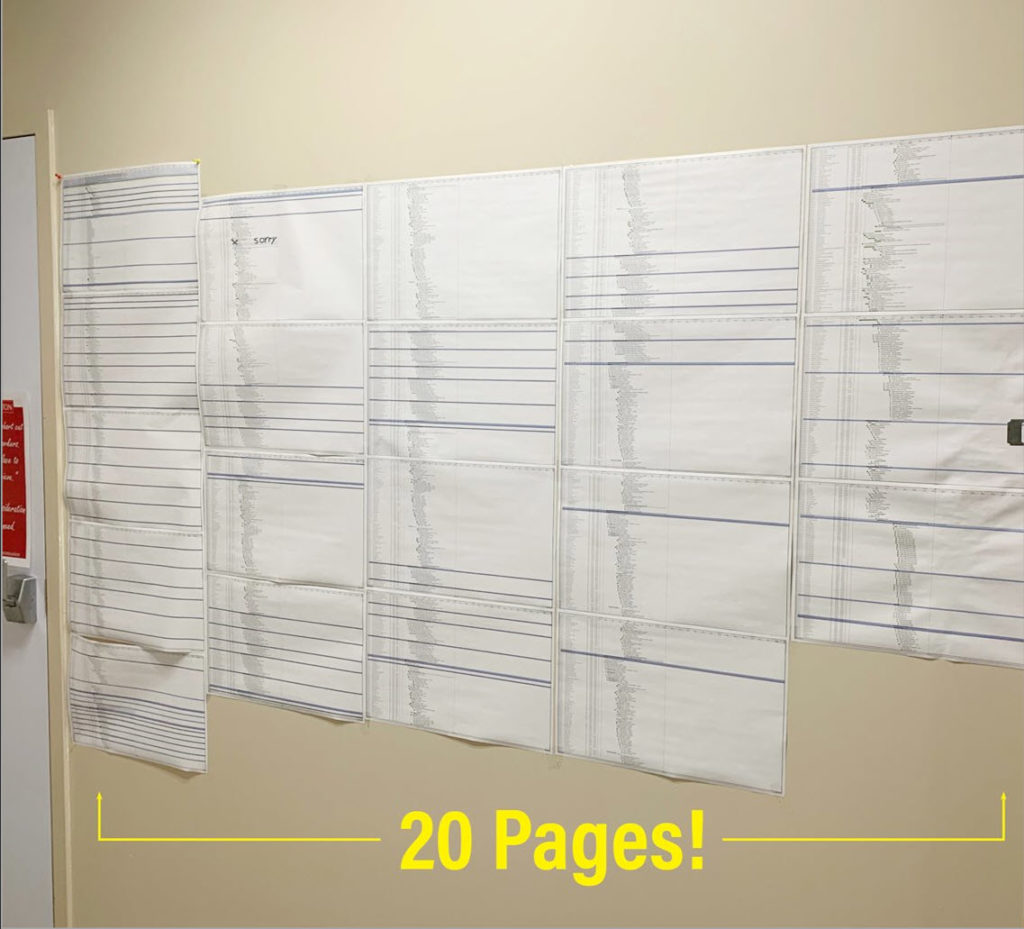
Lots of paper pages pinned to wall to try to understand the schedule 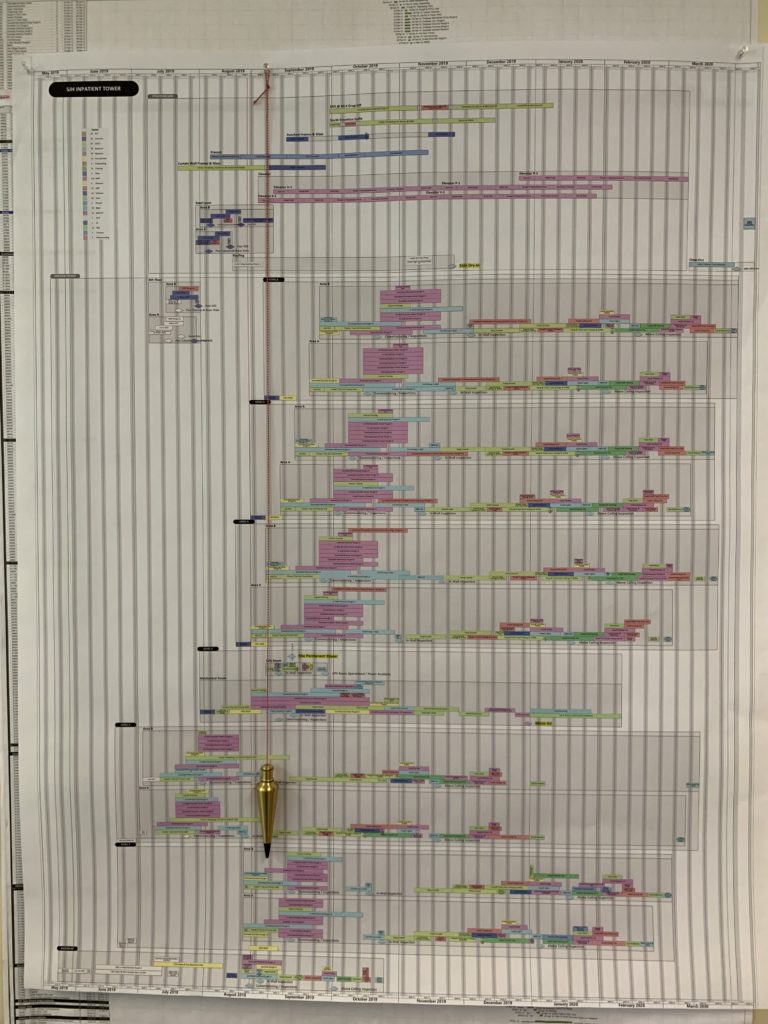
A TimeTable printed and pinned up on the wall is easy to understand
Robins & Morton provide construction scheduling, and even tried using Microsoft Visio to manually draw out diagrams to help present these complicated schedules. However, they soon realized that these diagrams need to be automatically created directly if they are going to be useful. Therefore, they sought out some Visio expertise, and asked bVisual, whose owner, David Parker, used to be an RIBA architect himself, and used to work on construction projects. David could understand the requirements of the R&M, and used his years of Visio expertise to enhance the proposed solution, which came to be known as TimeTable. R&M created a new company, BuildFore, develop this, and other construction project related applications.
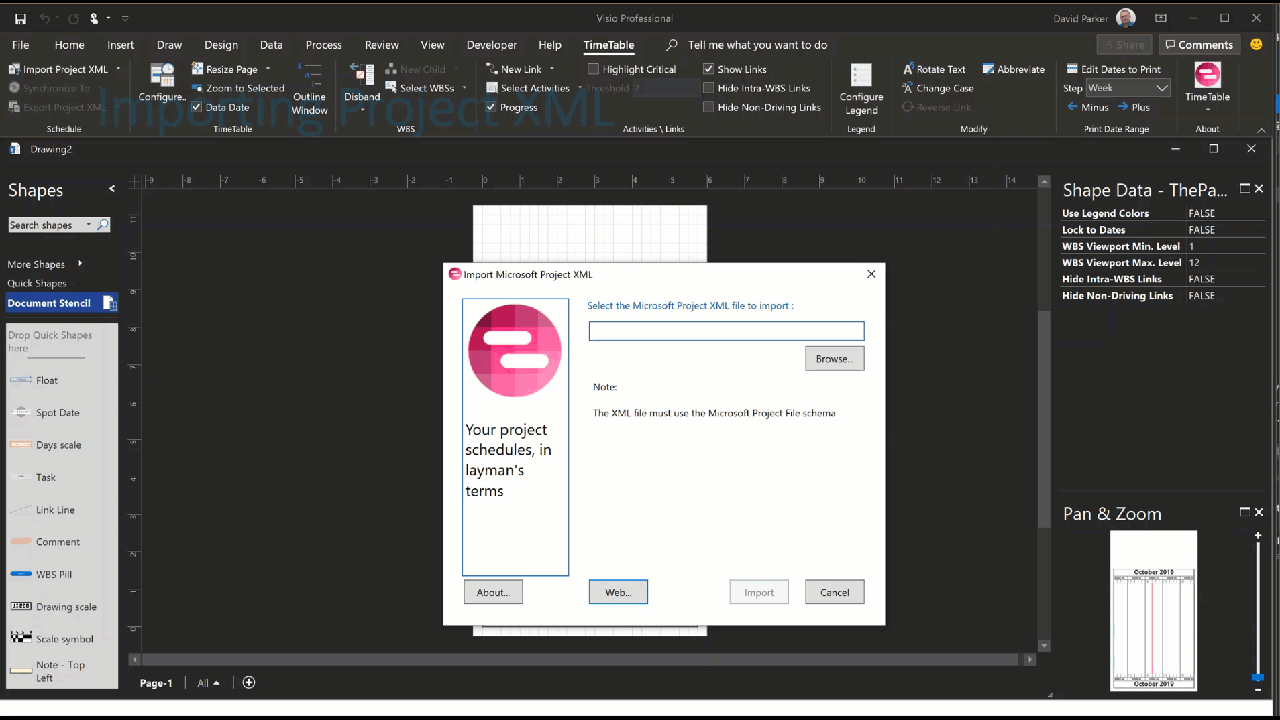
Importing the Project XML
Microsoft Project can export XML, and Oracle P6 can export in Project XML format, so TimeTable can import this XML and summarize it with the WBS codes. The height of the drawing is dependent on the number of summary codes selected, and the width of the page can be controlled by selecting the date range and the time scale
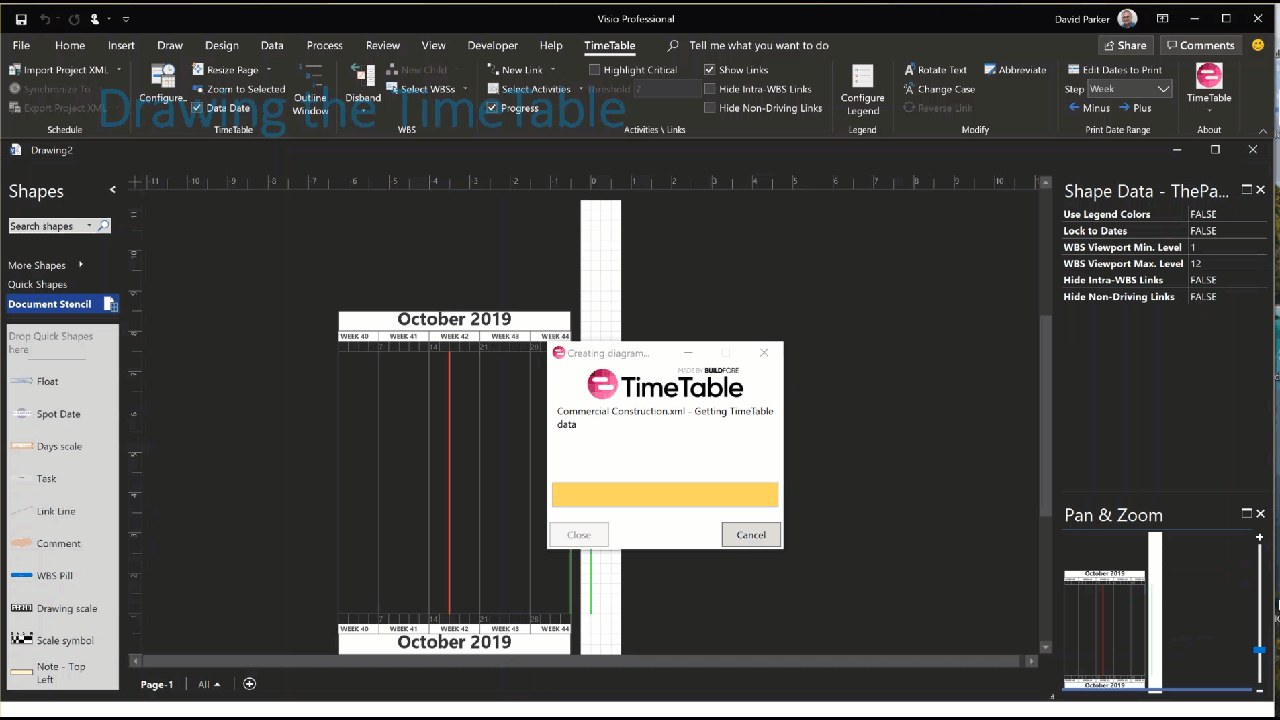
Drawing the TimeTable
The TimeTable is then automatically drawn using the selected summary tasks, date range and time scale.
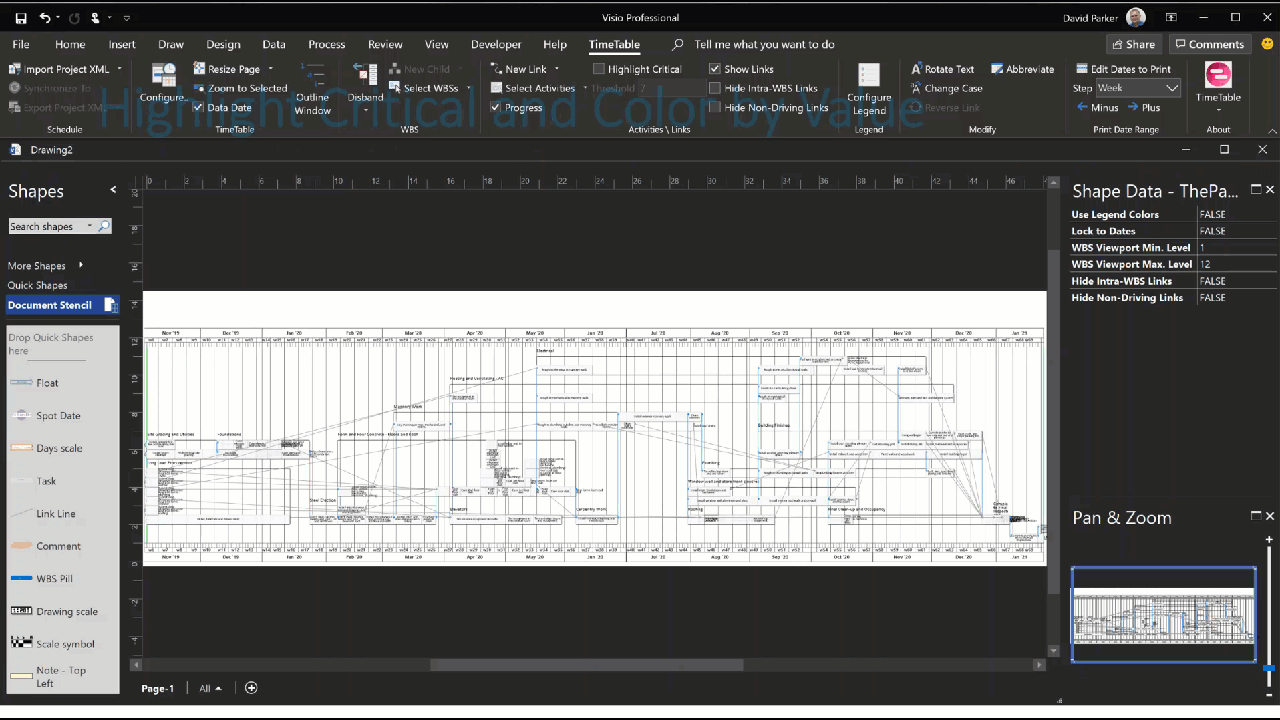
Highlight Critical and Color by Value
Once drawn, the critical tasks can be highlighted, and all of the activities can be colored by a a selected range of values, such as the resources that were imported from the project XML.
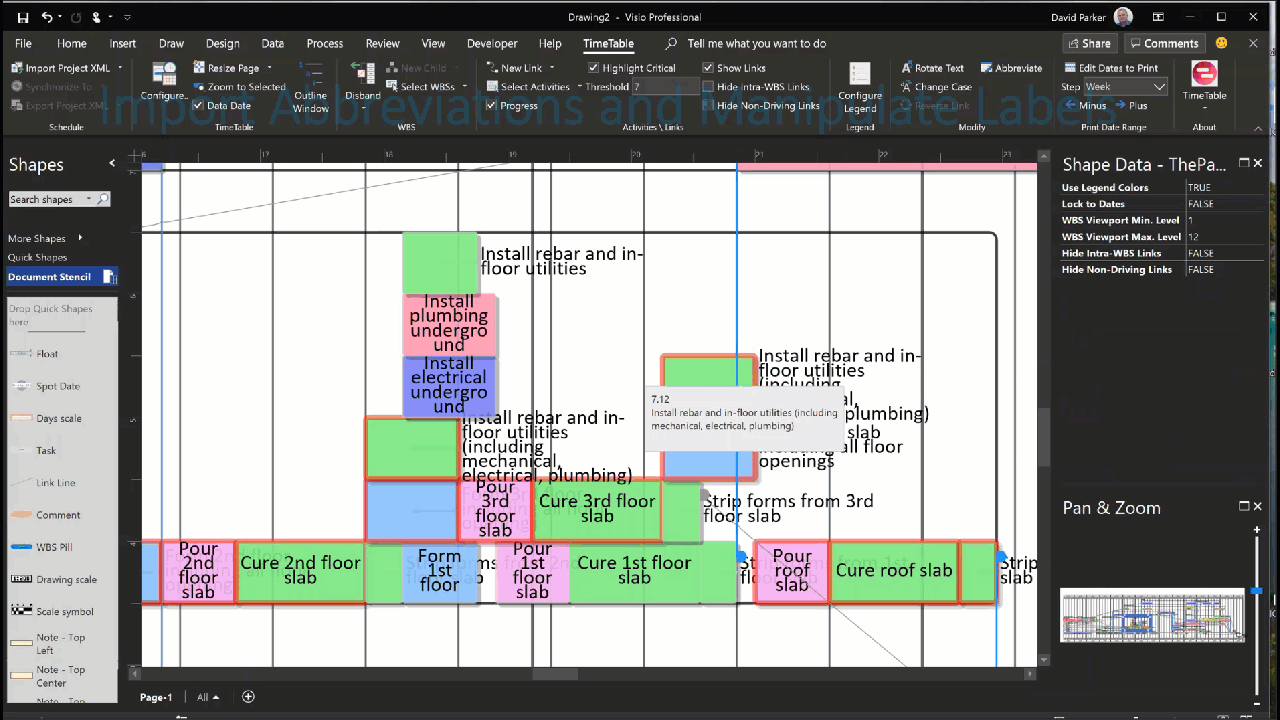
Import Abbreviations and Manipulate Labels
The activities are automatically labelled with their names, but these may be quite verbose, so a list of acceptable abbreviations can be imported to shorten the text length. If the labels still don’t fit within the activity shape, then they font size can be reduced, the text manually edited, or the label repositioned or rotated.
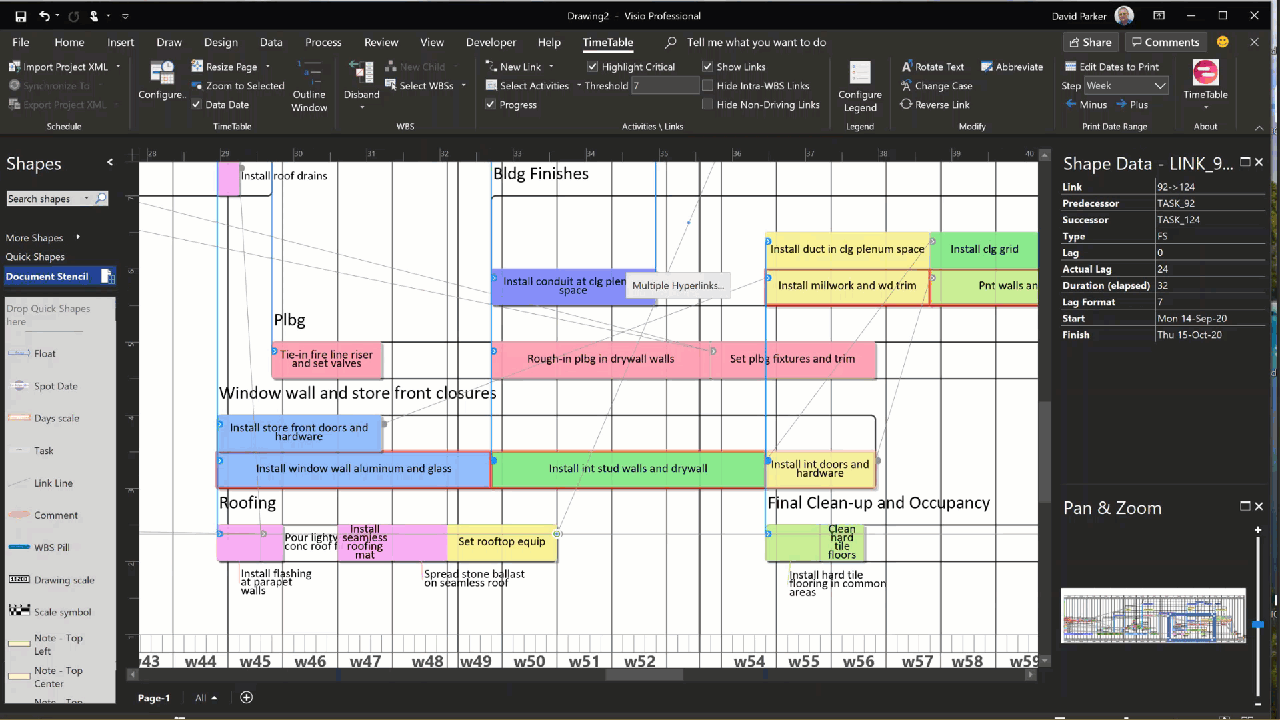
Hide Non-Driving Links and Follow Links
The number of optionally displayed links betwen activities can be filtered by hiding the non-driving and/or intra summary task links.
Hyperlinks are automatically added to each link yo make it easy to quickly navigate between the predecessor and successor tasks.
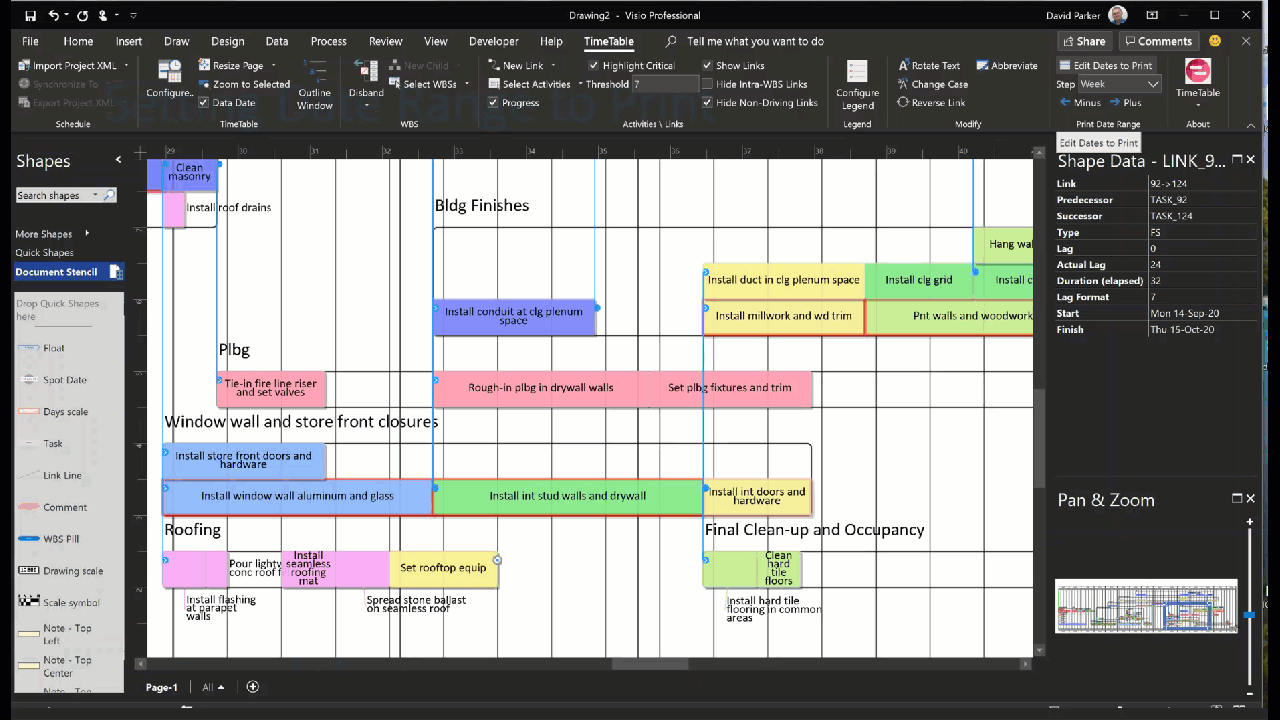
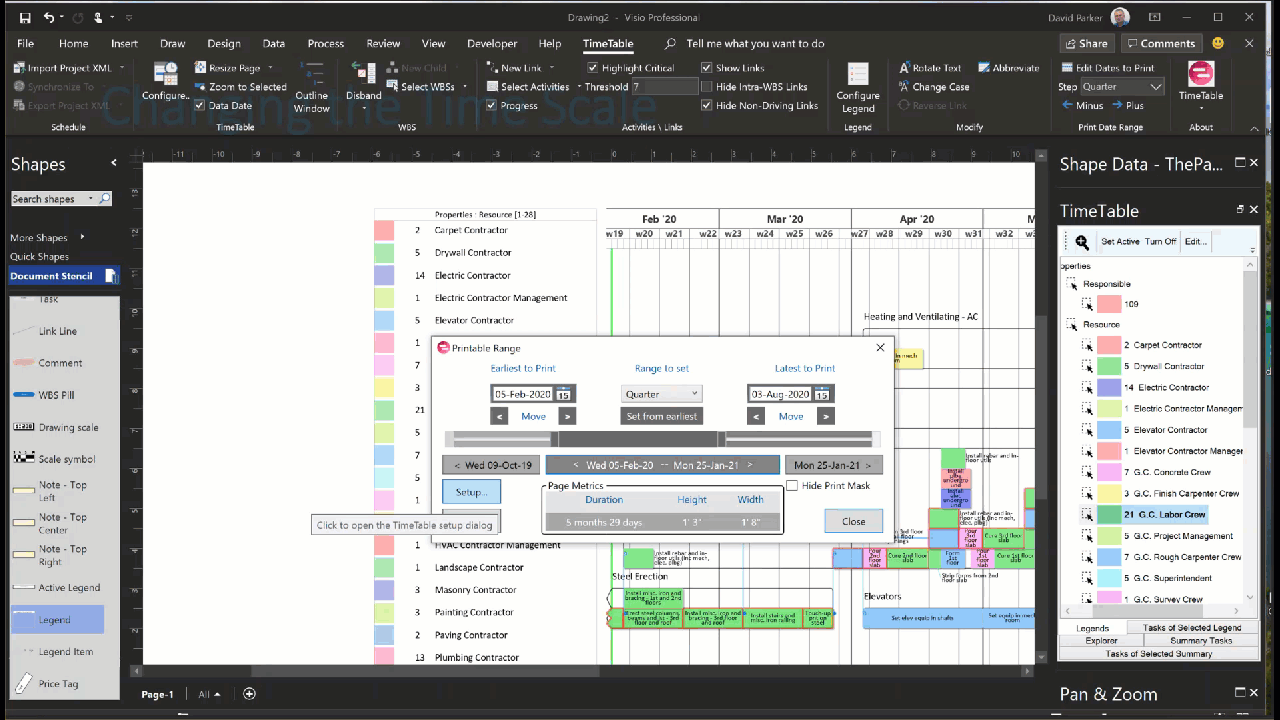
Setting the Data Range to Print
Although it is possible to plot very wide TimeTables on long pieces of paper, there are times when the focus needs to be a on a narrower date range. Moreover, this data range may need to shifted on a week, or a month, a quarter or even a year.
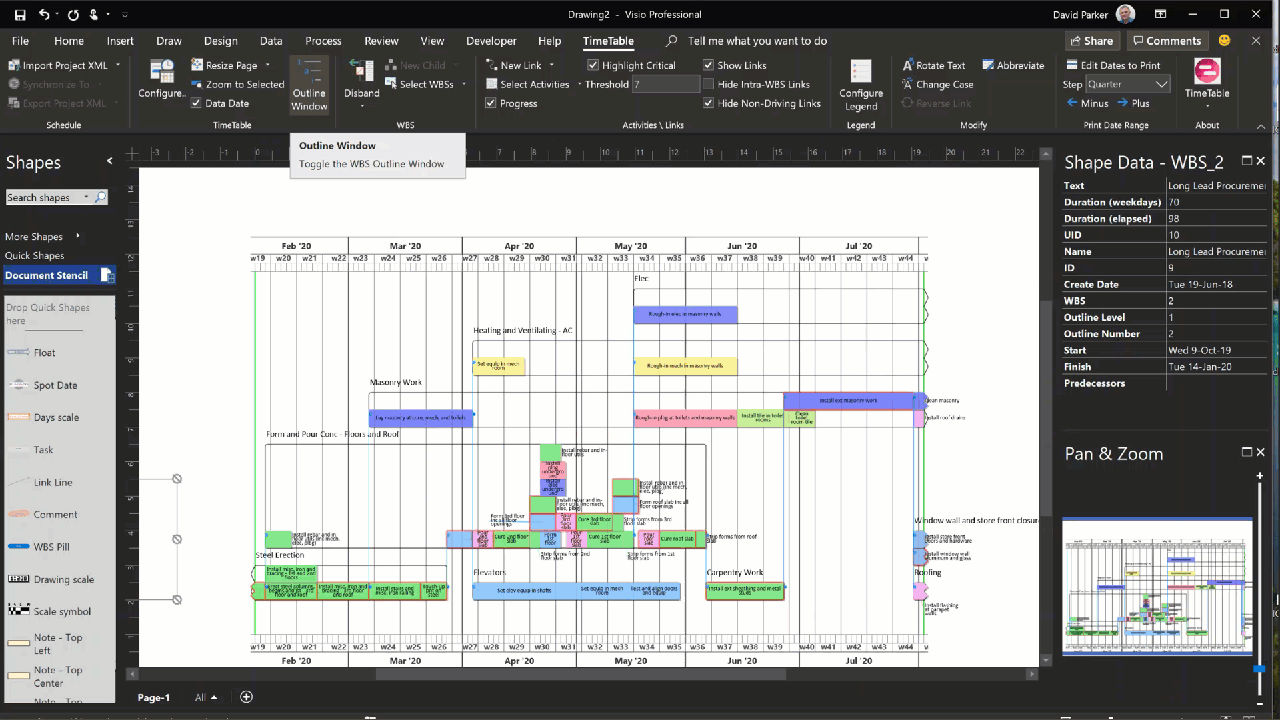
Finding with the Outline Window and Adding a Legend
The Outline Window shows a hierarchy of all of the summary tasks, and can be used to highlight or zoom into a summary task. It also lists the activities and milestones of the selected summary task, and can be used to highlight or zoom to them too.
Similarly, any legends can be used to find all of the activities and milestones of a selected one …. even if they are outside the pritable range.
Changing the TimeScale
The Time Scale can be varied from 1 day per inch to 1 day per quarter of an inch, with or without weekends, and from 1 week per inch to 1 week per quarter of an inch. This greatly varies the total width of the TimeTable for viewing or for printing.
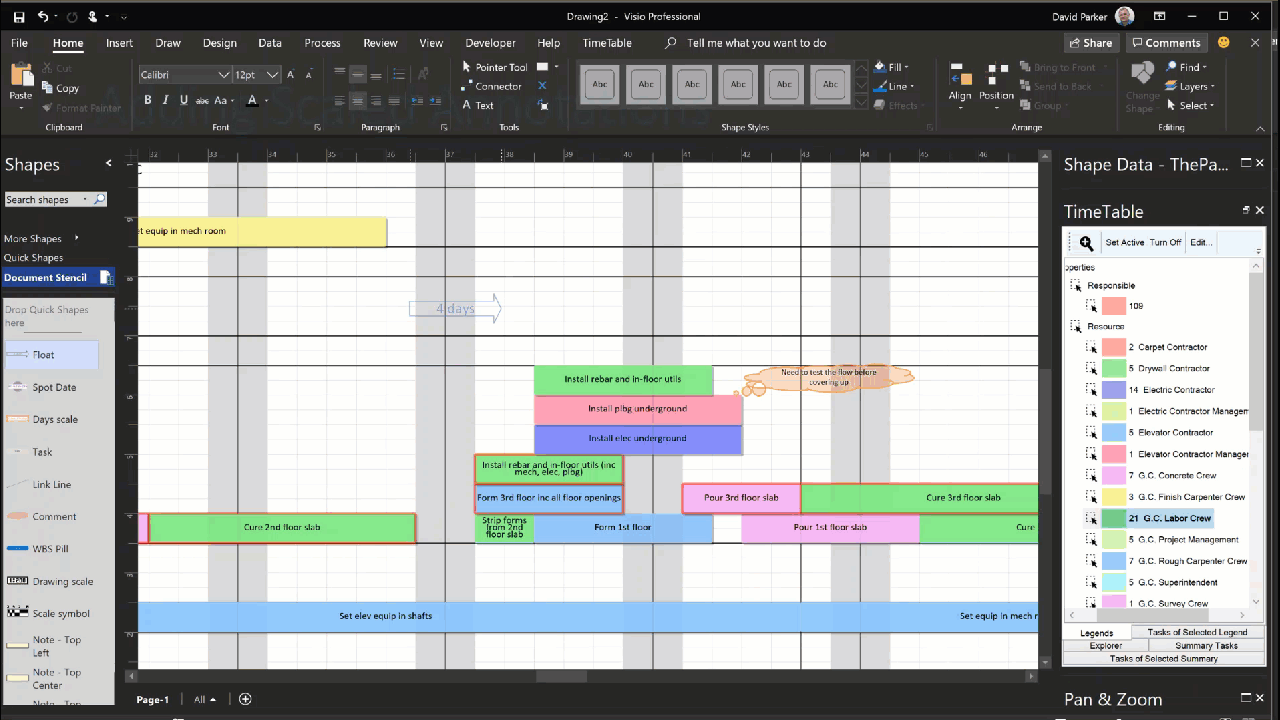
Adding Scaled Annotations
The TimeTable page is divided horizontally into days, but the actual width of these days varies with the Time Scale selected. Os, when the user wants to add shapes to show the elapsed days from point A to B, or to highlight a particular date, then scaled annotations make this easy. They will stay in the required position when the printable data range is moved, and they will progressively disappear when they go beyond the start and end dates.
Inserting Informational Notes
Informational notes can be added by insering a reference to many of the properties of the TimeTable shape.
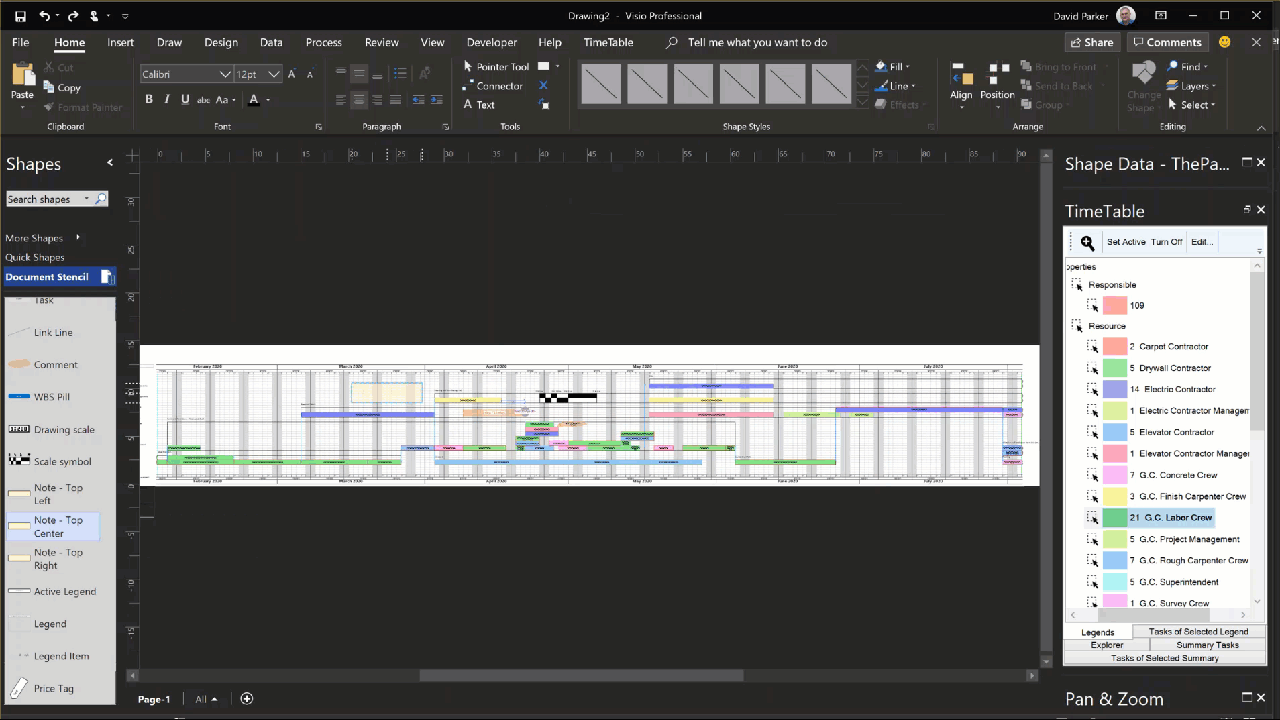
An example TimeTable
TimeTables can be quite wide if they are intended to be printed for display on the wall of a construction site hut, or they can be sliced by date ranges to suit digital documentation. The embedded Visio TimeTable page below can be panned and zoomed.
Related blog articles
TimeTable at RMConnect 2022
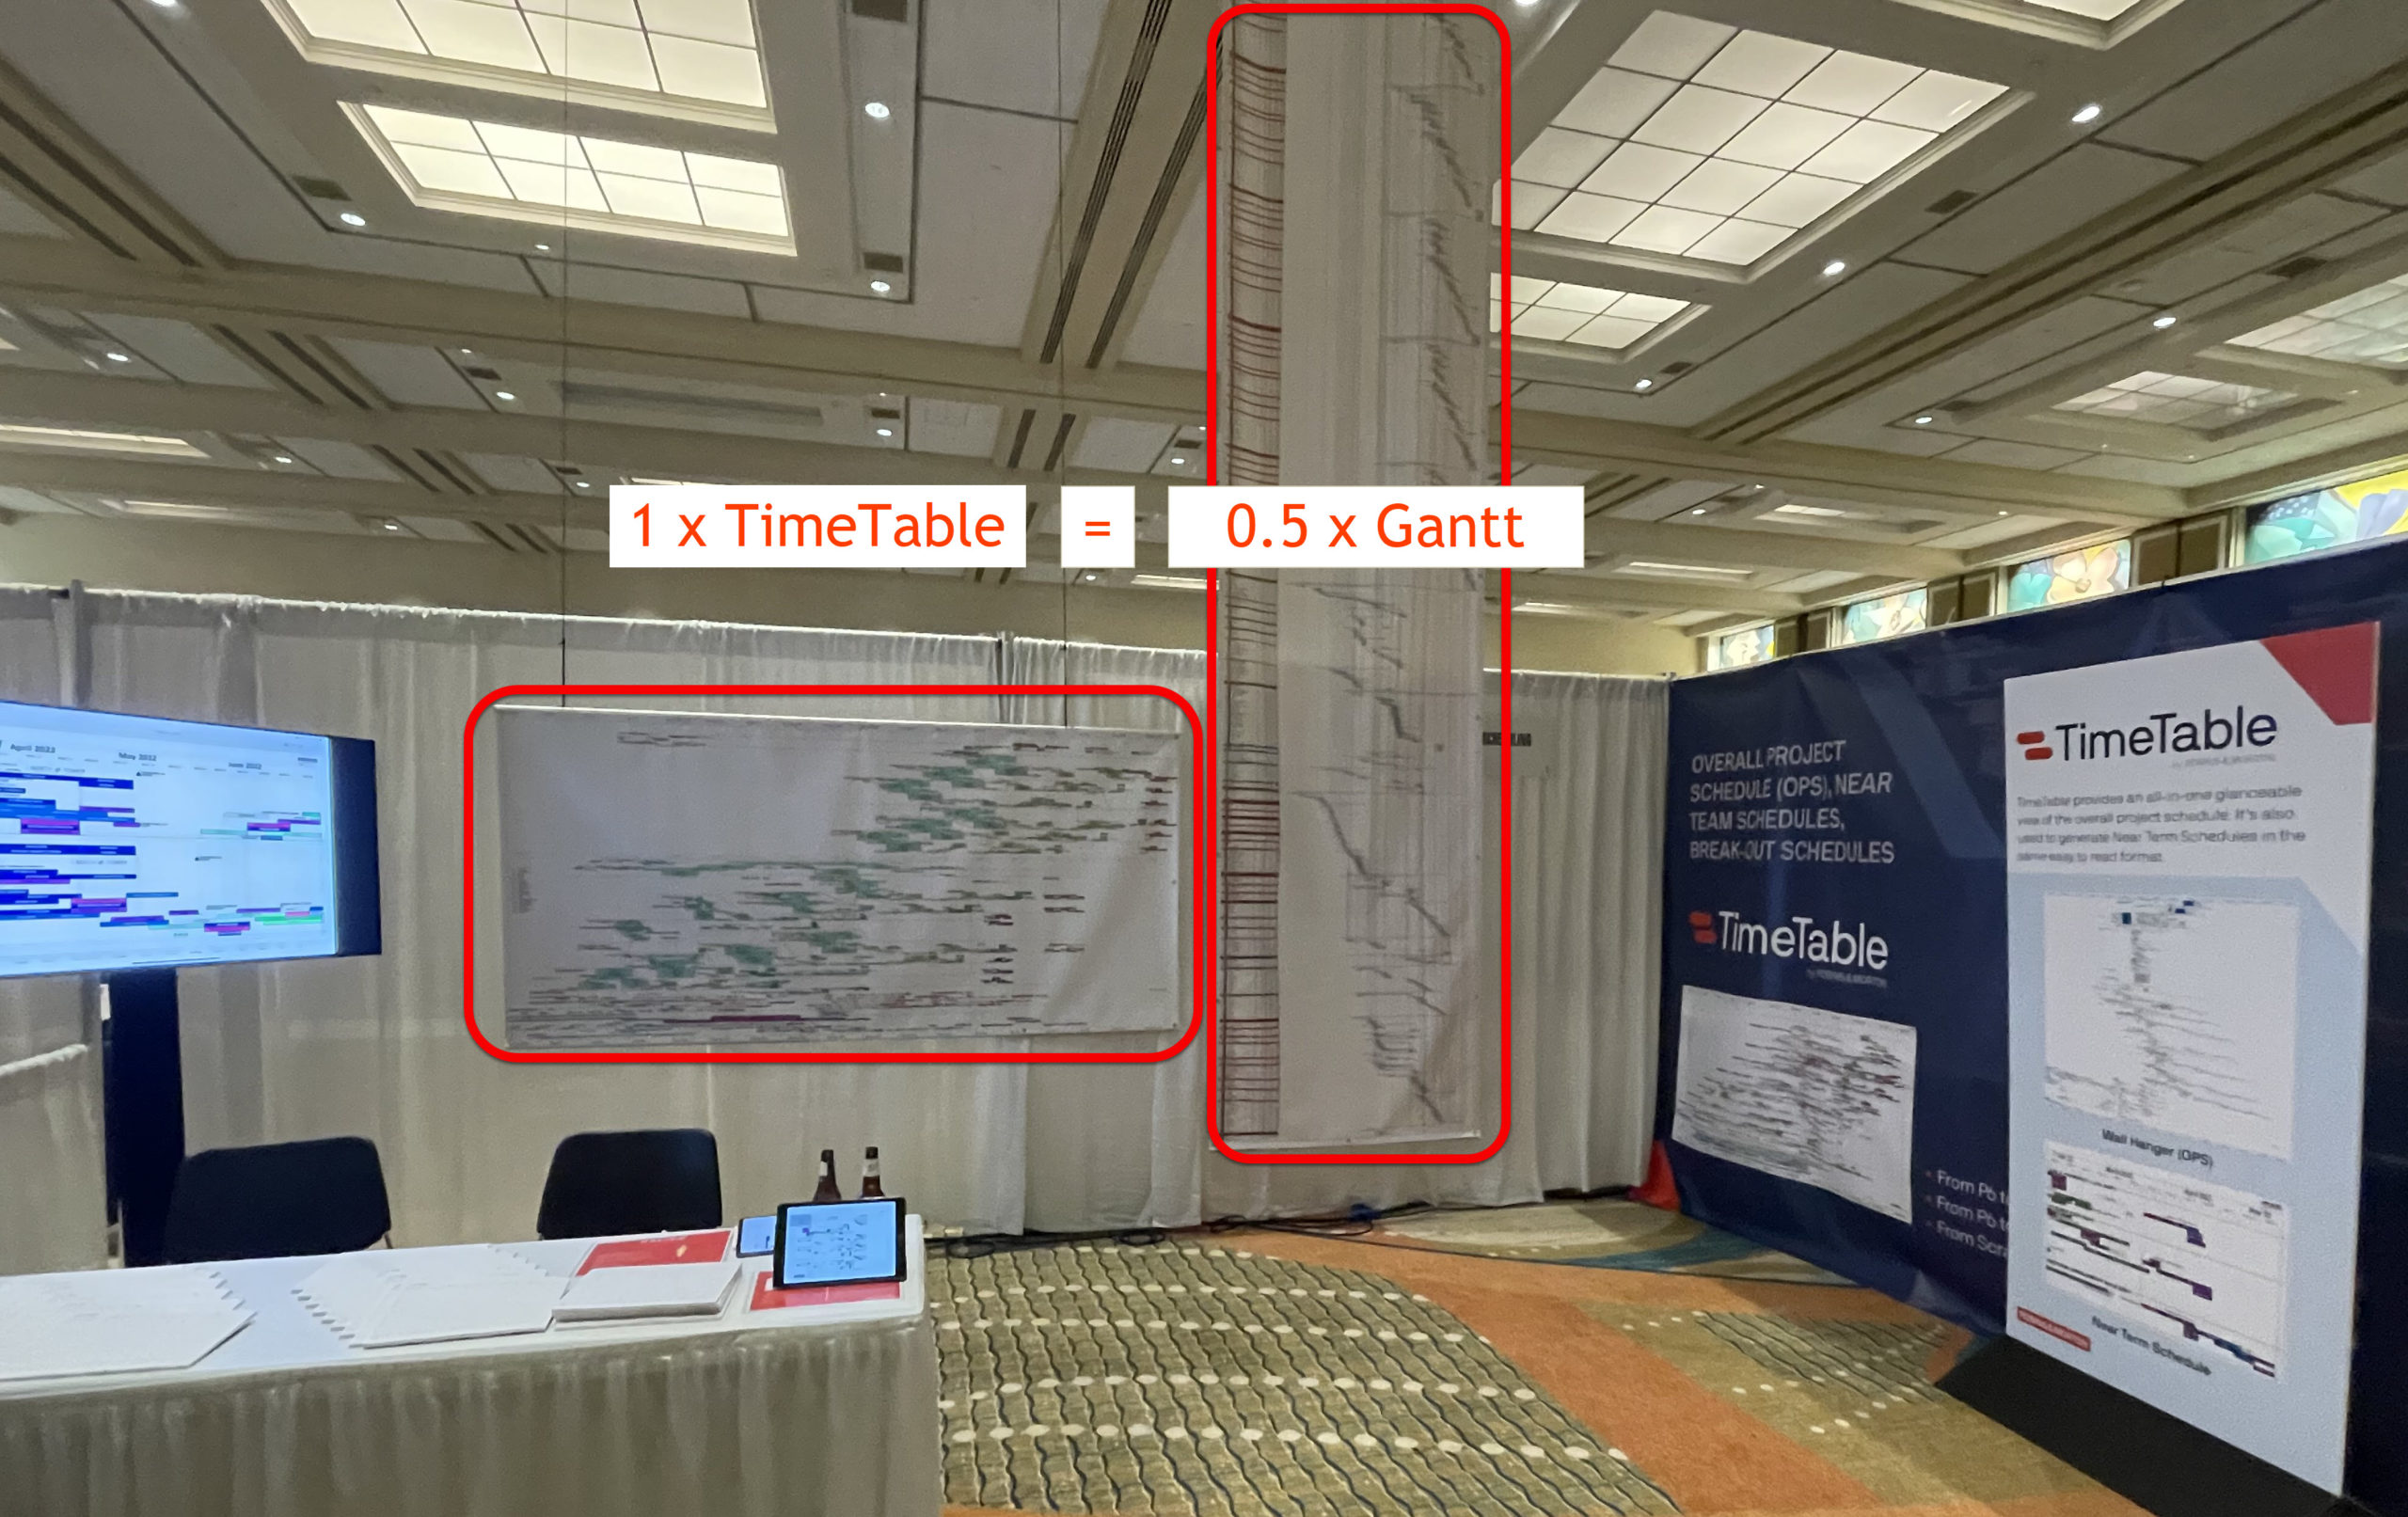
I was privileged to be invited to the biennial Robins & Morton conference in Orlando recently, where I assisted in presenting TimeTable to the hundreds of attendees there. A single wall-hanger (OPS) TimeTable Visio diagram automatically drawn from #OraclePrimaveraCloud data, is a condensed version of the same data printed as a Gantt chart some six…
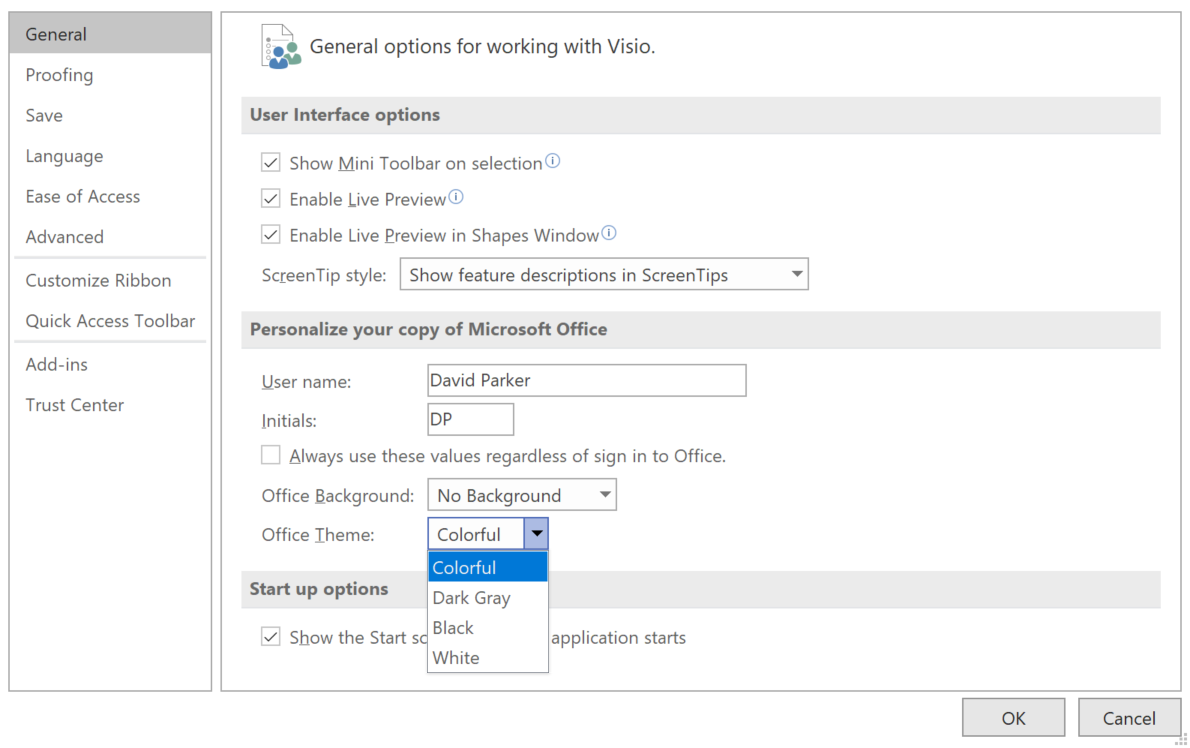
Getting the Microsoft Office Theme Value
I am working on a Visio VSTO project where I need to synchronise a UI element with the current session Microsoft Office Theme. At first, I thought that there would be some way of getting a value from the Visio object model, but I was wrong… The Office Theme can be selected from either the…
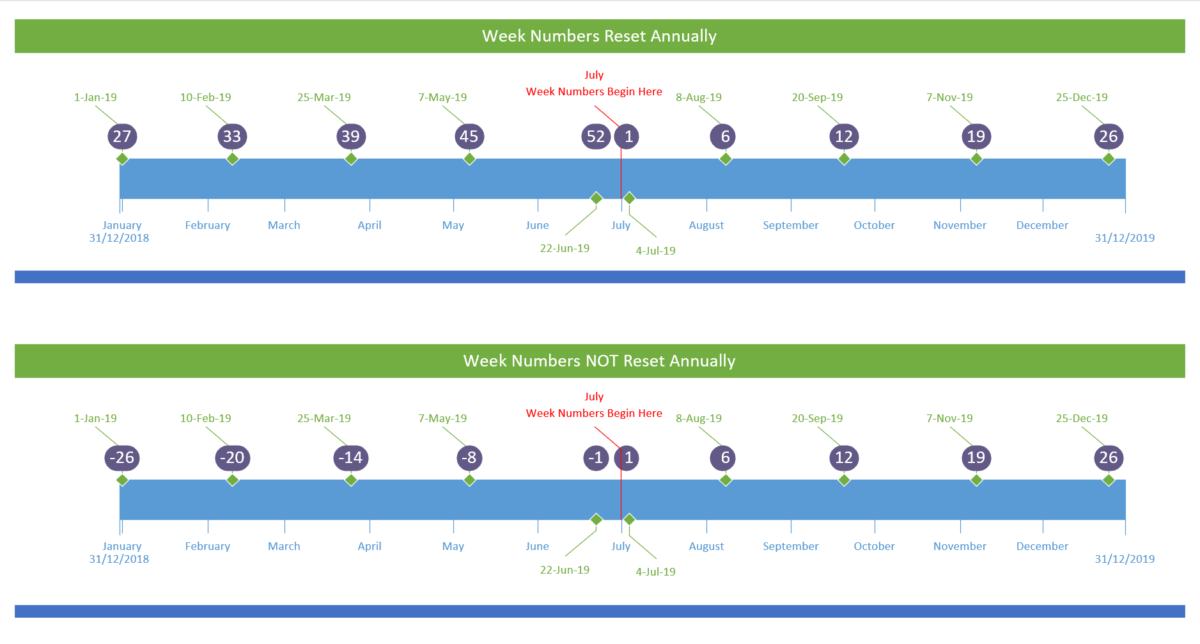
Writing a WeekNum(…) function for Visio
Learn how to write a WeekNum() function for Visio ShapeSheet, just like Excel’s!
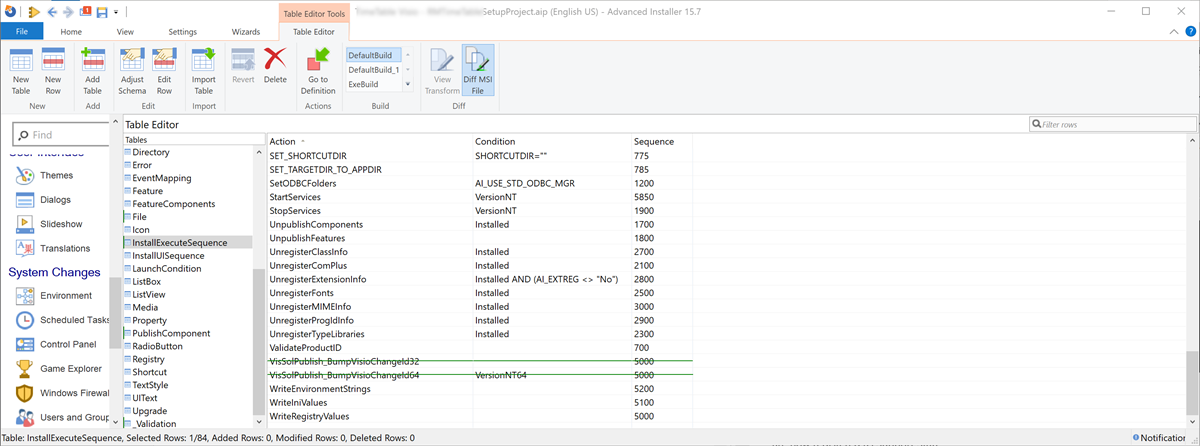
Using Advanced Installer with Viso VSTO Add-Ins
Read how I used Advanced Installer with my Visio VSTO add-in
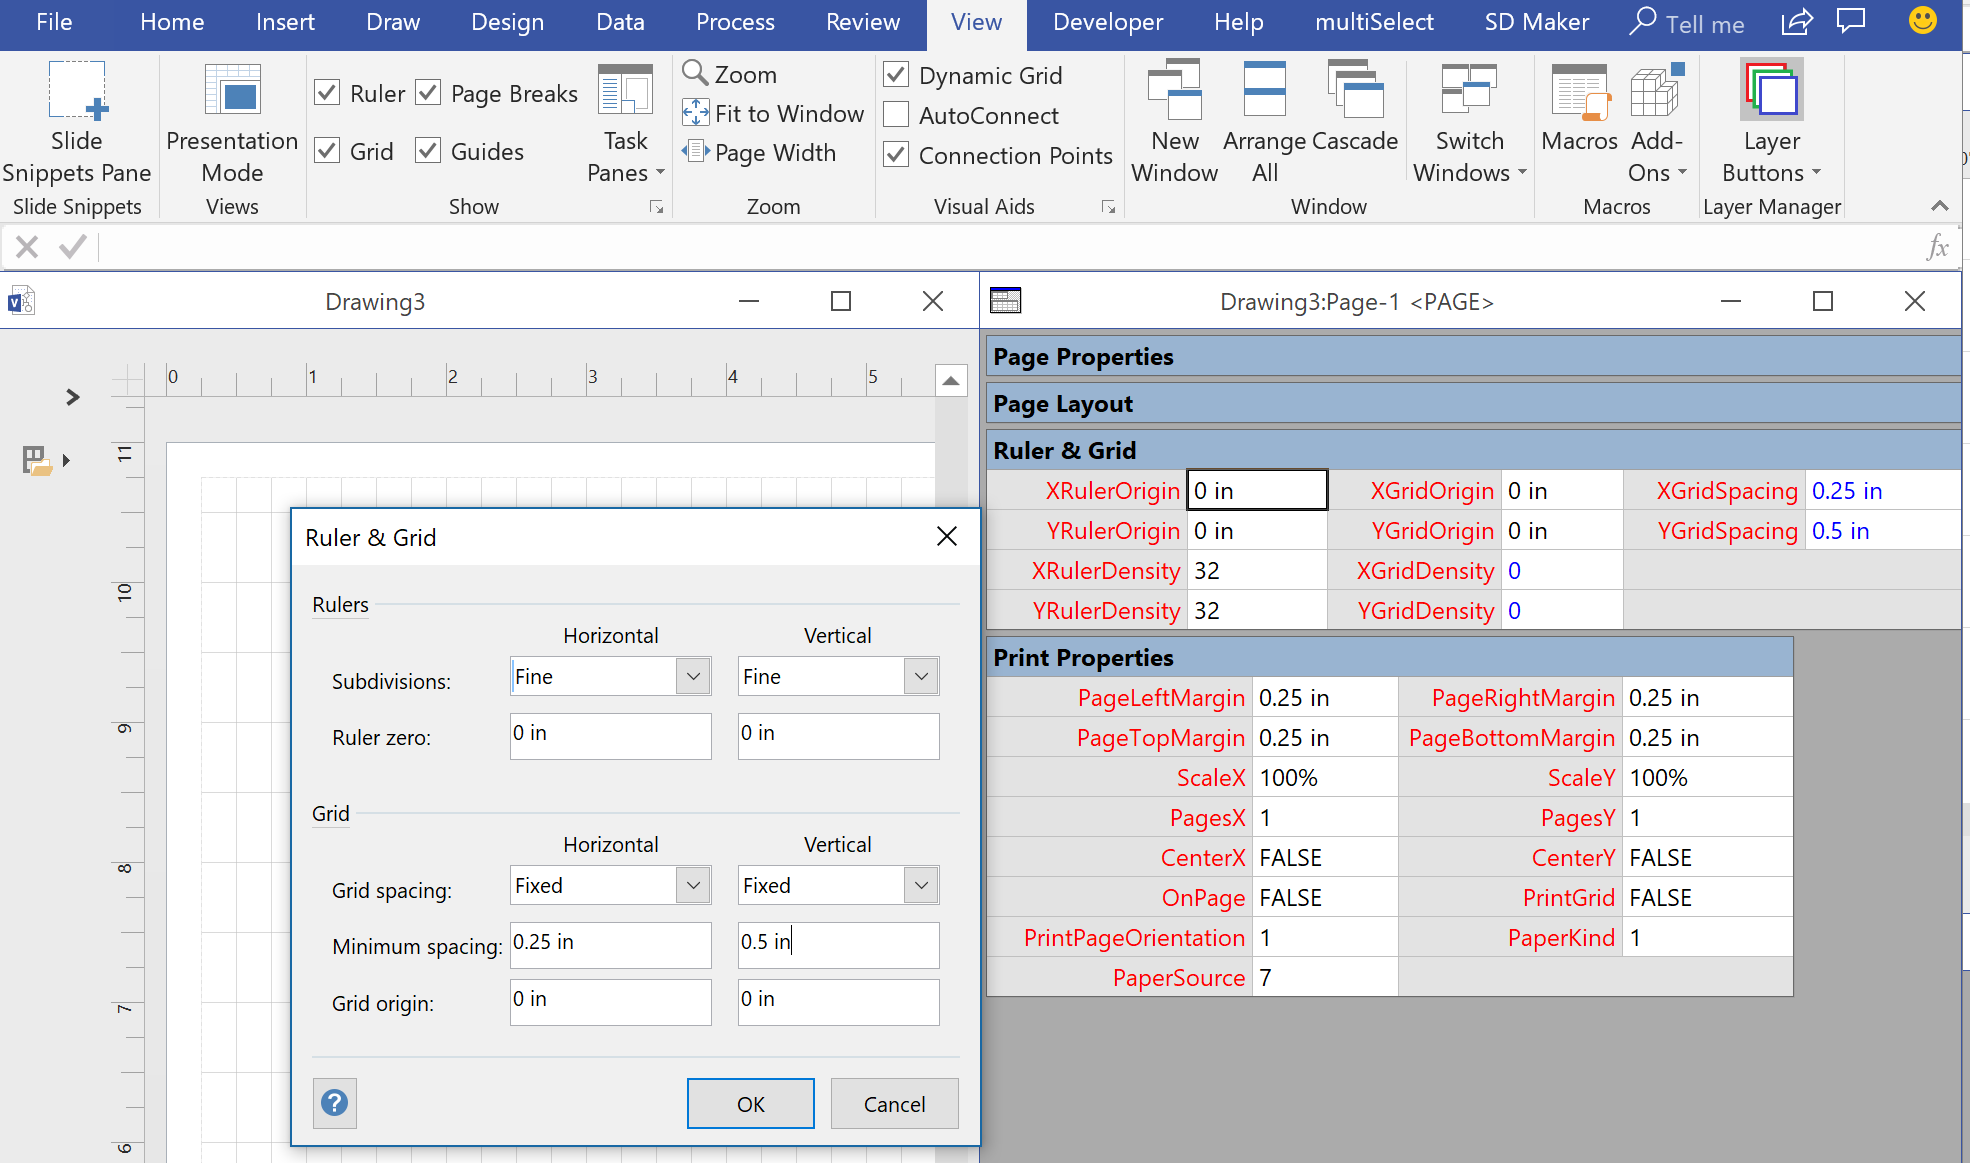
Really Snapping to Grids in Visio
Learn how to ensure that Visio shapes snap and size to fixed grids
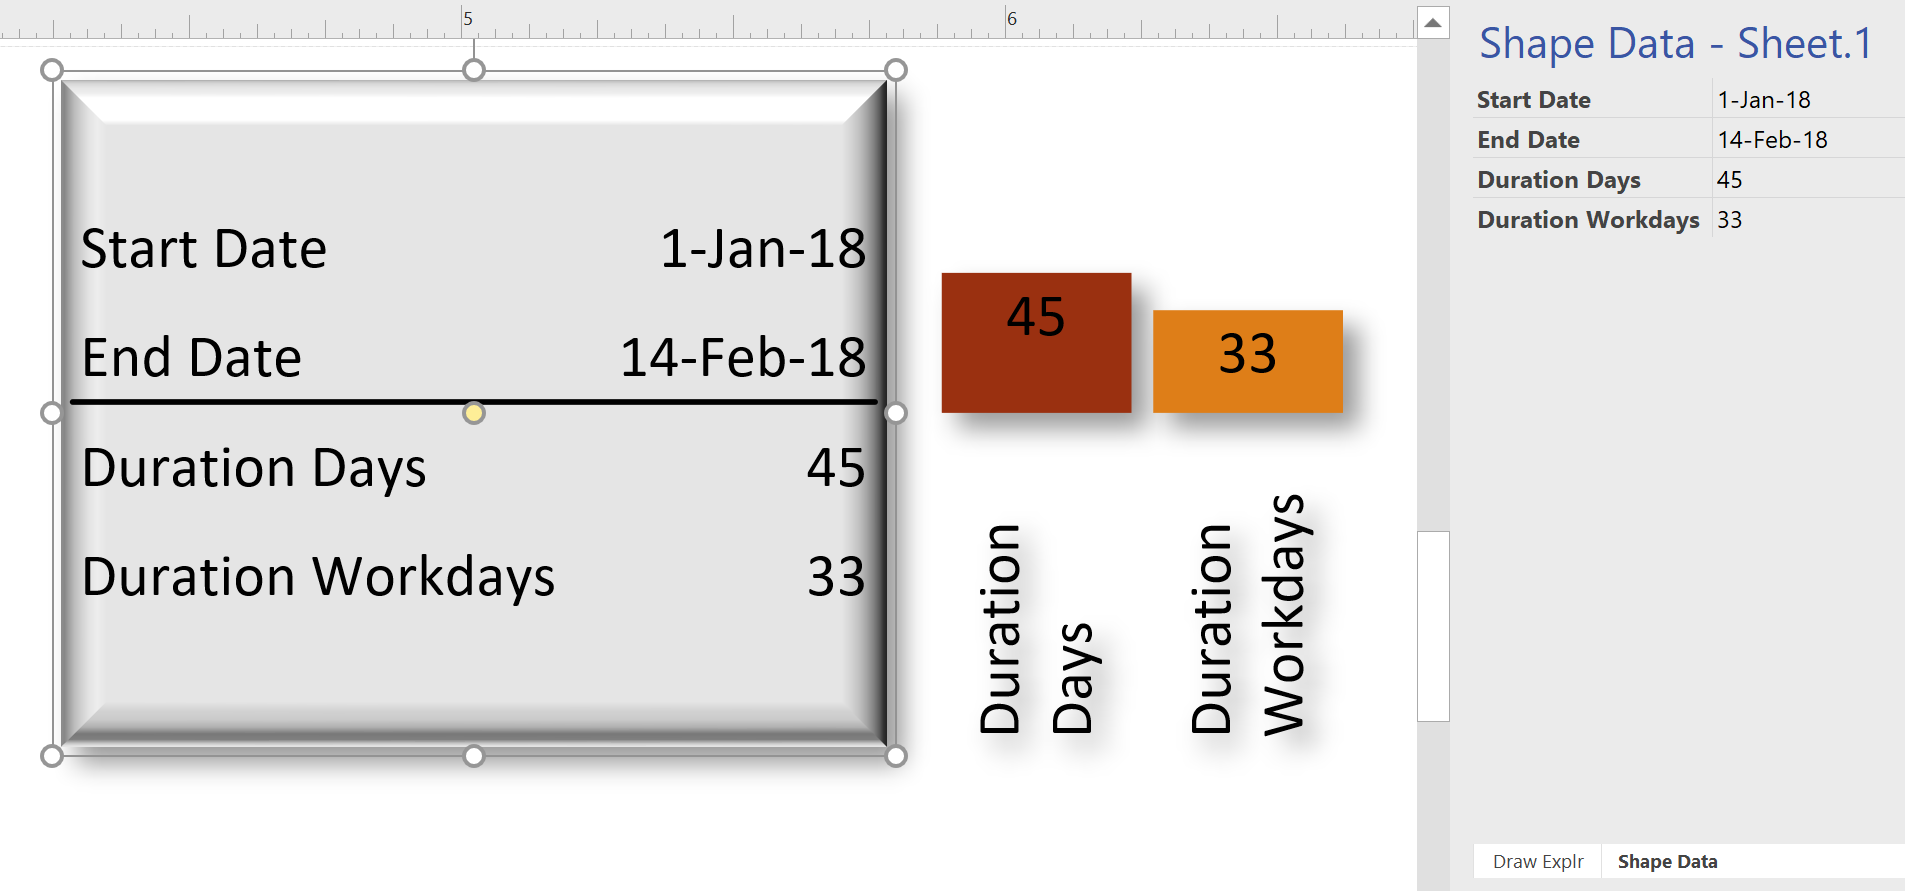
Using EVALCELL() in Visio to calculate Workdays
Using the EVALCELL() formula in Visio to return equivalent of NETWORKDAYS() in Excel