• Skip to main content
  • Skip to primary sidebar
  • Skip to footer

bVisual

  • Home
  • Services
    • How Visio smartness can help your business
    • Visio visual in Power BI
    • Visio Consulting Services
    • Visio Bureau Services
    • Visio Training and Support Services
  • Products
    • Visio Shape Report Converter
    • SS Plus
    • LayerManager
    • visViewer
    • Metro Icons
    • Rules Tools for Visio
    • The Visio 2010 Sessions App
    • Multi-Language Text for Visio
    • Document Imager for Visio
    • multiSelect for Visio
    • pdSelect for Visio
  • Case Studies
    • Case studies overview
    • Using Visio in Education for GIS
    • Visualizing Construction Project Schedules
    • Visio Online Business Process Mapping
    • Nexans Visio Template
    • CNEE Projects, WorldCom
    • Chase Manhattan Bank
  • News
    • Recent news
    • News archive
  • Resources
    • Articles➡
      • ShapeSheet Functions A-Z
      • Comparing Visio for the Web and Desktop
      • Customising Visio Shapes for the Web App
      • Key differences between the Visio desktop and web apps
      • Using the Visio Data Visualizer in Excel
      • Using Visio in Teams
      • Creating Visio Tabs and Apps for Teams with SharePoint Framework (SPFx)
      • Designing Power Automate Flows with Microsoft Visio
      • Innovative uses of Visio Lists
    • Webcasts ➡
      • Visio in Organizations
      • My session and other Visio sessions at MSIgnite 2019
      • Power up your Visio diagrams
      • Vision up your Visio diagrams
      • The Visio 2010 MVP Sessions
    • Visio Web Learning Resources
    • Books➡
      • Visualize Complex Processes with Microsoft Visio
      • Mastering Data Visualization with Microsoft Visio
      • Microsoft Visio Business Process Diagramming and Validation
      • Visualizing Information with Microsoft Visio
  • Blog
    • Browse blog articles
    • Visio Power BI articles
    • Visio for Web articles
    • A history of messaging and encryption
  • About us
    • About bVisual
    • Testimonials
    • Bio of David Parker
    • Contact Us
    • Website Privacy Policy
    • Website terms and conditions
    • Ariba Network
You are here: Home / Products / Visual Risk Analysis / Visual Risks of a Global Pandemic

Published on April 7, 2020 by David Parker

Visual Risks of a Global Pandemic

Back in the early noughties, I was part of a start-up company to to visualise the risks of any dependency system. We used Visio, of course, to map operational components and assets into a hierarchy of dependencies that simply displayed the roll-up of perceived risk. One of the demonstration diagrams that we (mainly Humphrey Tizard) constructed in 2003 was for a global pandemic. How prophetic that seems now!
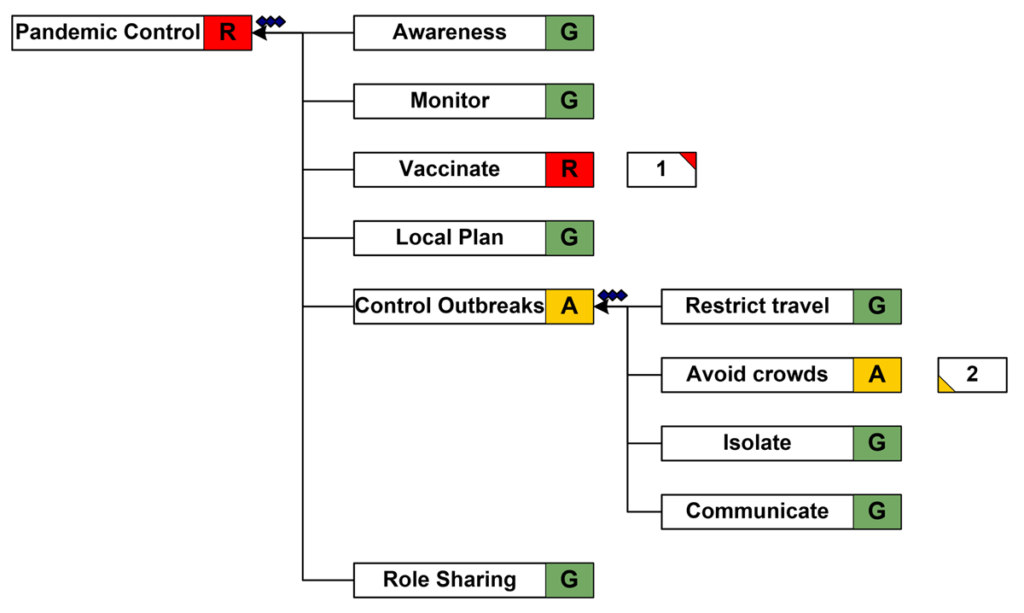
The easy to read RAG status of each element makes it simple to grasp the relationships of risk quickly, and my eyes were immediately drawn to the Red status of Vaccinate. That is exactly where we are at now.
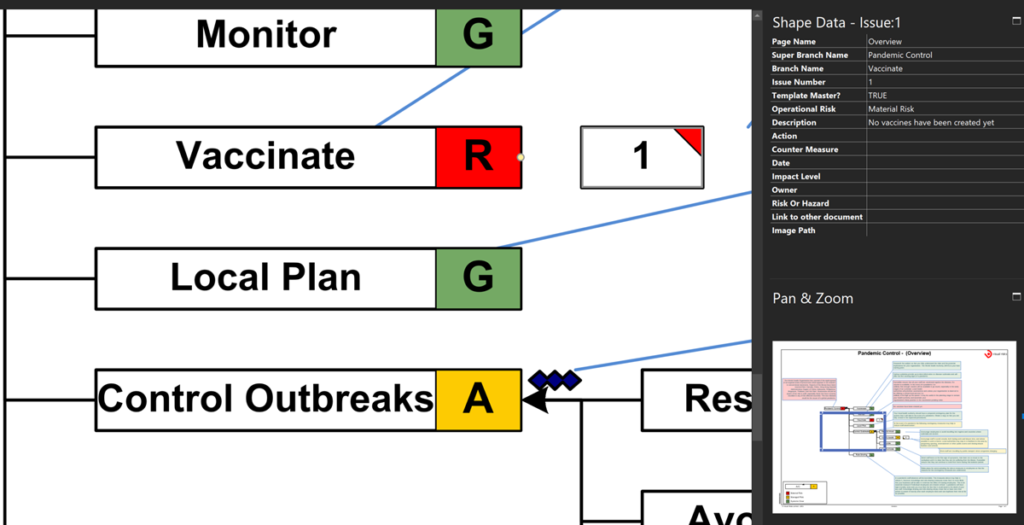
I have often mused on re-vamping this visual risk analysis solution to take advantage of the newer capabilities of Visio desktop and the integration with the web, but, for now, I have simply added in a custom callout shape that displays the contents of the associated Description values in the Shape Data section.

You can view the above diagram in your browser (Pandemic Control), and you can read more about this solution at VRA makes the case for Prudential

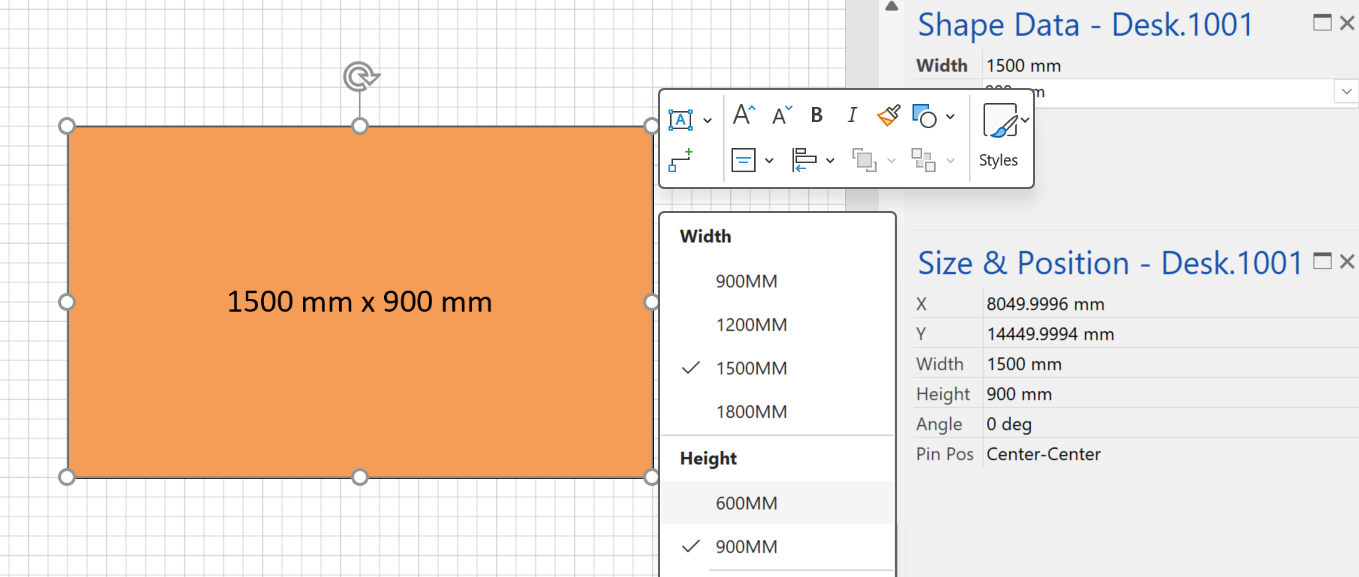
Fixing dimensions of 2D shapes

I am often asked what makes Visio unique and makes it stand out from the crowd, especially in today’s online world. Well, I think there are many reasons, but one of them is the ability to create scaled drawings with parametric components of specific dimensions. This was crucial for my adoption of Visio back in…

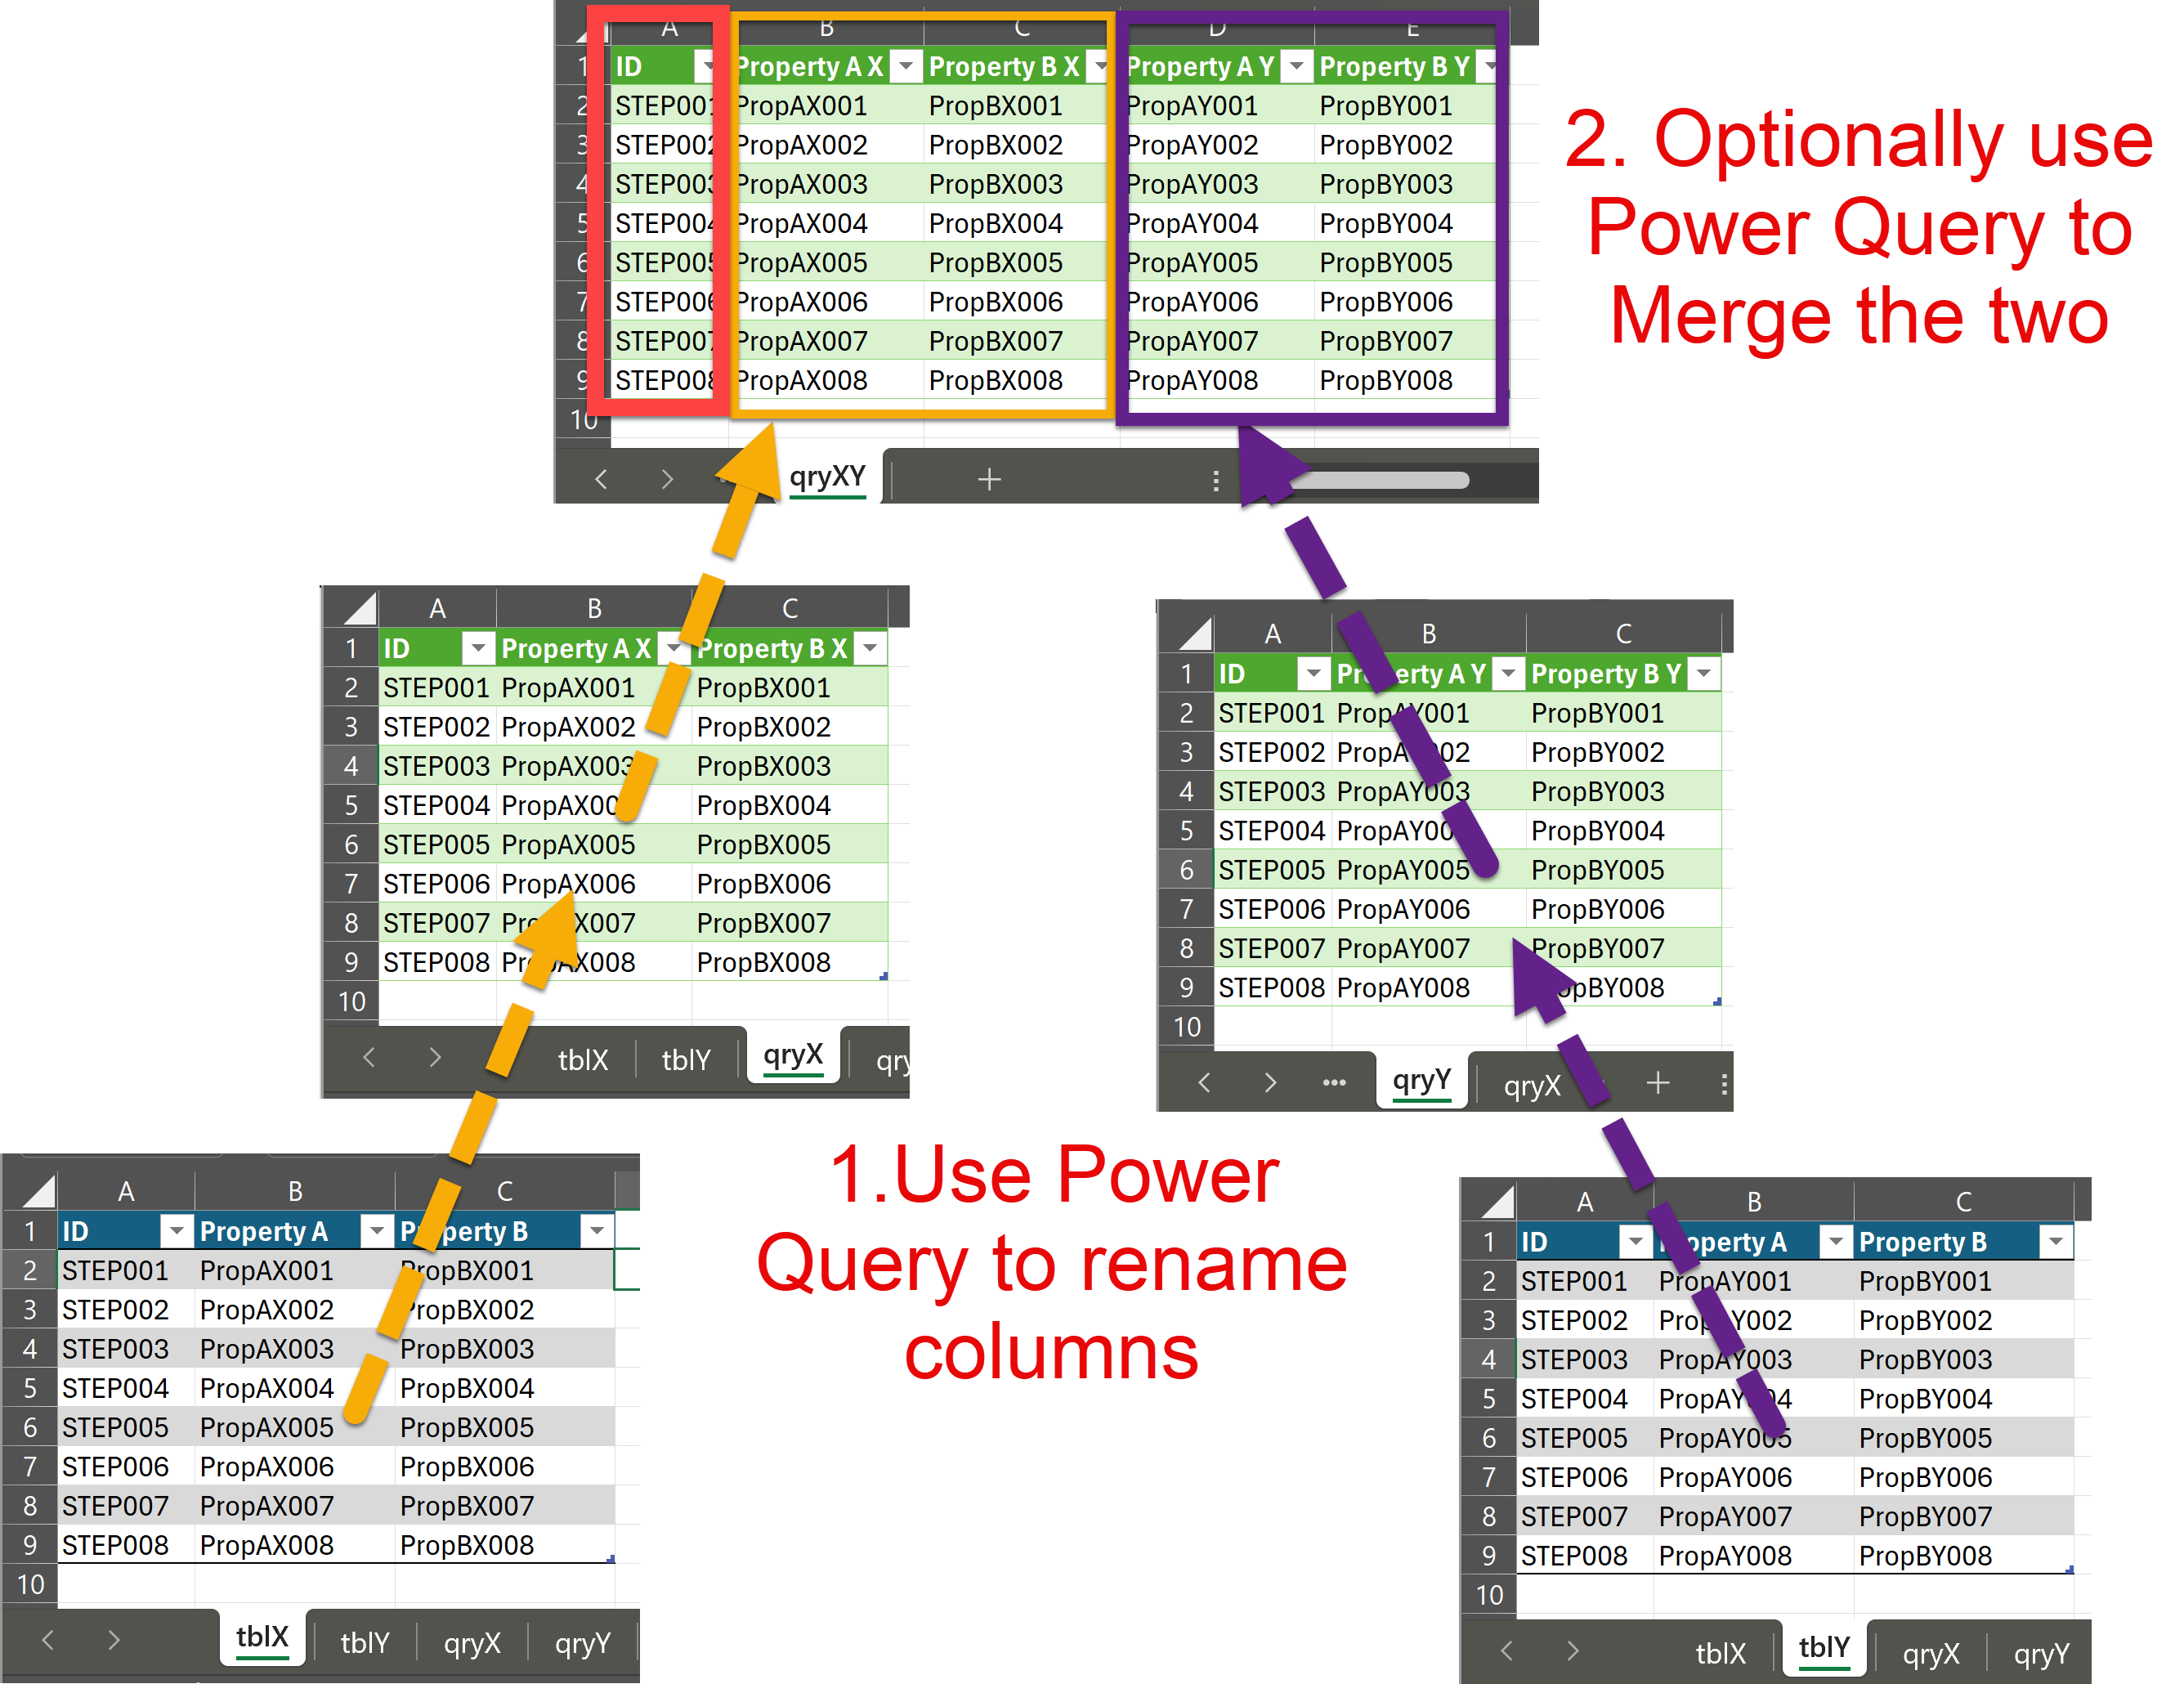
Merging Linked Data from Similar Tables

I was recently asked how to link data from different tables but with similar column names to Visio shapes. In this case, each table has the same unique identifier, but some of the column names are the same. The problem is that the data linking matches the column name with the label of a Shape…

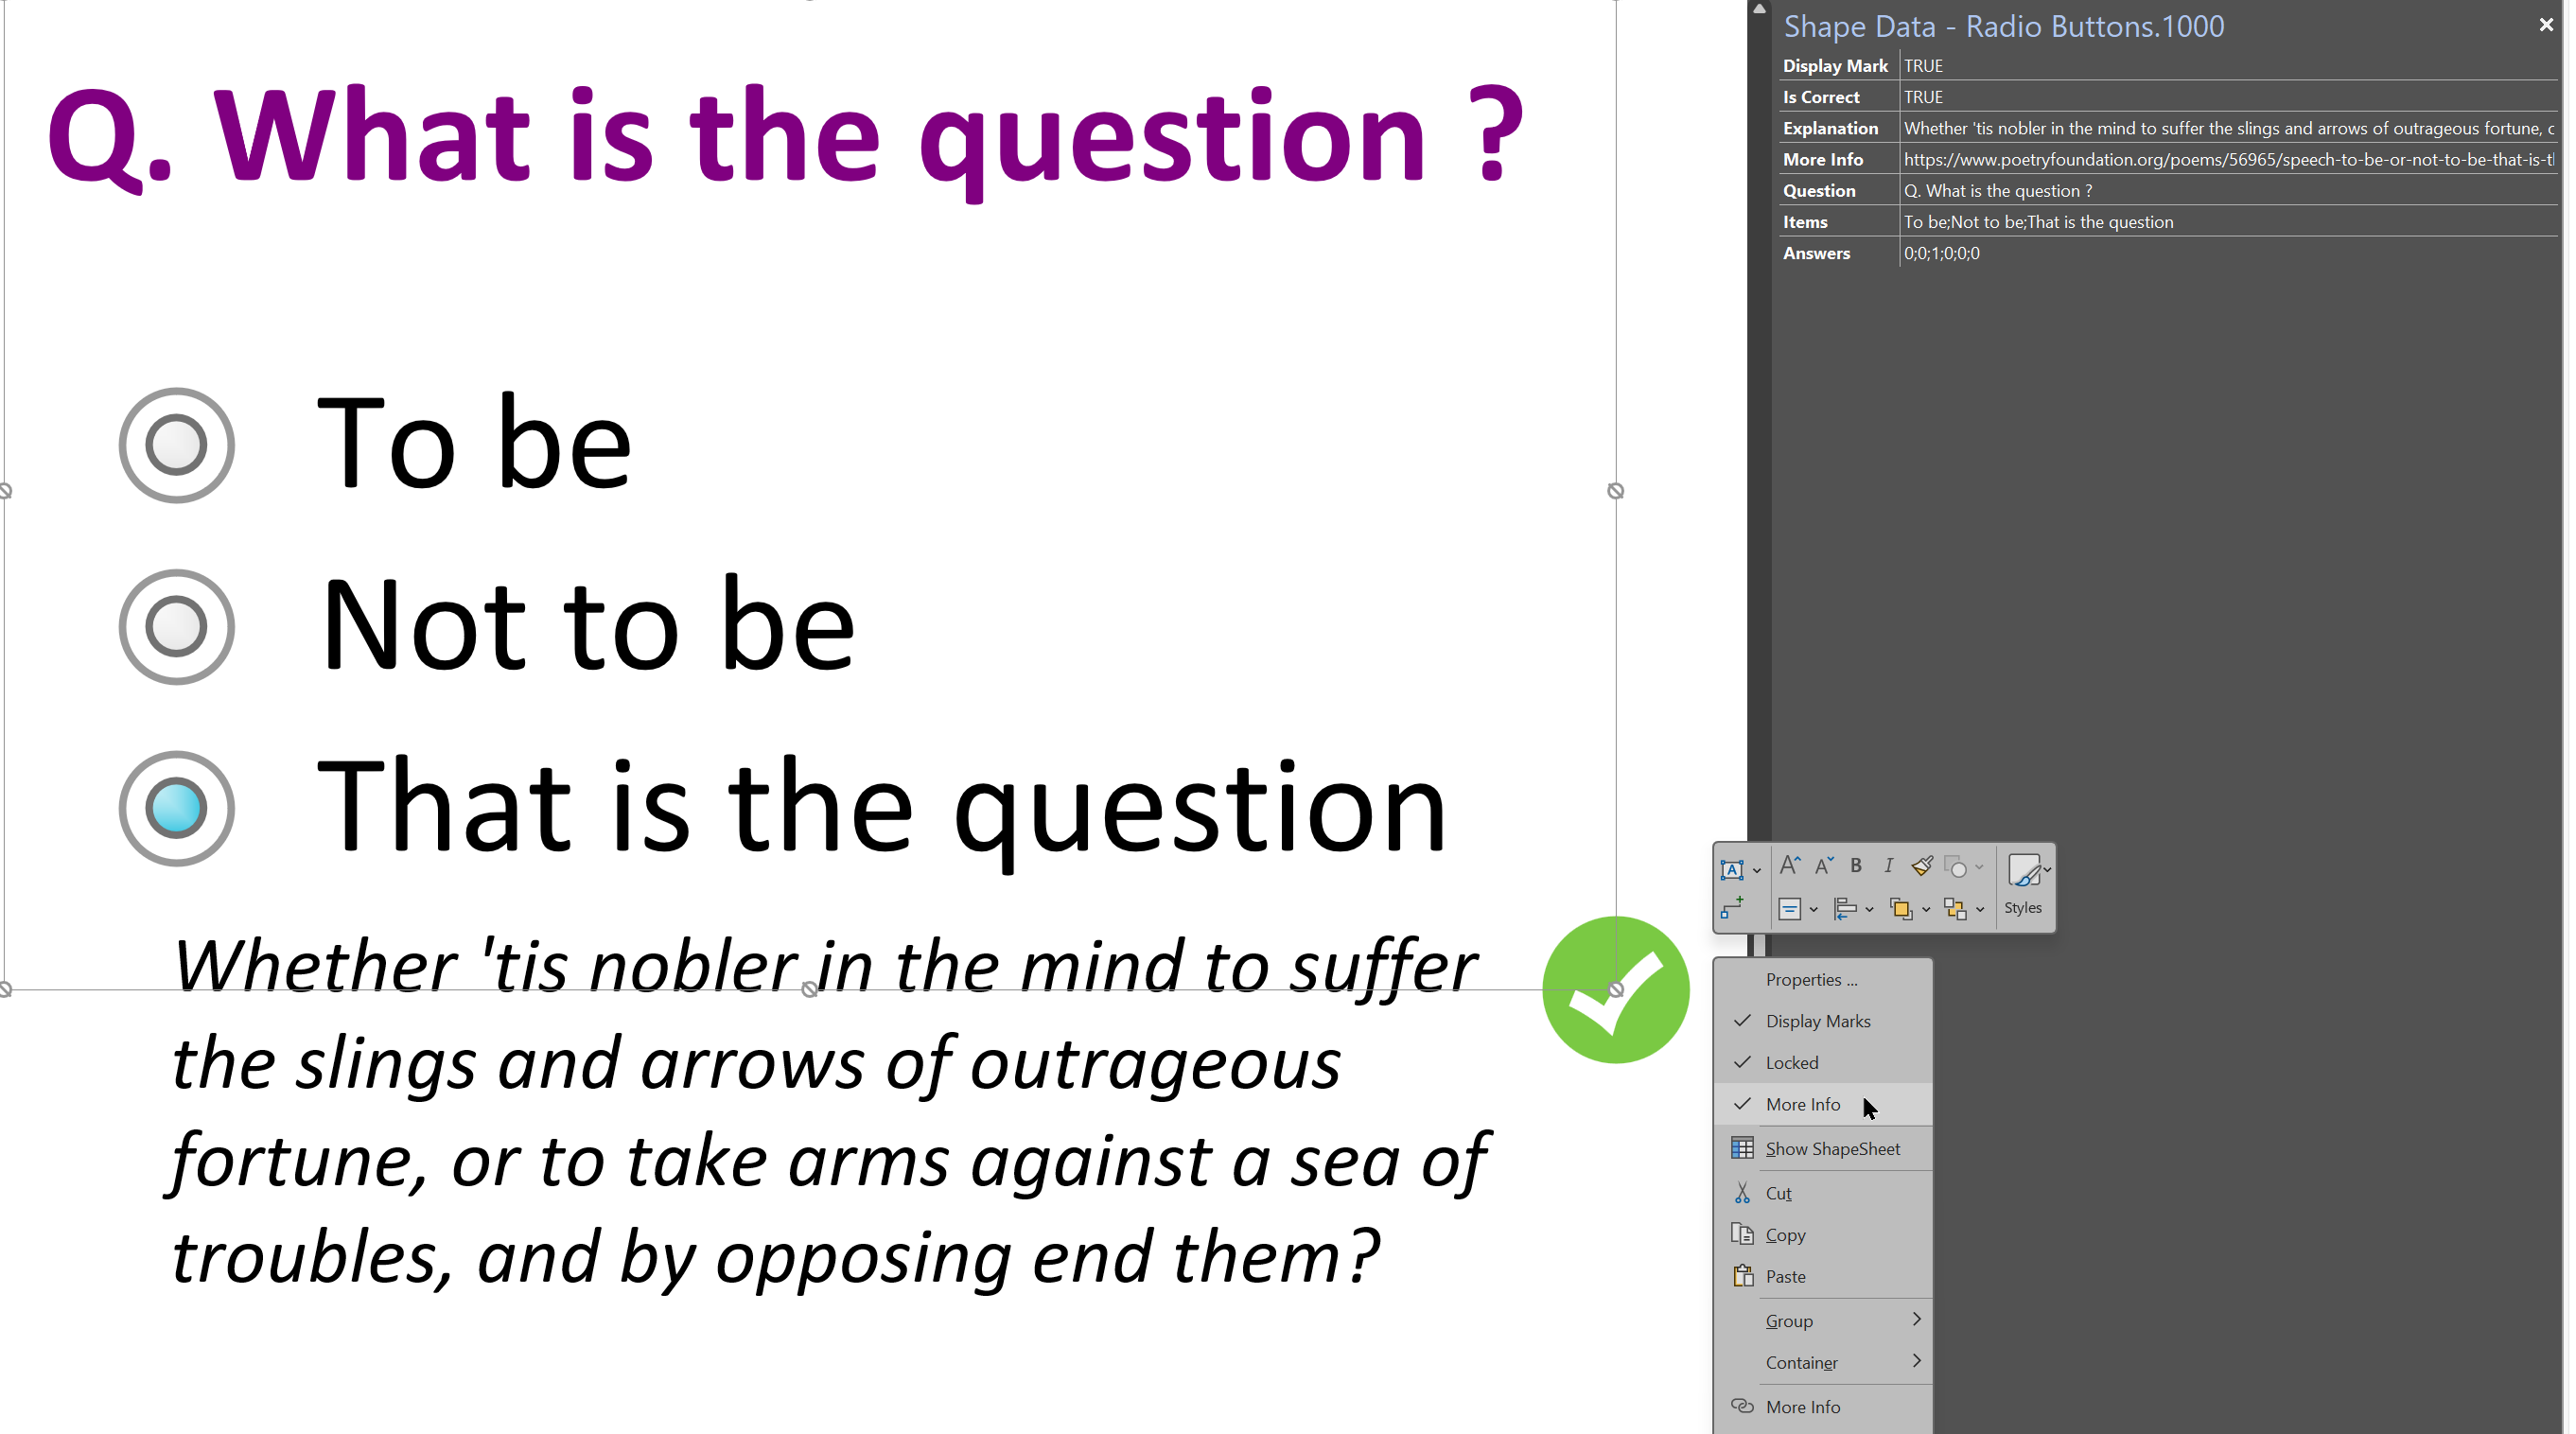
Smart Radio Buttons and Check Boxes in Visio

A recent project requires an interactive tutorial within Microsoft Visio desktop where a lot of the questions need a single answer using radio buttons, or multiple-choice answers using check boxes. I thought that this would be a great use of the list containers capability because the questions and answers could be part of the container…

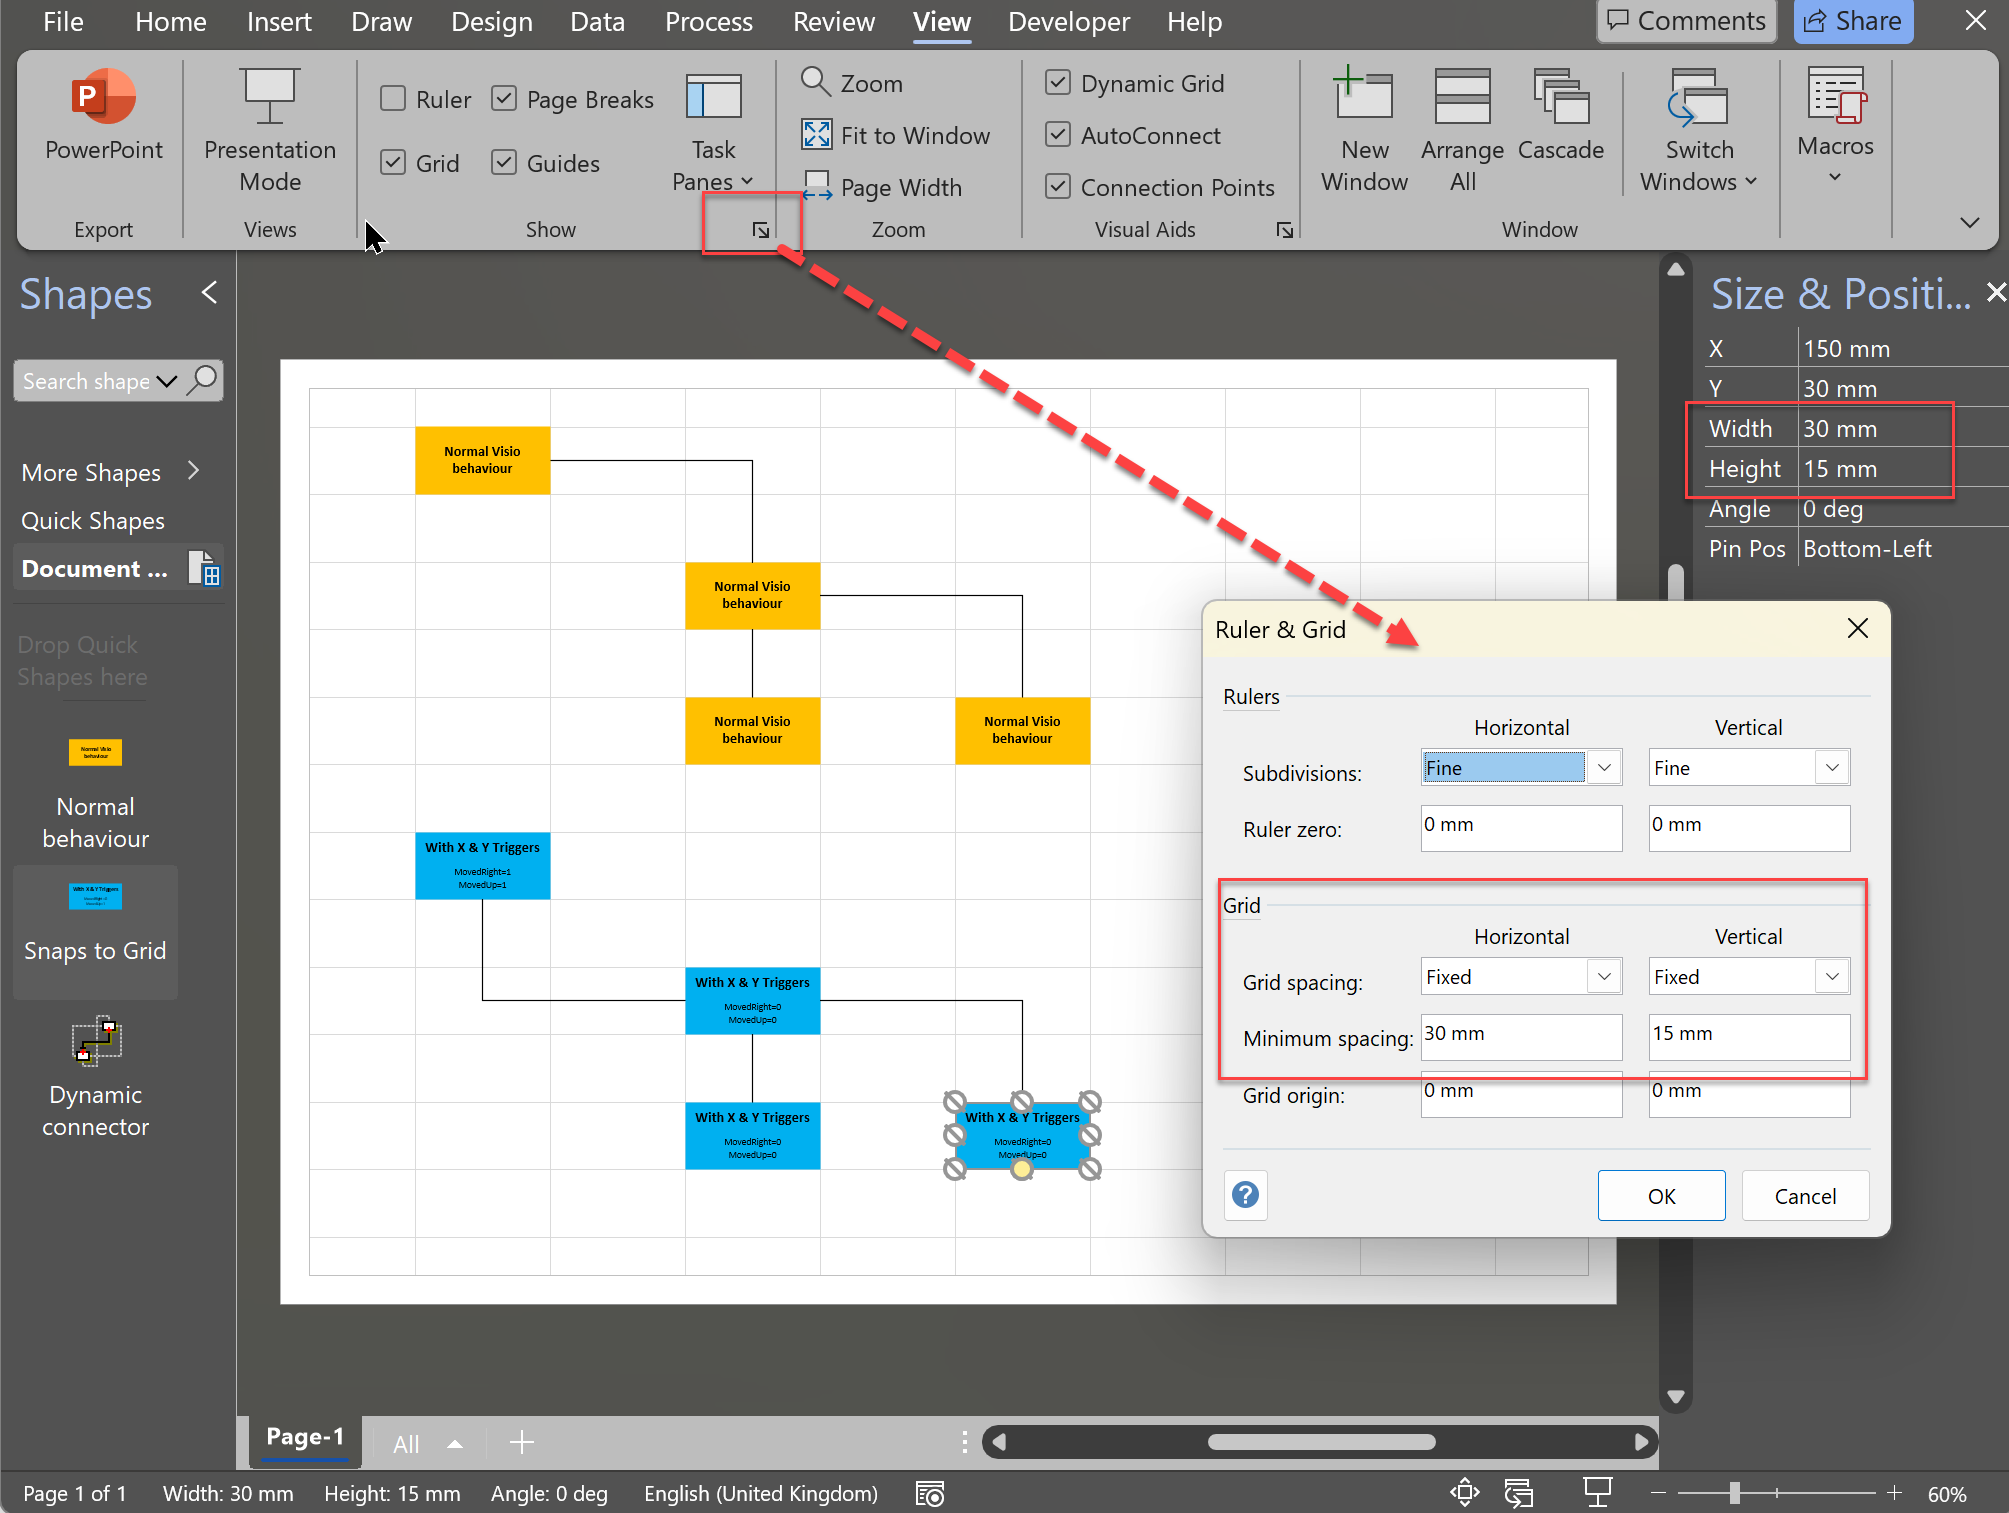
Grid Snapping Revisited

I have previously tackled the subject of snapping to grids in Visio desktop (see https://bvisual.net/2018/06/19/really-snapping-to-grids-in-visio/ ) but a recent project required me to improve the example because it did not respond to all cursor arrow keys. The problem was that the previous solution could not understand which arrow key had been clicked, therefore it did…
When is a Visio Callout not a Callout?

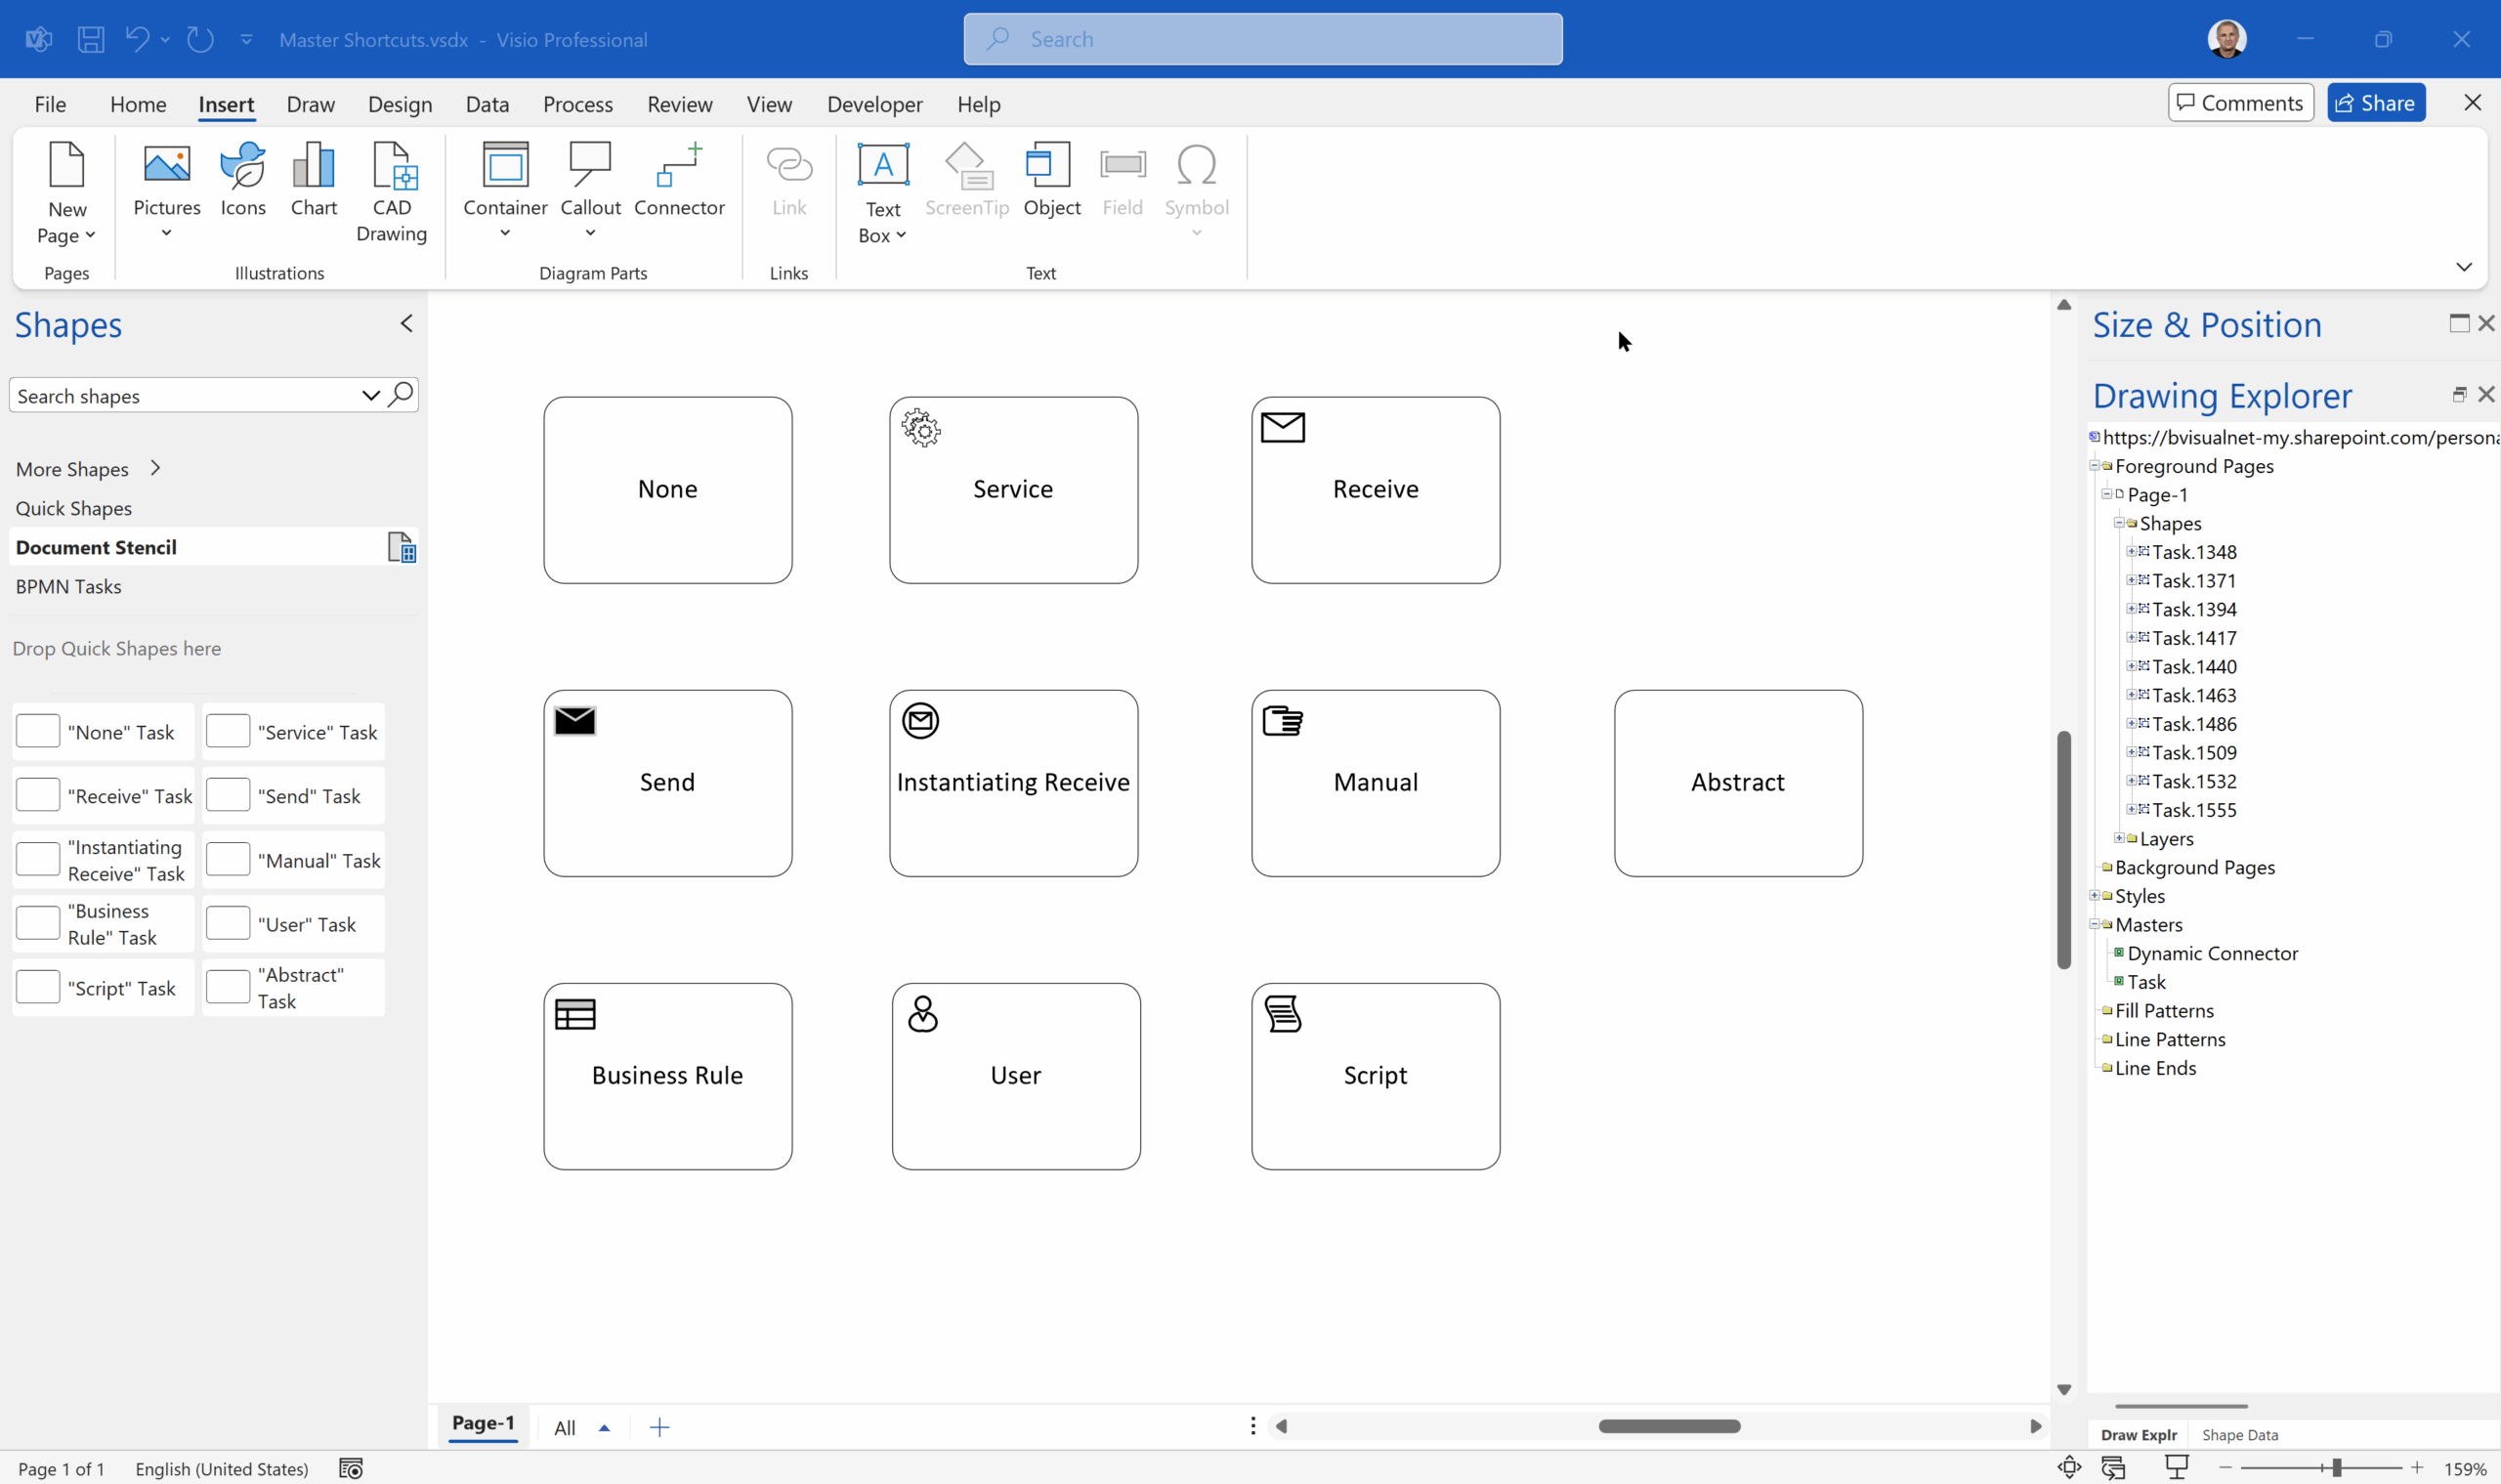
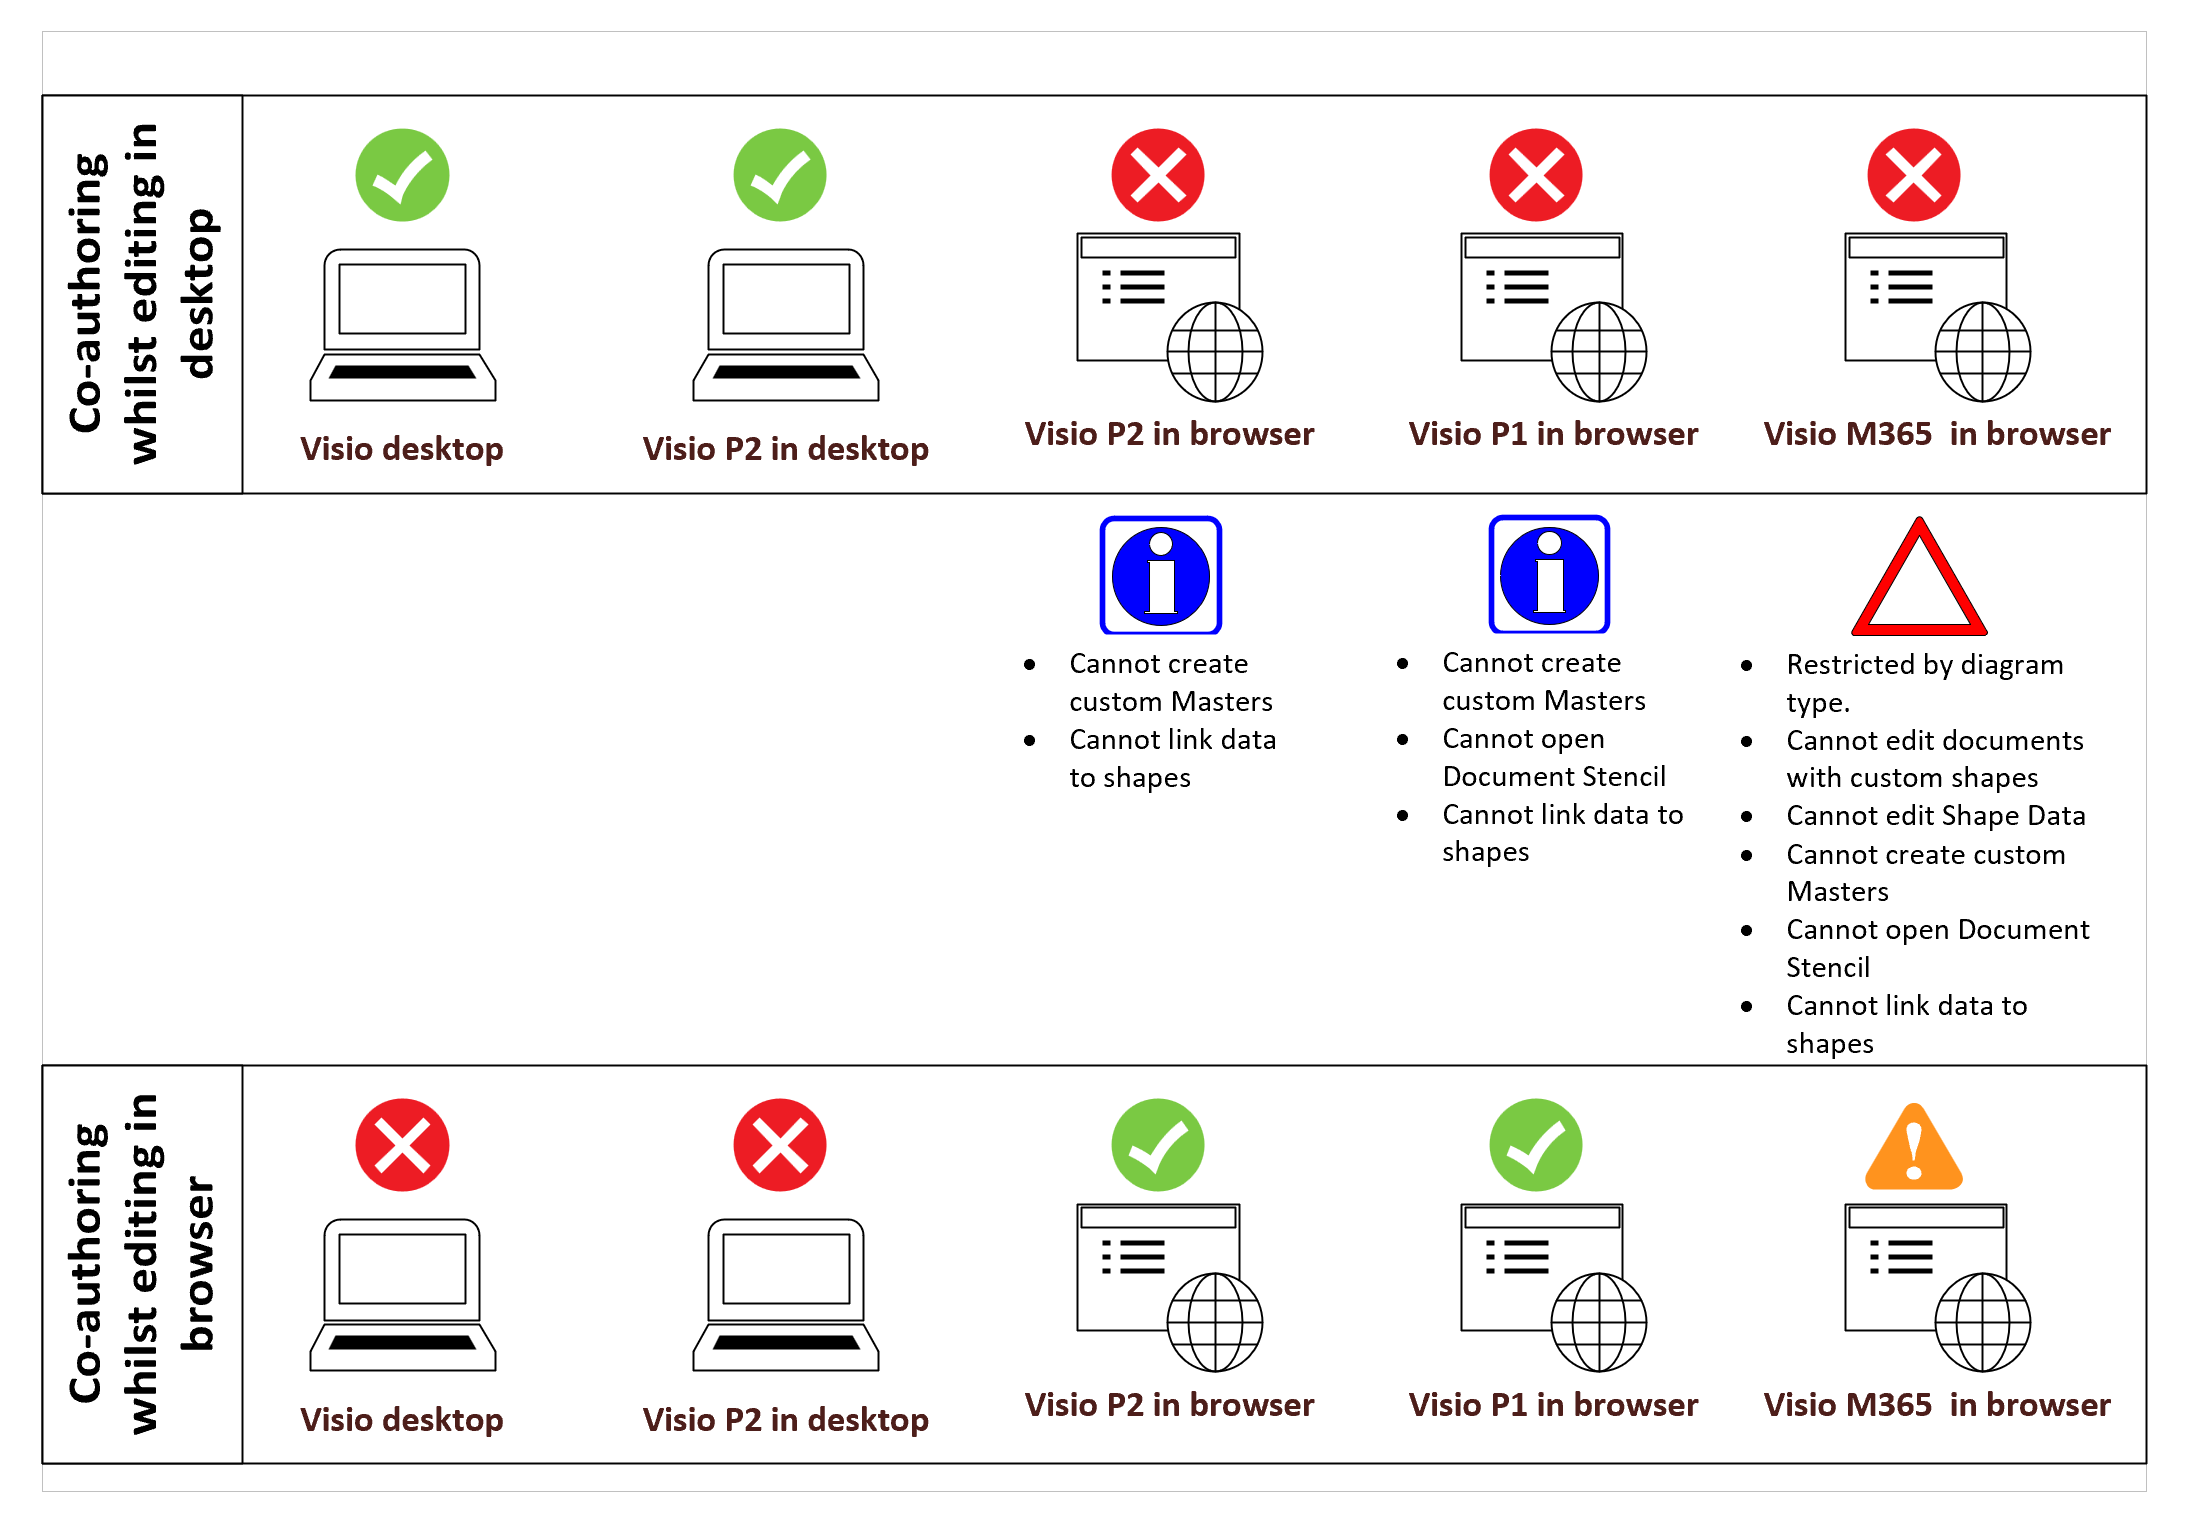
I have been a Visio user/developer since the mid-1990’s and seen the word “callout” used as part of the name of many master shapes in Visio. The images below show five ways that the term “callout” has been applied to the name of Visio master shapes. Generally, each evolution has been an advance on the…

Using Visio Color by Value on Connectors

Data Graphics in Visio Plan 2 and Visio Professional is great, but it only enables us to use them with 2D shapes in Visio, i.e. not on connectors. So, what if you want to change the line colour of the connectors between the 2D shapes because of the data flowing between them? Well, it is…

Related

Filed Under: Visual Risk Analysis Tagged With: ShapeSheet, Visio, Visual Risks, VRA

About David Parker

David Parker has 25 years' experience of providing data visualization solutions to companies around the globe. He is a Microsoft MVP and Visio expert.

Reader Interactions

Leave a Reply Cancel reply

Your email address will not be published. Required fields are marked *

Primary Sidebar

  • LinkedIn
  • Twitter

Recent Posts

  • Fixing dimensions of 2D shapes
  • Merging Linked Data from Similar Tables
  • Smart Radio Buttons and Check Boxes in Visio
  • Using Button Face Ids in Visio
  • Grid Snapping Revisited

Categories

Tags

Accessibility Add-Ins Connectors Containers Data Export Data Graphics Data Import Data Visualizer Educational Excel GraphDatabase Hyperlinks Icon Sets JavaScript LayerManager Layers Legend Link Data to Shapes Lists MSIgnite MVP Office365 Org Chart PowerApps PowerBI PowerQuery Processes Setup and Deployment Shape Data Shape Design ShapeSheet ShapeSheet Functions SharePoint 2013 SQL Teams Validation VBA Video Visio Visio 2007 Visio for the Web Visio Online Visio Services Visio Viewer Webinar

Footer

bVisual Profile

The UK-based independent Visio consultancy with a worldwide reach. We have over 25 years experience of providing data visualization solutions to companies around the globe.

Learn more about bVisual

  • Amazon
  • E-mail
  • Facebook
  • LinkedIn
  • Twitter
  • YouTube

Search this website

Recent posts

  • Fixing dimensions of 2D shapes
  • Merging Linked Data from Similar Tables
  • Smart Radio Buttons and Check Boxes in Visio
  • Using Button Face Ids in Visio
  • Grid Snapping Revisited

Copyright © 2025 · Executive Pro on Genesis Framework · WordPress · Log in