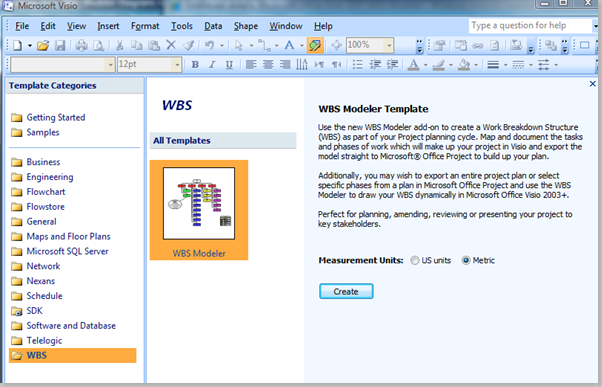
I have recently been asked if it is possible to update the % Complete data diagrams created with the WBS Modeler Visio 2007 Add-in ( https://www.microsoft.com/en-gb/download/details.aspx?id=26229 ). Well, it is always possible with custom code, but it is intended that the WBS Modeler diagrams can be refreshed using the Link Data to Shapes feature in Visio 2007 Professional. I know this because I wrote WBS Modeler, and in this article, I will tell you how.
Firstly, I will use the Commercial Construction project that is installed with the Visio SDK for this example, which I show an extract from below.
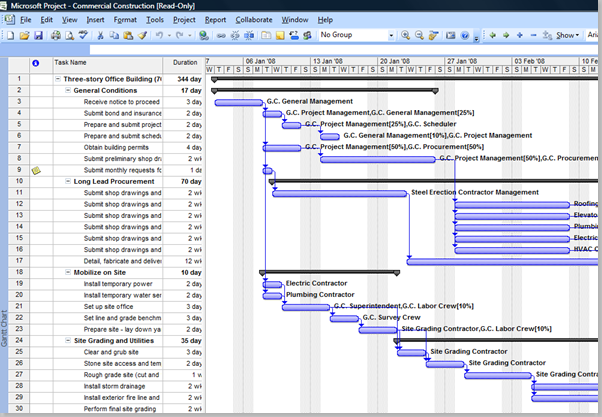
Then I created a new WBS Modeler diagram based on the above project.
I simply imported the whole project using the WBS Modeler / Import from Microsoft Office Project menu action.
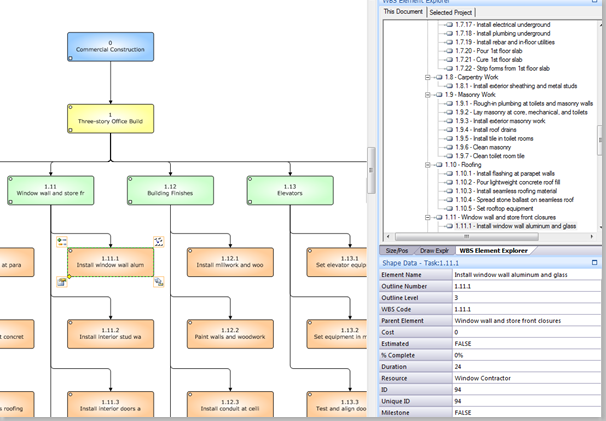
The Element shapes are color coded according to their Outline Level by default, and they are labeled with their Outline Number and a truncated version of the Element Name shape data. Notice that the Shape Data window shows more of the Project data fields than is displayed on the shape.
NB If you do see all of these Shape Data rows, then click on the page and ensure that the page Hide extra Project properties is set to False in the Shape Data window.
In this particular sample project, there are no costs, nor are there any non-zero % Complete values, so I’ll change some of these in the original project, then update the Visio diagram.
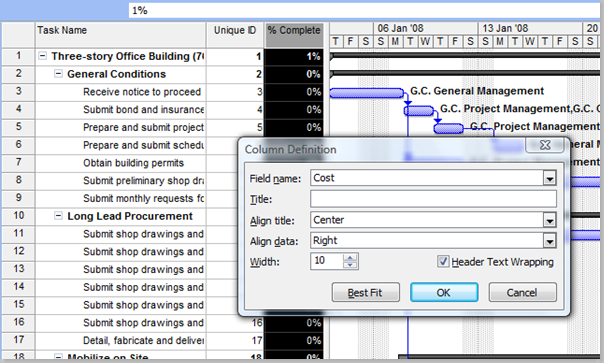
Therefore, I revealed the Unique ID, % Complete and Cost fields in Project.
I then exported the Project tasks to Microsoft Excel using File / SaveAs and Selected Data in the Project Export Wizard.
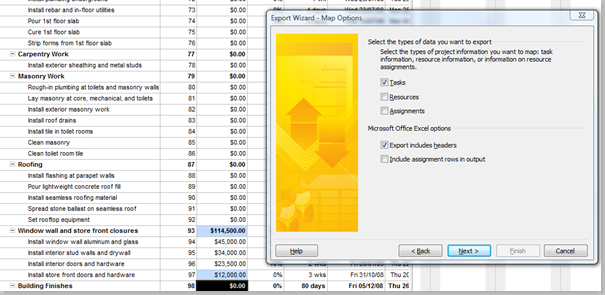
You then need to select the Unique ID and any other fields that you want to export.
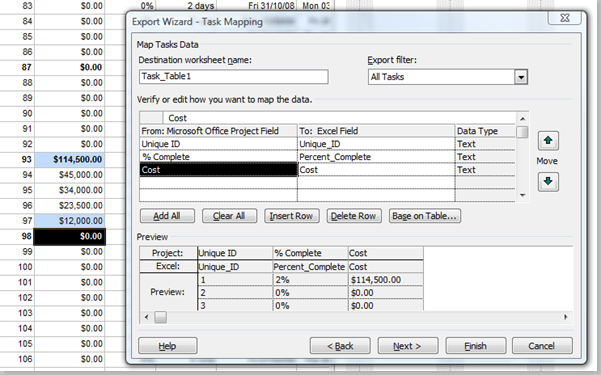
You can optionally save the Map for future use, but you should end up with an Excel spreadsheet that contains the data that you requested.
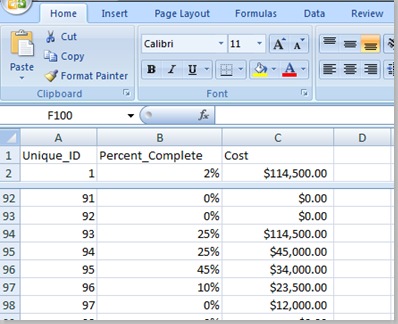
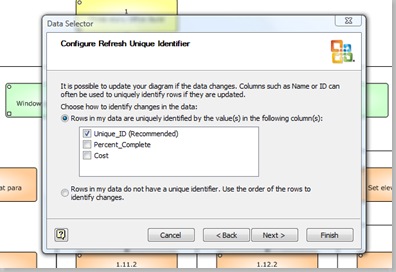
Then, in Visio 2007 Professional, you can click Data / Link Data to Shapes and select the Excel workbook that you just created. There should be just one region, Task_Table1$, and you should ensure that the Unique_ID column is checked.
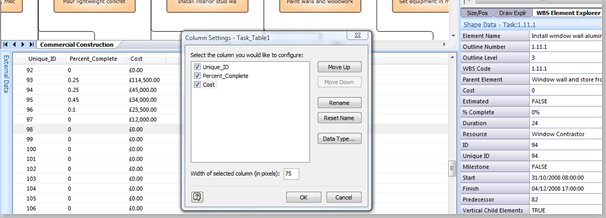
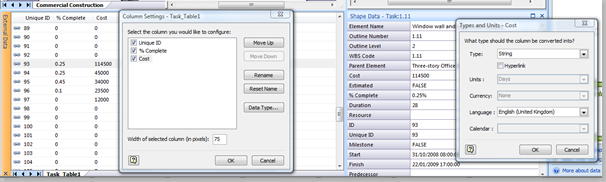
When you click Finish, the Excel data is copied into the Visio document as External Data. You must now ensure that the column labels match those on the Element shapes by opening the Column Settings dialog from the right-mouse menu of the External Data window. So, Unique_ID becomes Unique ID and Percent_Complete becomes % Complete. This will ensure that the data is copied into existing Shape Data rows rather than creating new ones.
In addition, I changed the Data Type for the Cost field to String because my original Element shape is expecting a string.
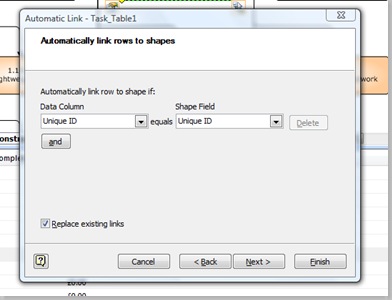
You can then choose Automatically Link from the right-mouse menu of the External Data window, and use the All shapes on this page option. Finally, you must ensure that the Data Column Unique ID equals the Shape Field Unique ID.
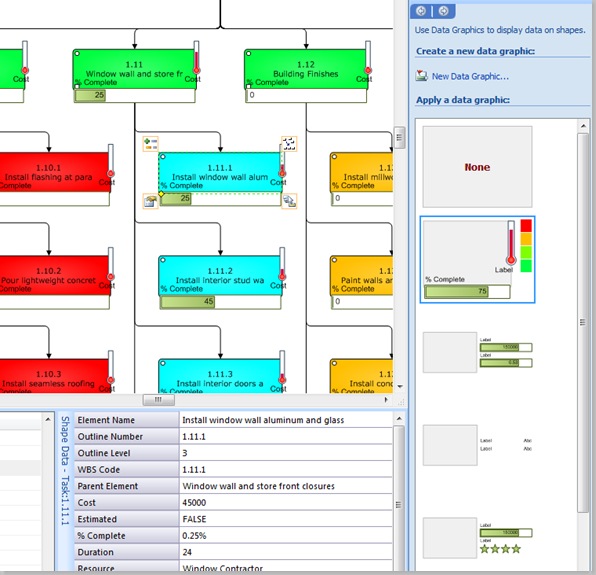
When the links have been created, you will probably think that something has gone wrong because everything has turned black.
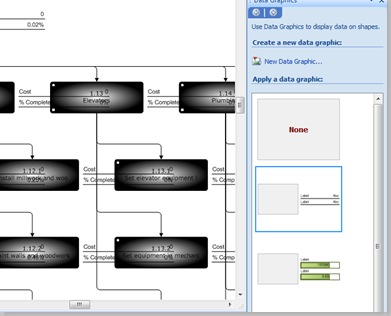
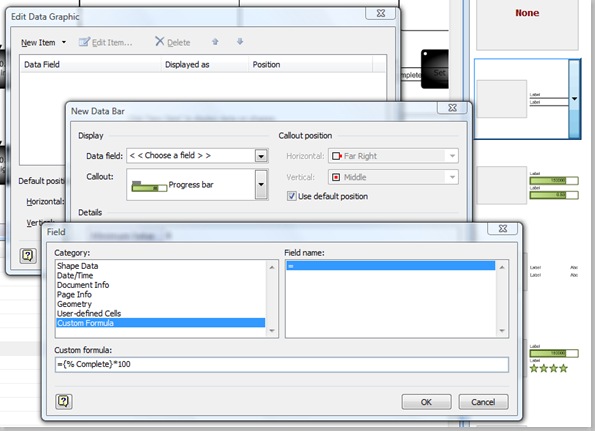
However, this is normal because Visio has automatically assigned a Data Graphic to all the shapes, so all you need to do is edit it. In this example, I simply deleted the two text fields that Visio had automatically created, and then added a new Data Bars for the % Complete and Cost fields, and Color By Value for the Parent Element.
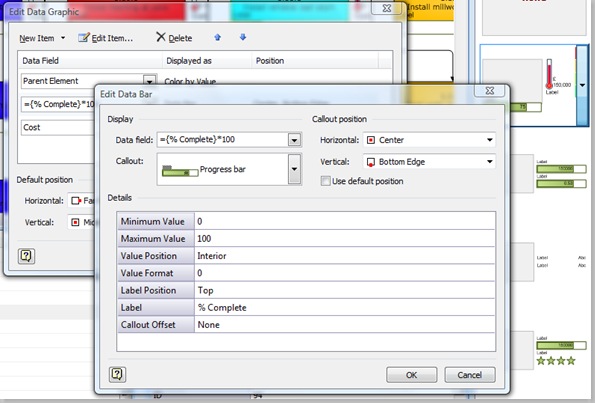
I entered the Custom Formula={% Complete}*100 so that the numbers would be between 0 and 100. You can enter these formulae by selecting More Fields at the bottom of the Data Fields drop-down list on the New Data Bar dialog.
I also edited the Label text and selected the position to be Center/Bottom Edge.
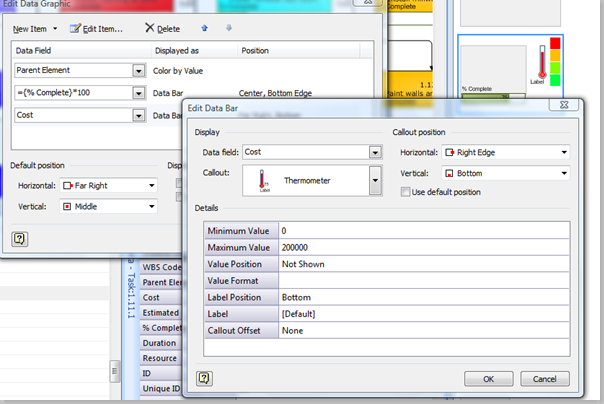
Although I set the Cost property as String for the import, Visio is still able to treat the contents as a number for the Data Graphics, so I thought a Thermometer Data Bar would be interesting. Note that I set the Maximum Value to more than the known data values. (See my Visio Conference blog for code on how to automatically update maxima and minima values).
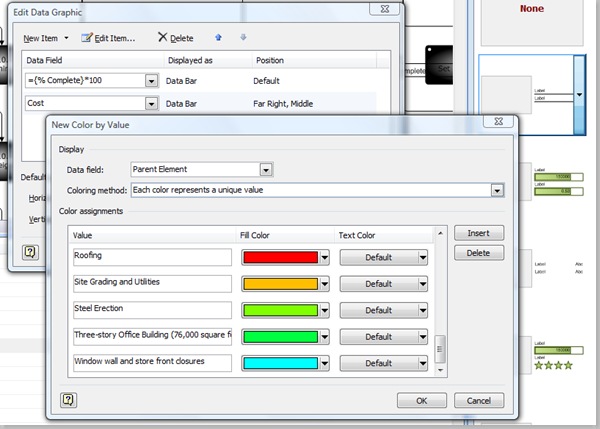
Finally, I decided to use Color By Value on the Parent Element property rather than on the Outline Level one … just to make the diagram more interesting.
When all of this is applied, then you will hopefully see how much more understandable the data is when Link Data to Shapes and Data Graphics are combined in Visio 2007 Professional.
So,the overall effect is a linked WBS Modeler diagram that can be refreshed whenever the data is published into the Excel workbook from Project.
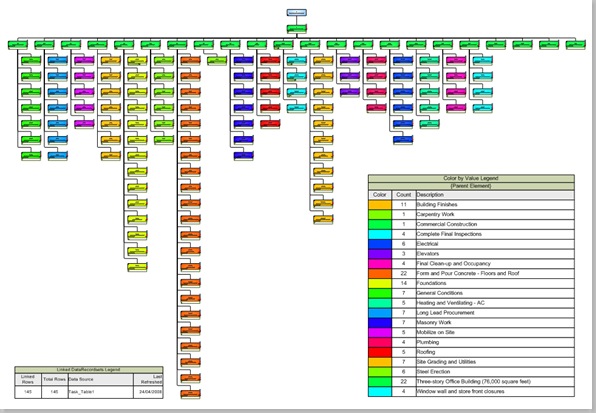
Of course, any Visio diagram that utilises Data Graphics is much enhanced by a legends for the linked recordsets, Color By Value and Icon Sets. However, this is not available out-of-the-box, so you will have to trial (then hopefully buy) my own DataLegends add-in (http://www.bvisual.net/Products/DataLegends.aspx)
Would you happen to know were to find some information on using the WBS Modeler? I have installed it and created a nice chart but want to import it into project as the document says but every time I try it does not work.
I’ve run into a couple of problems with the WBS modeler. It could potentially be a very useful tool, but these issues severly limit its usefulness. The first issue has been reported to Microsoft support. The case number is SRZ080925000335, It occurs when you start with an object and give it an outline number of 0. When you do this, the WBS does not show more than one child of this object’s children (grandchildren, if you will). The next problem occurs when you try to fit a large WBS onto a single printed page. This does not work. No matter how hard you try to fit the drawing to a single page, it overprints the page. The third and final issue occurs when you try to cut and past a WBS drawing into a Word 2007 document, the drawing pastes in but all of the nodes in the WBS are crowded in ontop of each other.
Dear Mr. Parker,
could you please help me?
I want to import a ms project 2010 file into visio 2010 by using the WBS modeler. I have installed all necessary components on my Win7 x86 System. But after the import process, visio won’t show me the Project Task Overview. Instead there appears a window with “invalid parameters”,
As you might have noticesd, I’m not the only one with this problem (http://social.technet.microsoft.com/Forums/en-US/visiogeneral/thread/a46cf028-aee3-41aa-94e0-a85b13676d07#a46cf028-aee3-41aa-94e0-a85b13676d07).
Do you have a solution?
Best regards,
Adrian
P.S.: Reinstalling the modeler and starting a new/empty project didn’t work either.
Although I originally wrote WBS Modeler, I passed control over to Microsoft sometime ago (several years).
I have noticed that there are some things omitted in the latest version … I’ll try to find out who is currently responsible…
The actual version (Office 2010) of WBS Modeler does not draw in visio WBS codes and IMHO make it quite unuseful
The latest version has been “simplified” by Microsoft themselves, and I actually agree with you that it is less useful than before.
Please complain to Microsoft!
UUUGGH. One can not even use the Graphical Reports Templates to get around this any more as these do not contain the data fields eg. WBS-CODE Taskname etc.
It is ashame to see how much MS cares about customers needs at this point.
Lets hope and see what MSP 2013 will come up with at that point.
Hi i have worked around the problem by inserting a data graphic containing the task name in the middle and Outline Number in the upper left corner and “Hide shape text when data graphic is applied” tick box in the “Edit Data Graphic” Dialog.
However i have one severe problem: The tasks that are drawn on the canvas are not in the correct order! So eg. Task 11 comes before Task 2. Of course it should be task 1, task 2 …. task 11. And on the sublevel of task 1 it should be task 1.1, task 1.2 … task 1.n.
Can anyboday help out here?
I am not sure who is maintaining this at Microsoft
Can I insert External Data into a PERT 1 diagram?
Yes you can, but the challenge is getting the data to display in the boxes inside the main shape.
You really want to have the data linked to the top level shape, and then use Insert Field in the sub-shapes to display data from the top-level shape. If you are confused, I will put up a post….
Thanks, that answered my question! I was just hoping that this would be a way to create the MS Project network diagram in Visio and add some other objects. Not worth the trouble.
Hi David: Your add-in save so many people so much time! I am wondering if there is a way to display responsable person and task duration in each box…
Thanks,
Chris
I have not had any control over this add-in for a few years, since I passed it over to Microsoft. However, you can use Link Data to Shapes and Data Graphics to enhance the shapes.
Hello,
Do you now how can I see more than 24 characters on the WBS?
I use visio 2013 with the WBS modeler for office 2010.
Thank you very much
Raphael
I sold this addin to Microsoft over 10 years ago, and they have been responsible for it since.
Hi, I know that you sold it to Microsoft, but I have few basic questions.
1) Does the Duration field in the Properties correspond to the Duration field in MS-Project?
2) How come the Duration of all child elements are not added to the Duration of the Parent element?
3) What is the purpose of the Estimated field?
Thanks
Sorry but as you say, I passed control to Microsoft many years ago.
However, I can say that they seem to have removed functionality over the years….
Is there a way to convert the network diagram in Project to a Visio flowchart? I thought this tool would do it, but it draws the shape connectors based on the task parent/child relationships. I would like it to draw the connectors in Visio based on the predecessor/successor information instead, which is what the Project network diagram uses.
The WBS Modeler is custom code, but you can look at the principles in http://blog.bvisual.net/2009/02/24/creating-an-org-chart-without-the-org-chart-wizard/ to create a Visio diagram from any data.
Hi,
I have used this guide to do a WBS Modeler Diagram which has come out great as per your guidance. The question I wanted to ask is what is the layout you used to have it populate in that format (flowchart/Hierarchy etc)?
I used some custom layout code, I think
I have a problem: After that I import a Project file (in Visio 2010 WBS Modeler) , I see a windows empty, I mind I see the window “WBS TAsk view” in blank.
Please, some body can help me?
thank a lot!!
I am afraid that I passed the code to Microsoft many years ago
Hi,
I use MS Project Pro and MS Viso Premium (both 2010 64 bit) in german language. Obviously that’s the reason why the import/export features in the WBS modeler 2010 64 bit don’t work for me. Is there a german 64 bit version available?
Microsoft have had control of the WBS Modeler add-in for many years. I do not know what they are doing with it. I will try to find out.
I am sorry, but I sold the WBS Modeler code to Microsoft many years ago. I am not sure what they did to some of its features since then.