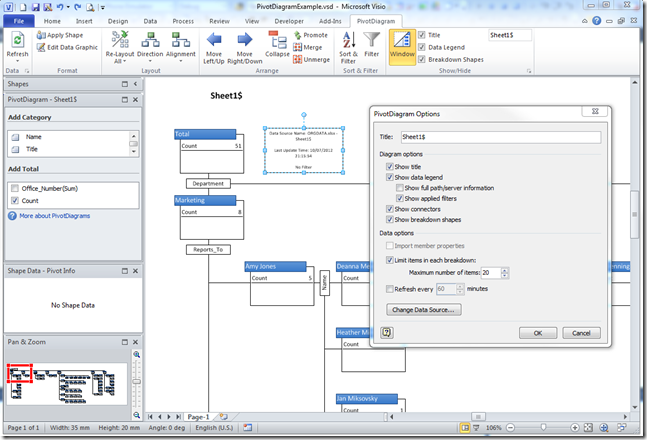
Microsoft Visio 2007 introduced PivotDiagrams to Visio Professional, and continues unchanged in Visio 2010 (see http://office.microsoft.com/en-us/visio-help/create-a-pivotdiagram-HA010357089.aspx ). These diagrams are a great way to analyse and visualize data by allowing you to breakdown data in a similar manner to PivotTables and PivotCharts in Excel. Any one who has both Microsoft Project and Visio installed will have seen that all of the extra diagram reports are in fact Visio PivotDiagrams. However, I have always found that selecting the nodes you want is difficult. In this article I will explain the problem and provide a solution … a new free add-in called PdSelect.
Update : Added new features 20 Jul 2012
In the following example PivotDiagram, I used the built-in OrgData Excel workbook as the data source. This example workbook is normally used to demonstrate the OrgChart Wizard, but I have used it to provide an alternative breakdown by Department / Reports_To / Name.
[Read more…] about Selecting Nodes in Visio PivotDiagrams