

I was recently asked about switching between different Visio Data Graphics within a page, so I thought I should record a few short videos to explain how Visio Data Graphics work, how they can be edited and duplicated, and how to automate switching between them.

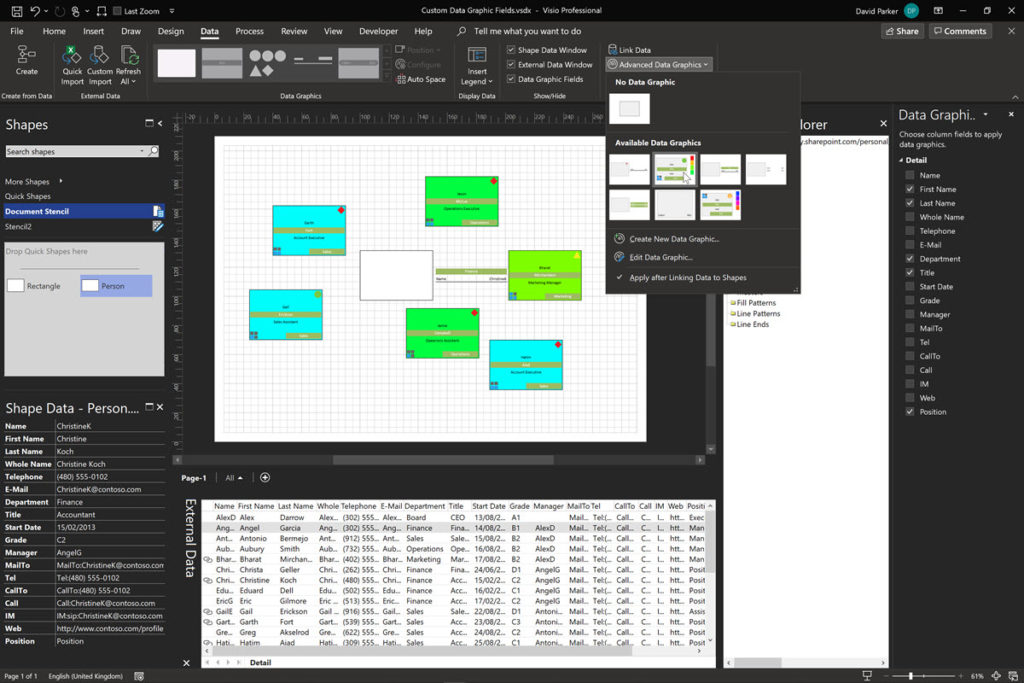
In this scenario, there is an External Data recordset called Detail, and I create a Person master that is preloaded with the relevant Shape Data rows (open in YouTube) .

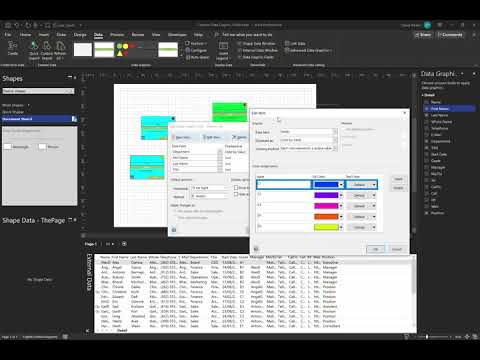
I then demonstrate how Data Graphics can be duplicated, renamed and manually switched between (open in YouTube).
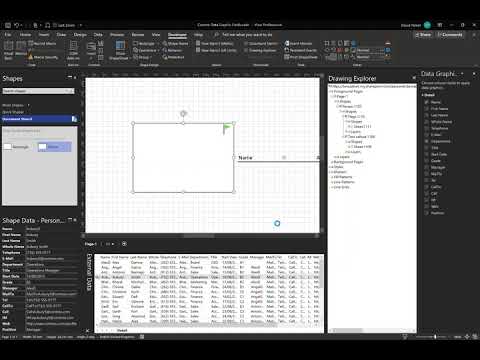
This is a short explanation of what is involved in switching between Data Graphics (open in YouTube).
Finally, I show how a macro can be written to switch automatically between different Data Graphics (open in YouTube).
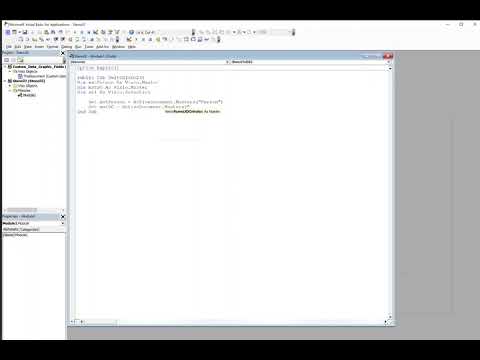
The macro can be within the document or a stencil.

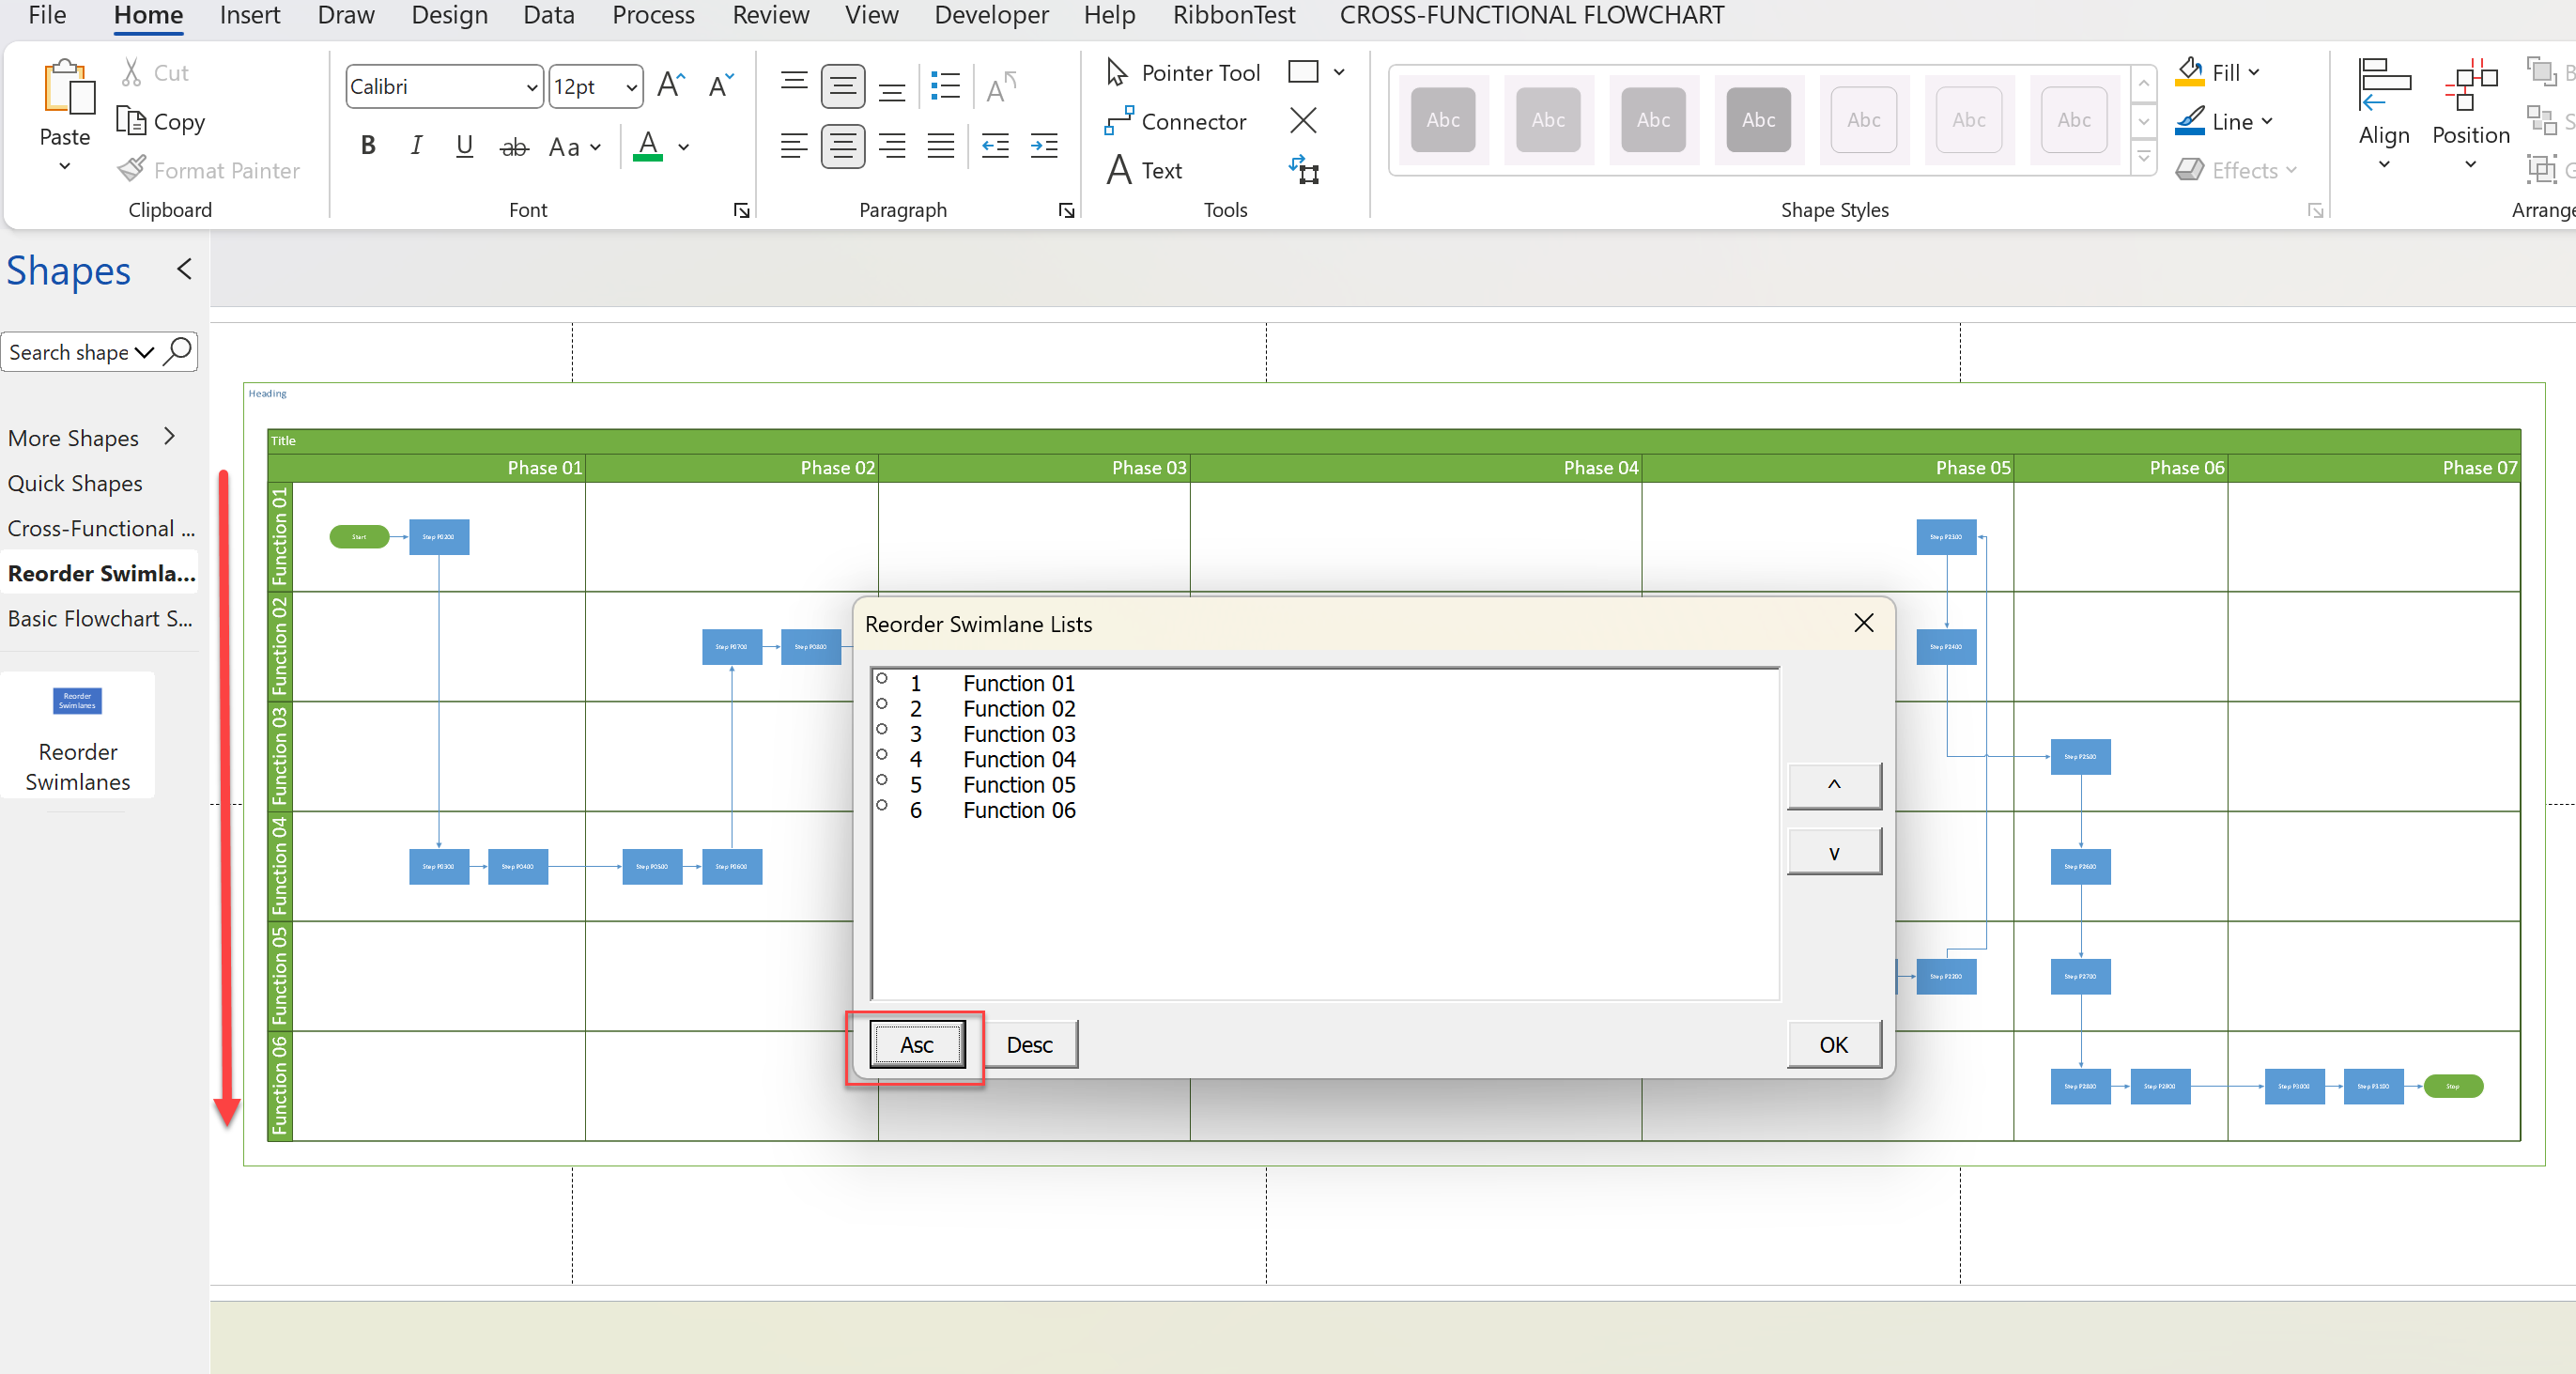
Optimize Visio Flowcharts: Swimlane Reordering Tips
Microsoft Visio desktop Plan 2 and Professional editions provides the ability to create and synchronize cross-functional flowcharts between the diagram and an Excel table. This is great, and widely used for many types of processes. The Excel table normally has a Function / Swimlane column that contains text that becomes labels on the swimlane containers,…

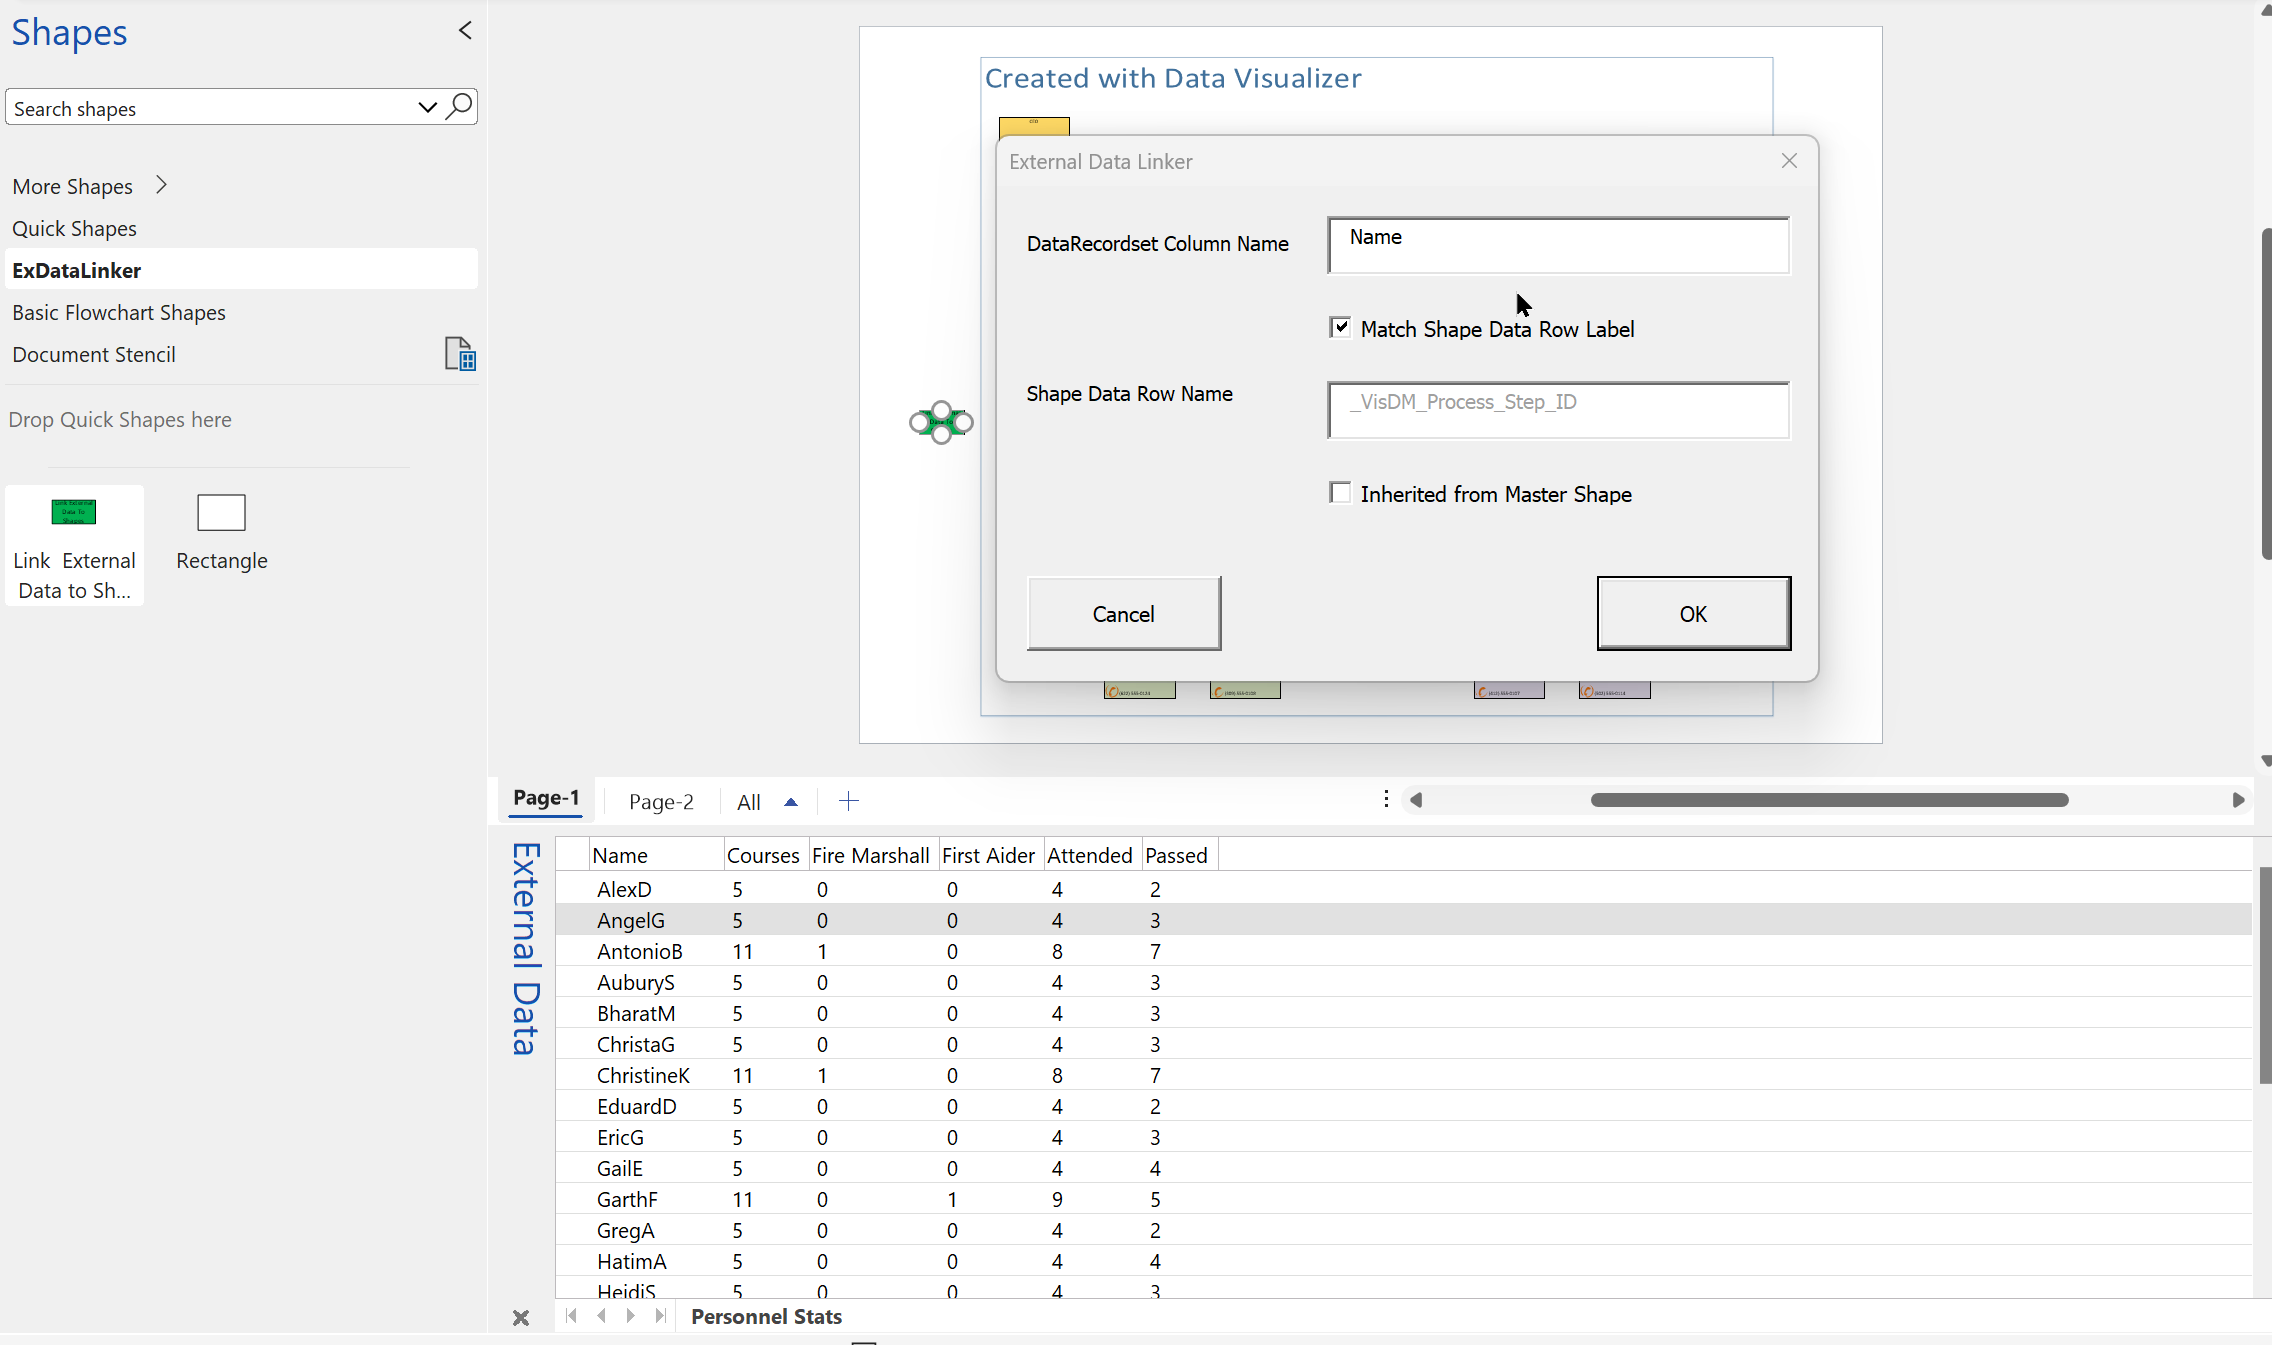
Linking Data to Shapes in Visio after using Data Visualizer
Data Visualizer (DV) in Visio Plan 2 (Data | Create from Data | Create ) is great because it provides a way of automatically creating a diagram from data, but it also prevents some of the other data-linking features in Visio from being used. This is because DV wants to take control of the data…

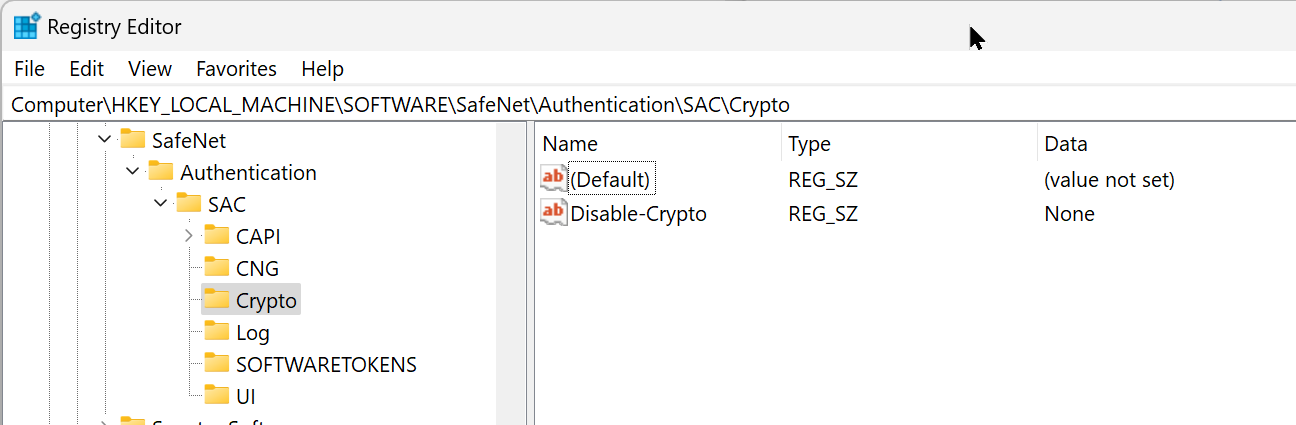
New Requirement for VBA Digital Signatures in Visio
Like most developers, I have to buy a new digital certificate every 3 years to sign my Visio add-ins and VBA projects. Usually that means verifying my bone fides, paying the fee and downloading the certificate, but security has been increased, and now, like everyone else, I have to use a USB key with it…

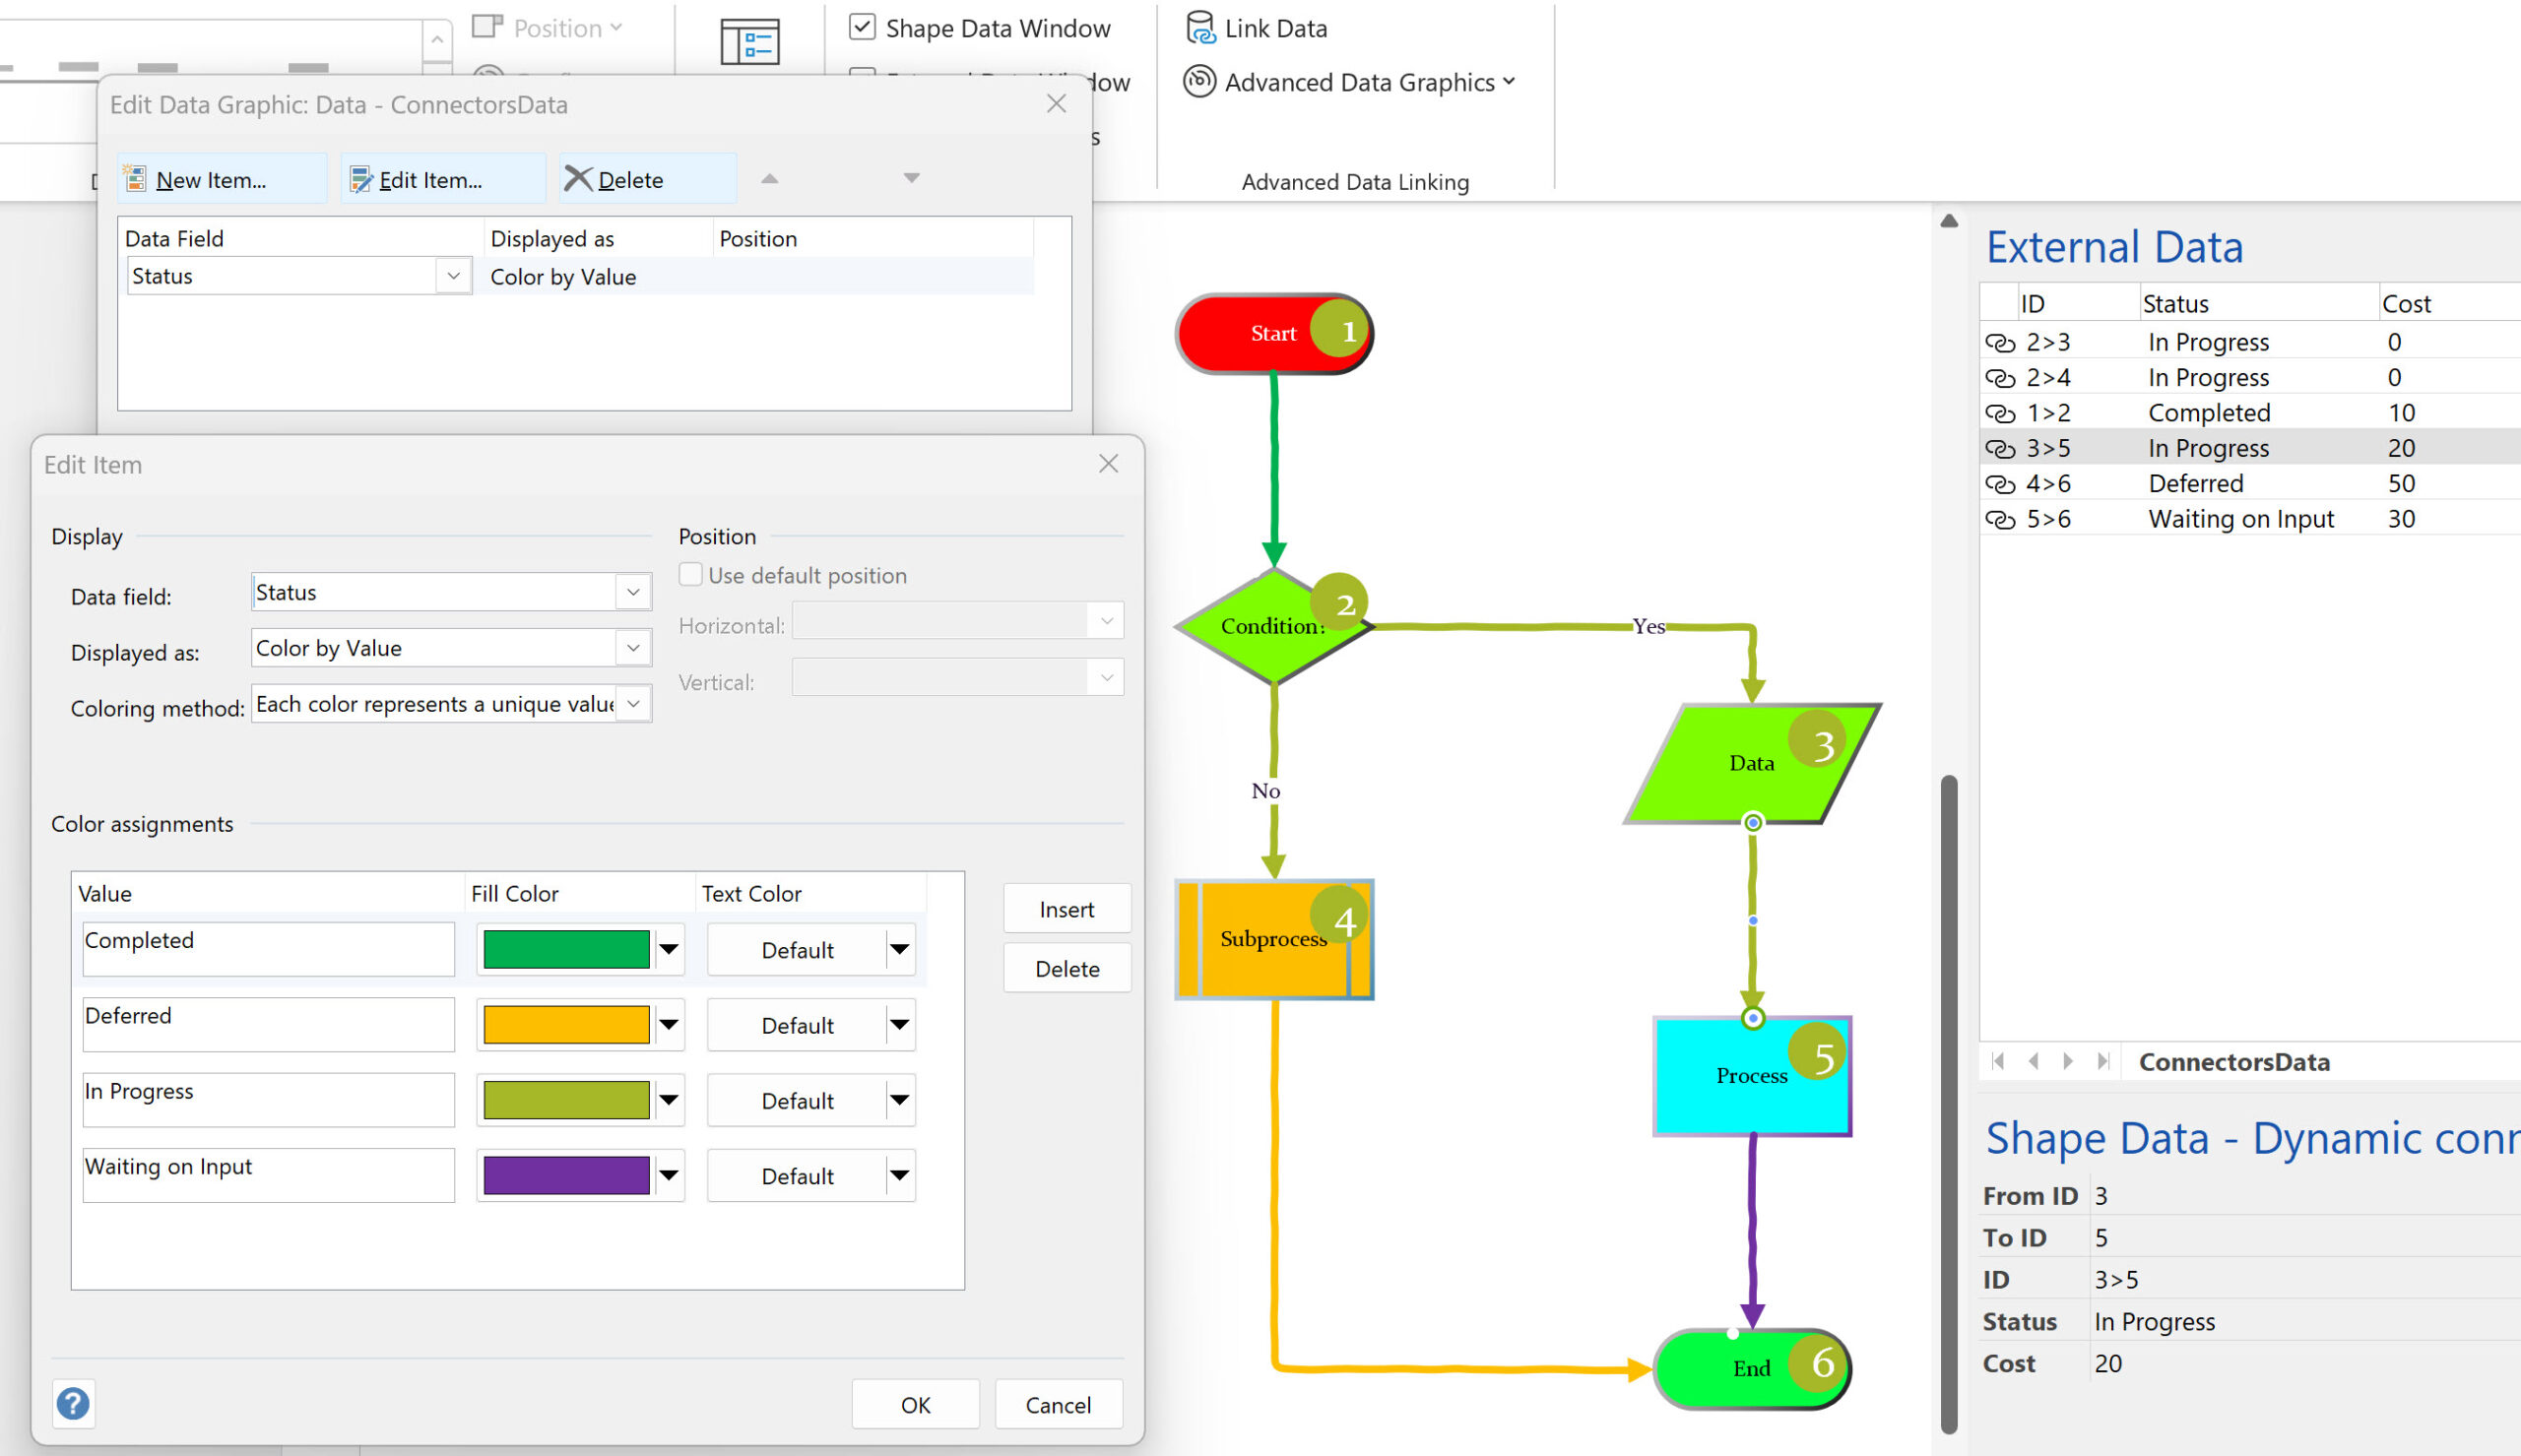
Using Visio Color by Value on Connectors
Data Graphics in Visio Plan 2 and Visio Professional is great, but it only enables us to use them with 2D shapes in Visio, i.e. not on connectors. So, what if you want to change the line colour of the connectors between the 2D shapes because of the data flowing between them? Well, it is…

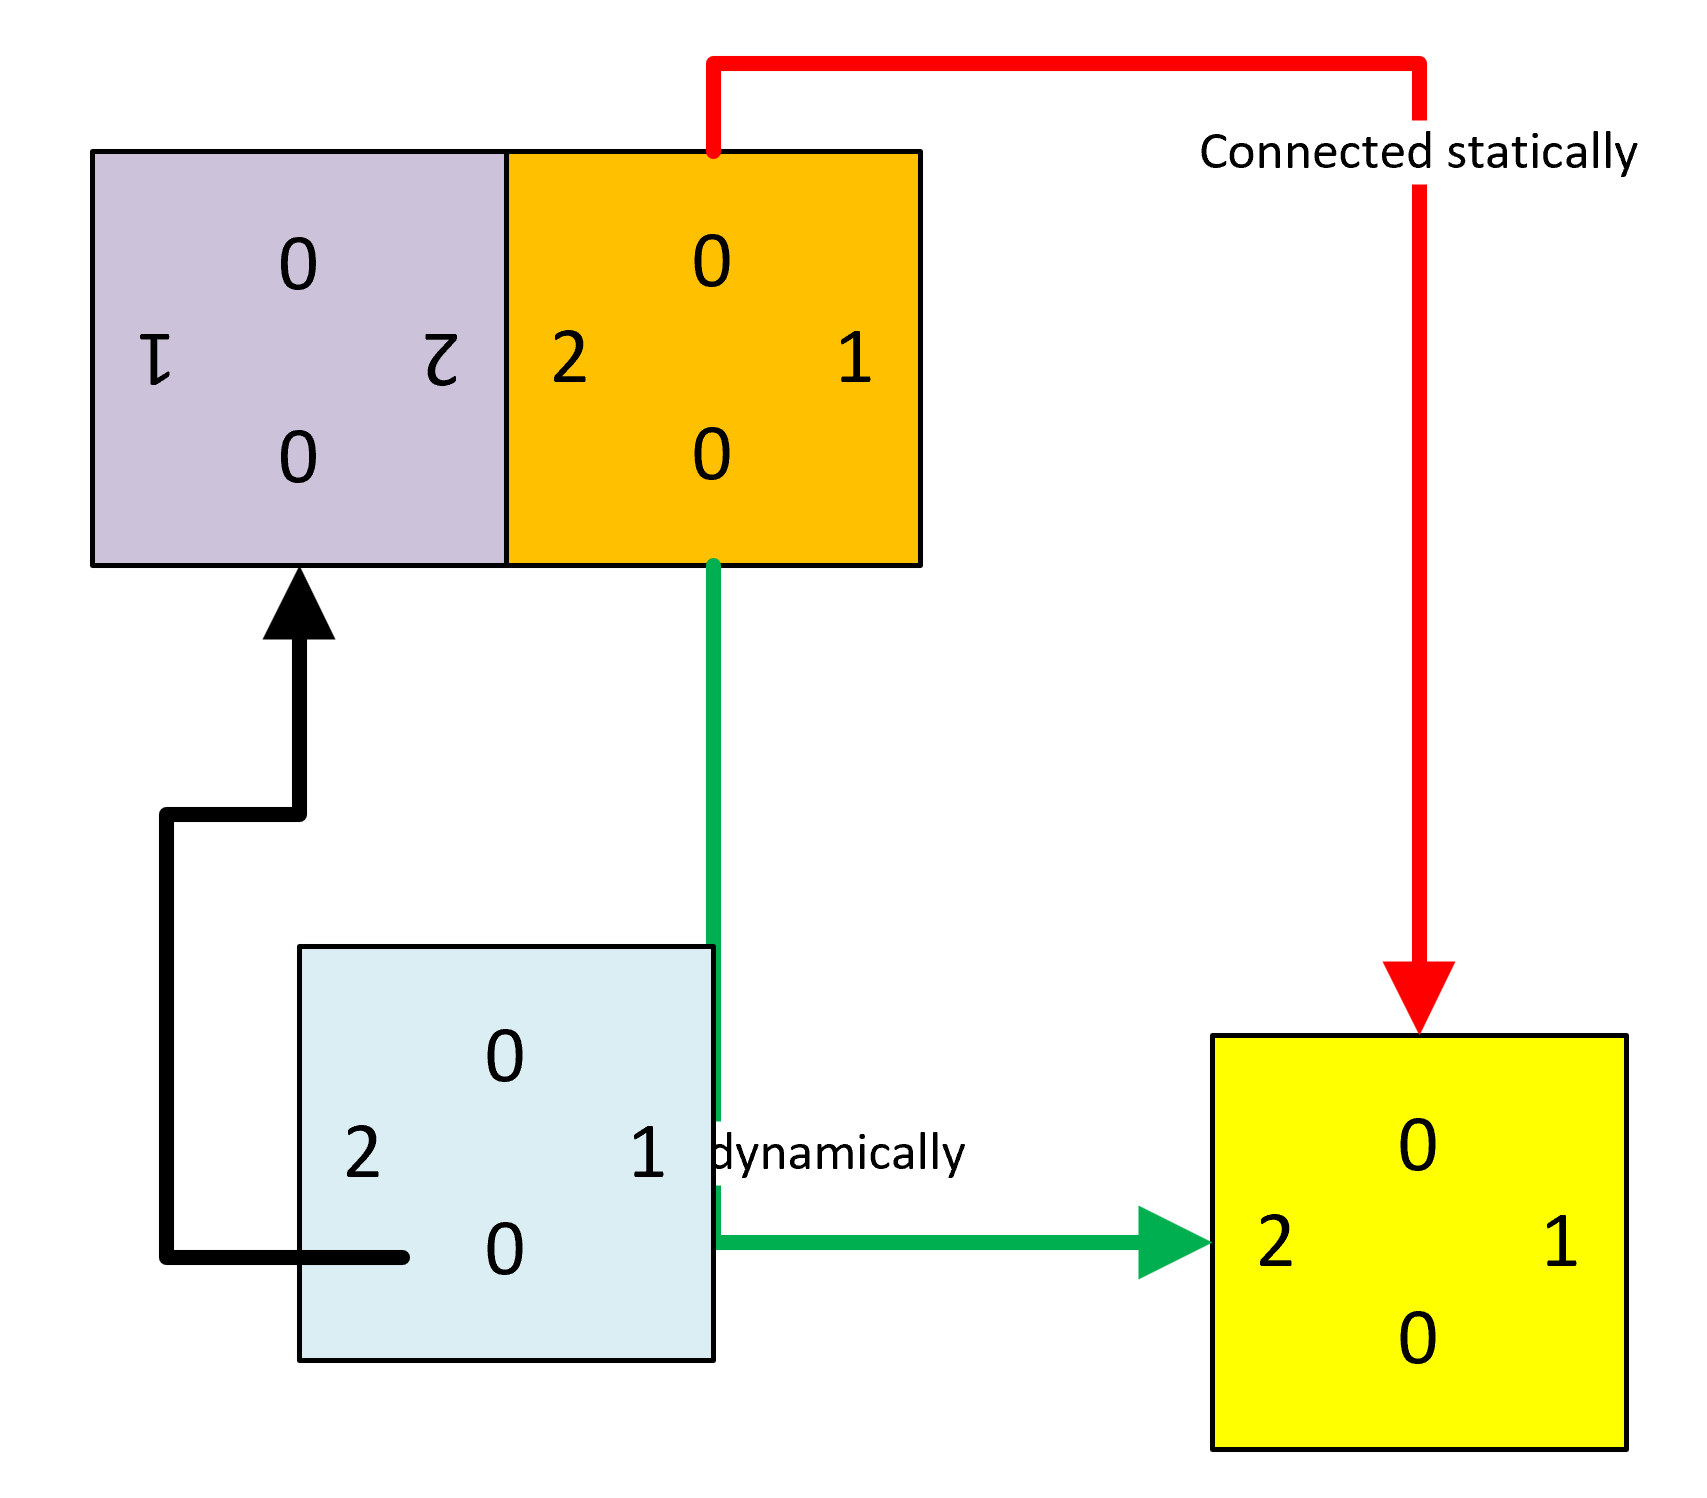
Counting glued and connected shapes in Visio
I got a surprise in one of my projects when I counted the shapes glued together using the Shape.GluedShapes(…) method … the sum of the filtered glued shapes just didn’t add up to the unfiltered count. So, I thought I should check the Shape.ConnectedShapes(…) method too … and there is a scenario where that has…

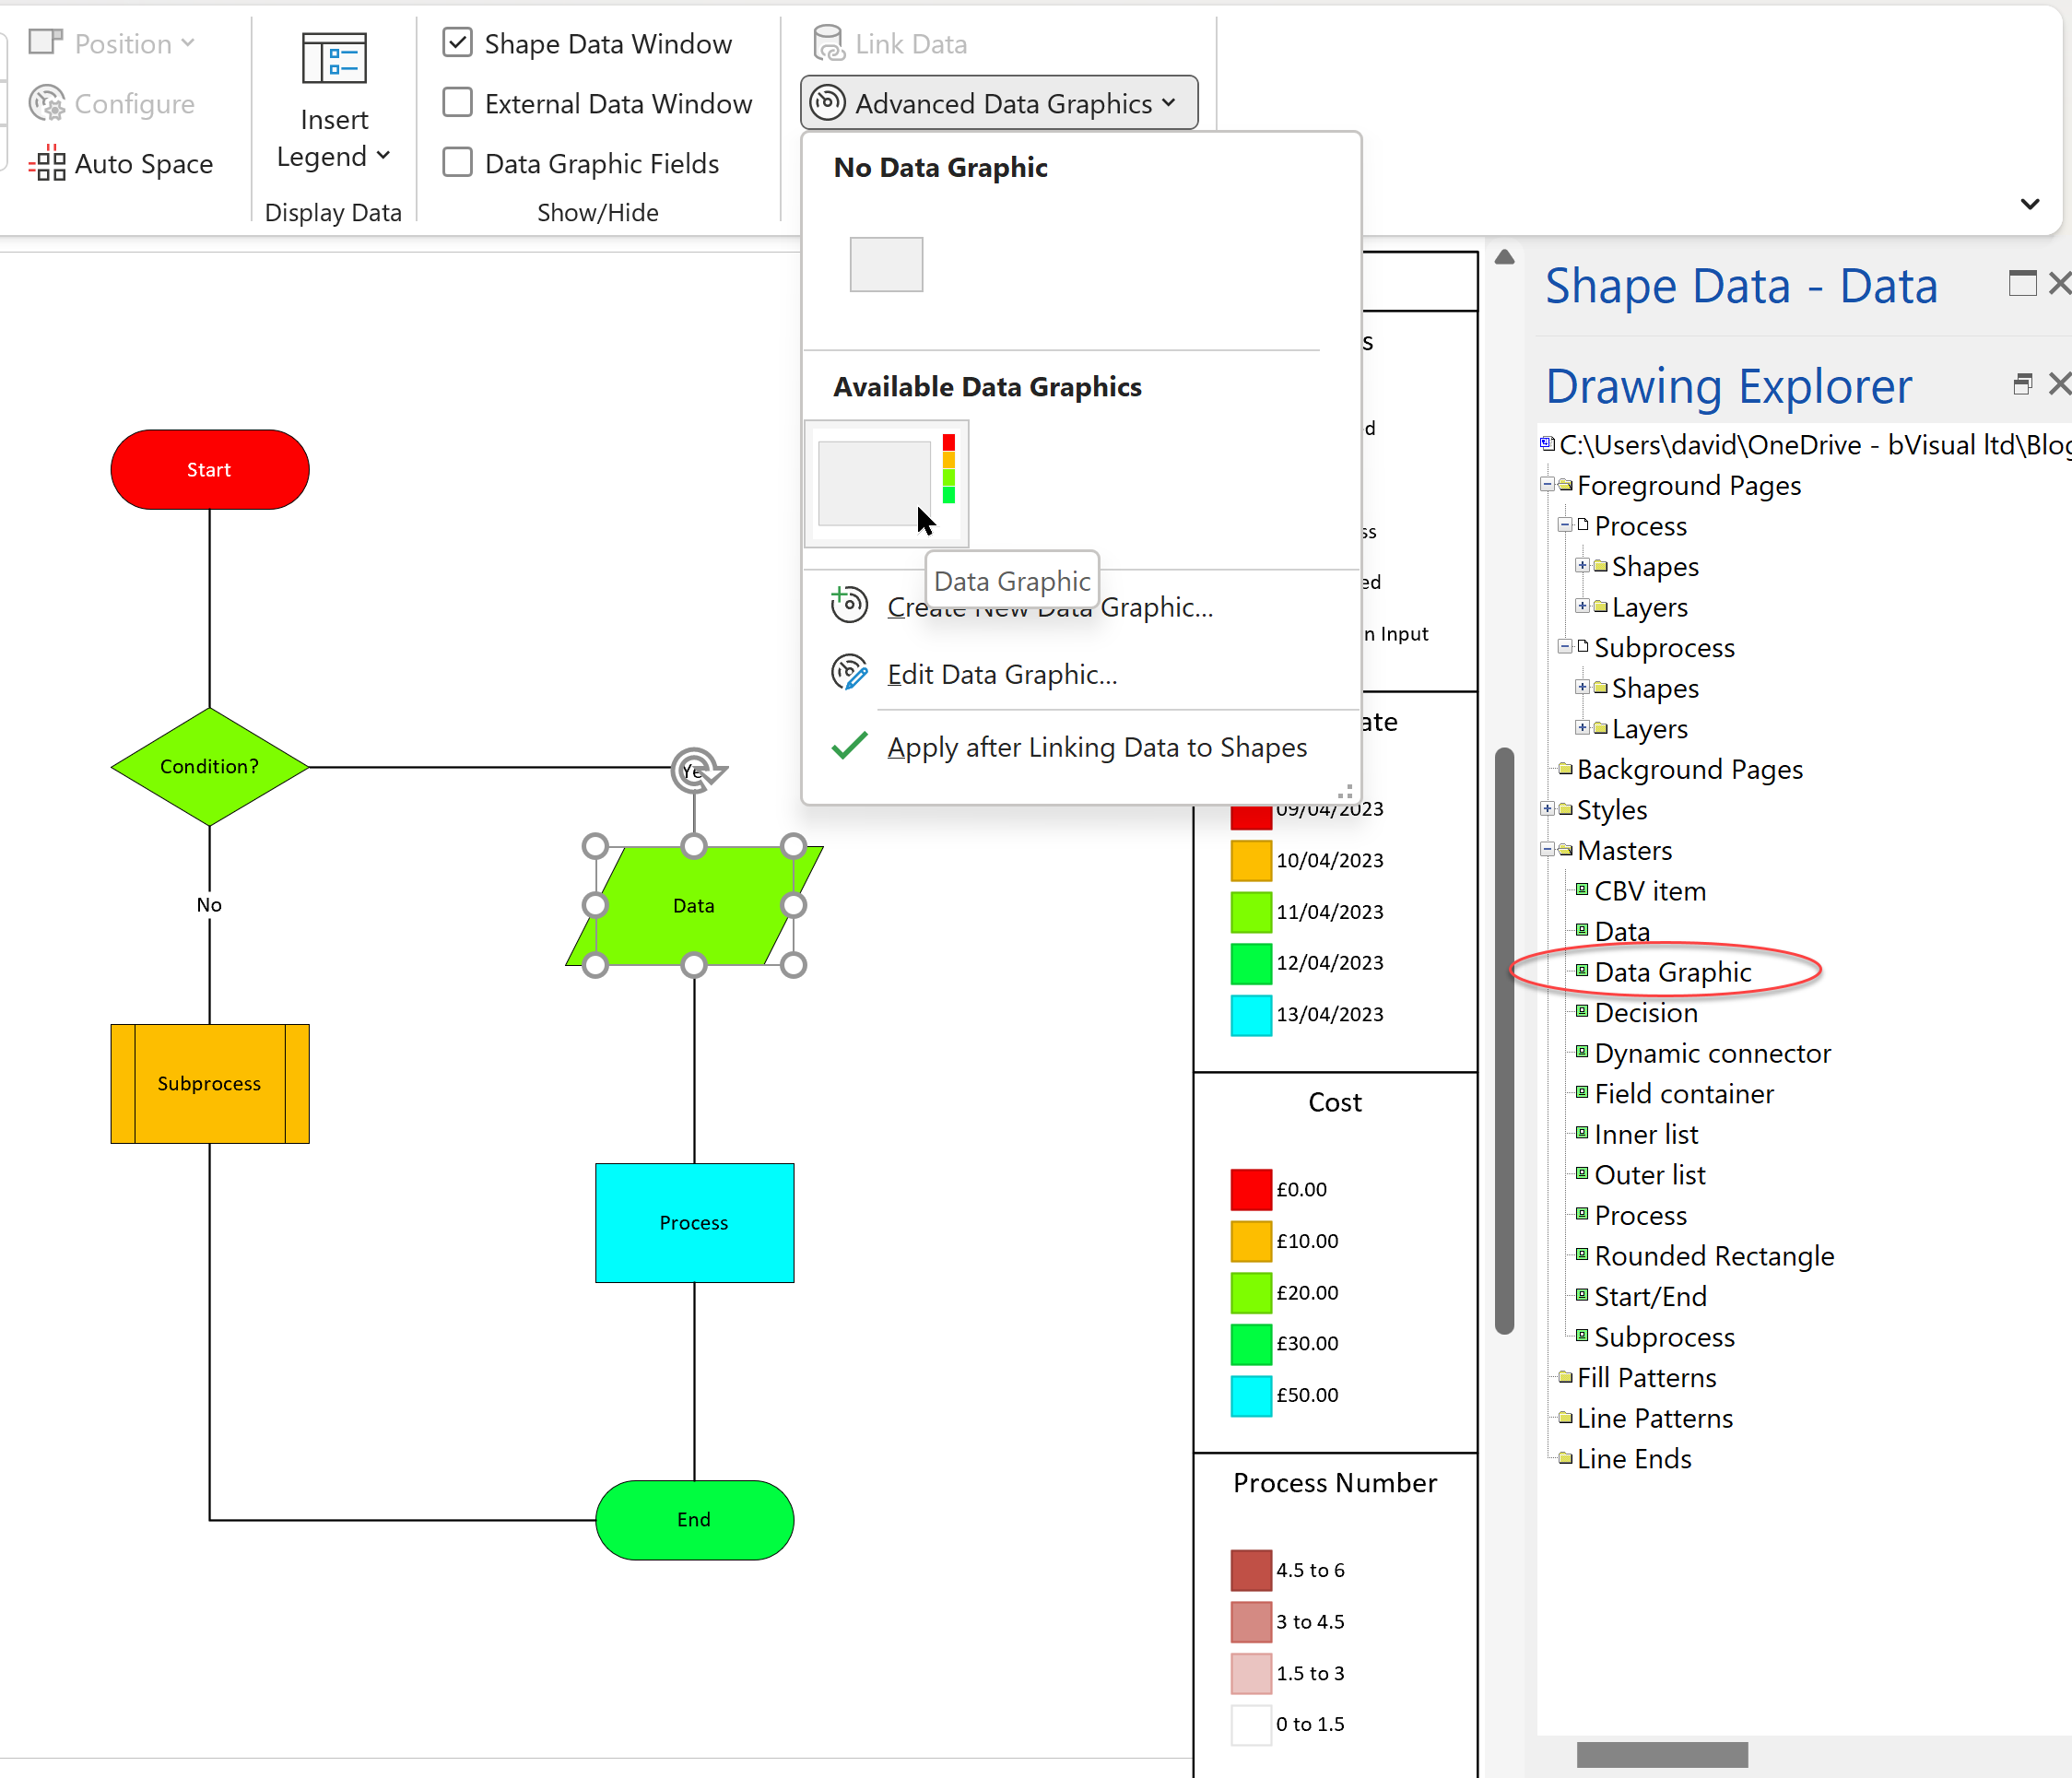
Understanding Visio Data Graphic’s Color by Value
The desktop Visio editions, Visio Professional and Visio Plan 2, have a great way of automatically displaying data as Data Bars, Icon Sets, Text Callouts and Color by Value. The first three types of Data Graphics require sub-shapes to be inserted into each shape that they are applied to, but the last one, Color by…