

When Microsoft introduced a new way of linking external data to Visio shapes in 2007, I initially bemoaned the inability to update anything but Shape Data row values, unlike the old database add-on that I had been using for 10 years. The new method, though, has many advantages over the old way, not least that it is part of the Visio code library, for any Visio desktop user except the Standard edition.
The smartness of Visio shapes is derived from the formulas in the ShapeSheet that lies behind everything. There is a developer interface into this ShapeSheet in every desktop edition, but there is none in any of the web editions, even though the formulas, for the most part, work perfectly well (see my series of posts ShapeSheet Functions A-Z ).
The newer methodology of linking Visio shapes to data can also be used to refresh Visio diagrams automatically, even if the Visio document is not opened in the desktop edition. The Visio documents merely need to be stored in OneDrive, SharePoint (or Teams). This makes it suitable for solution development without assuming that every consumer has a desktop license. Indeed, the Visio Data Visualizer utilizes these newer external data recordsets embedded within the Visio document.
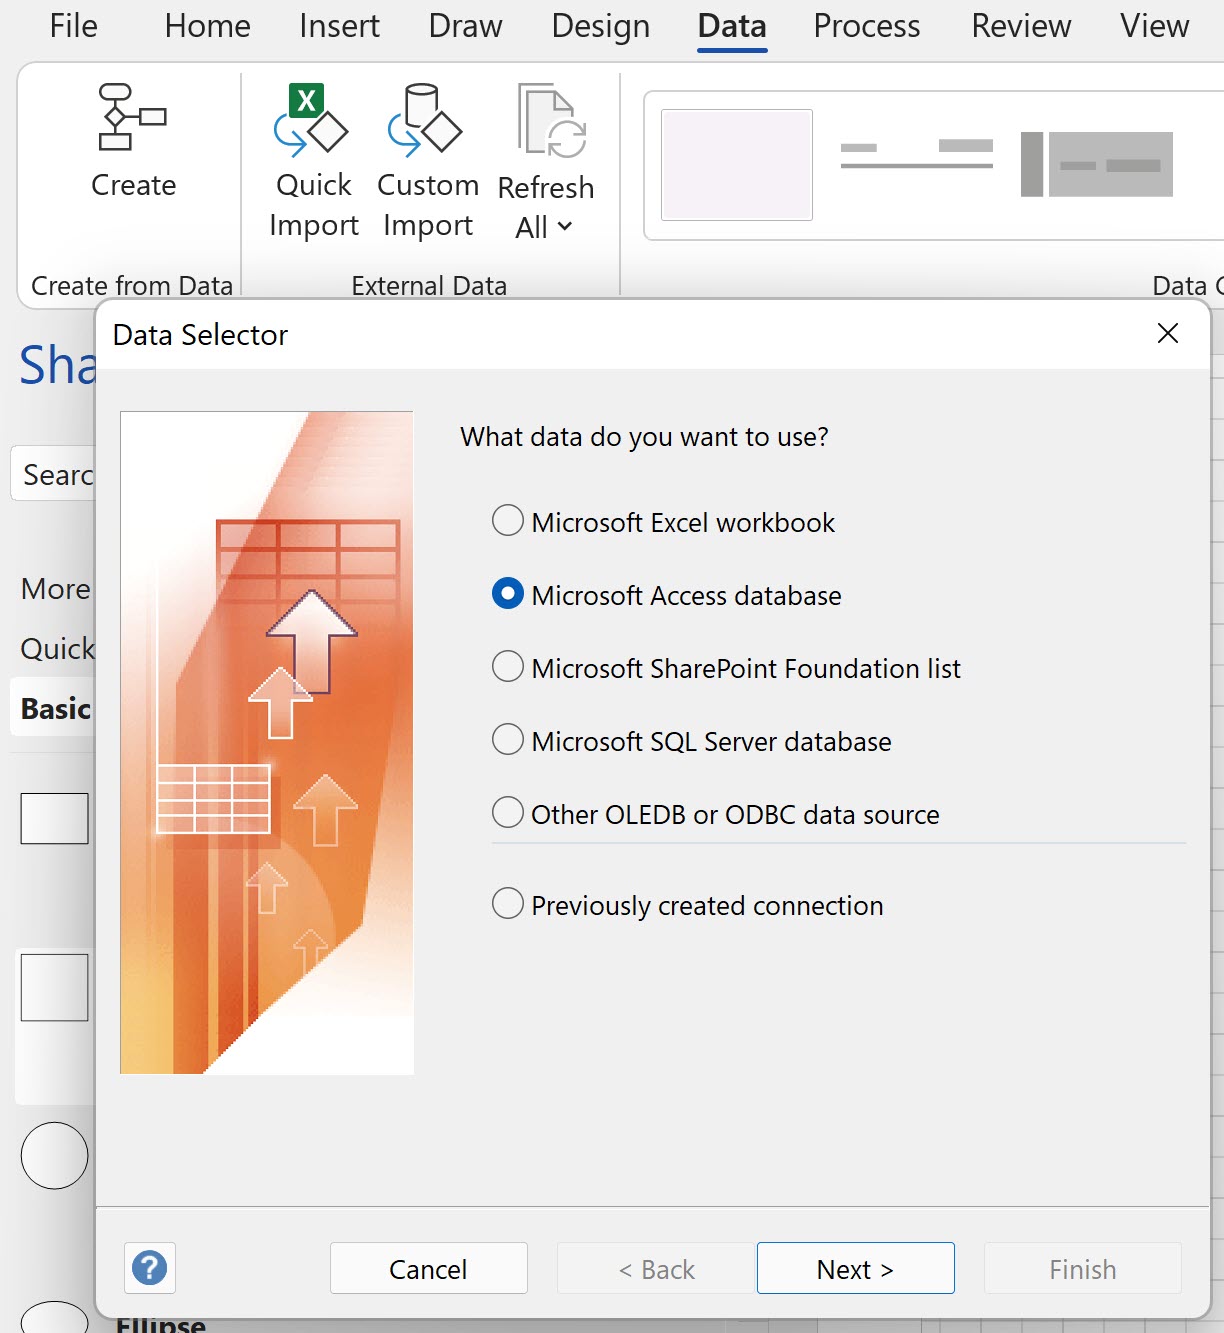
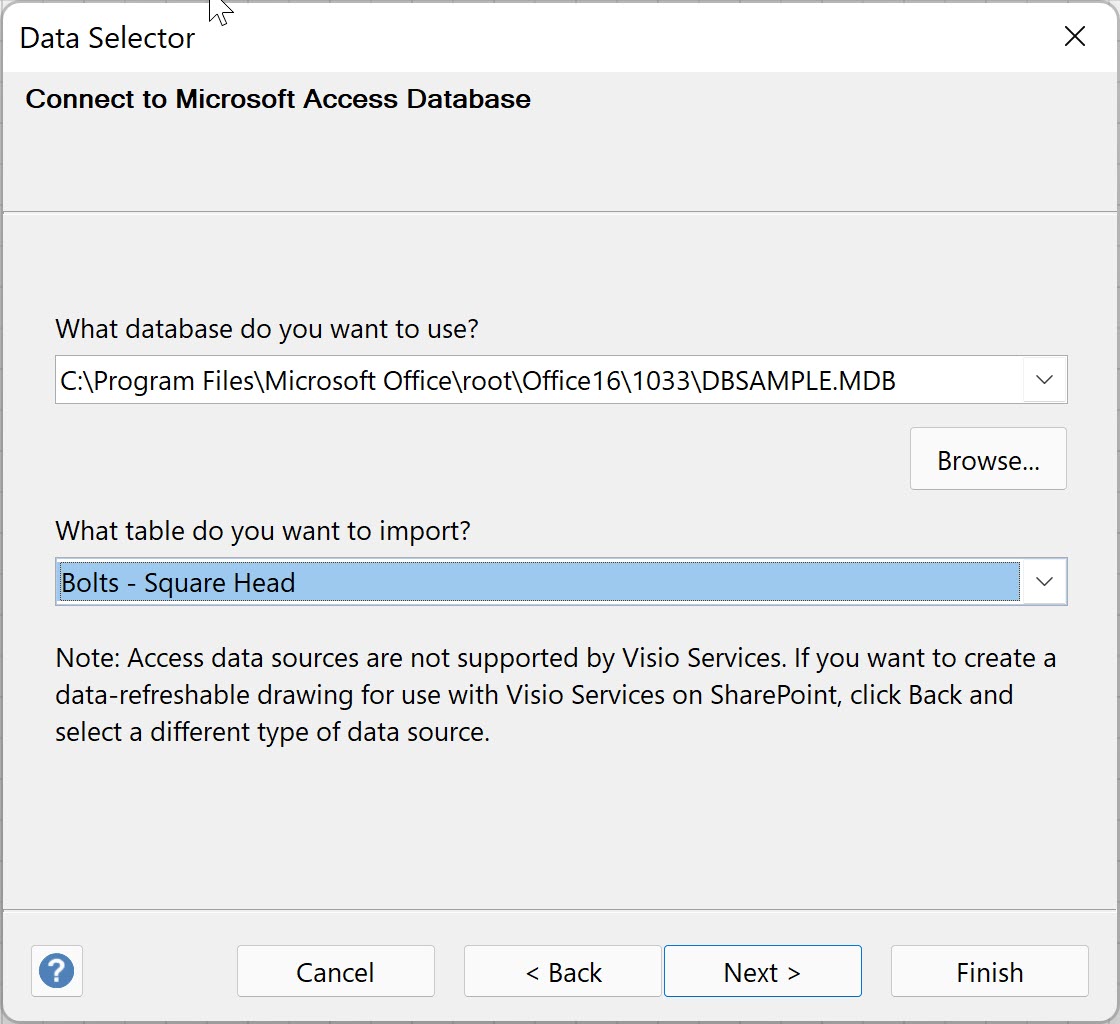
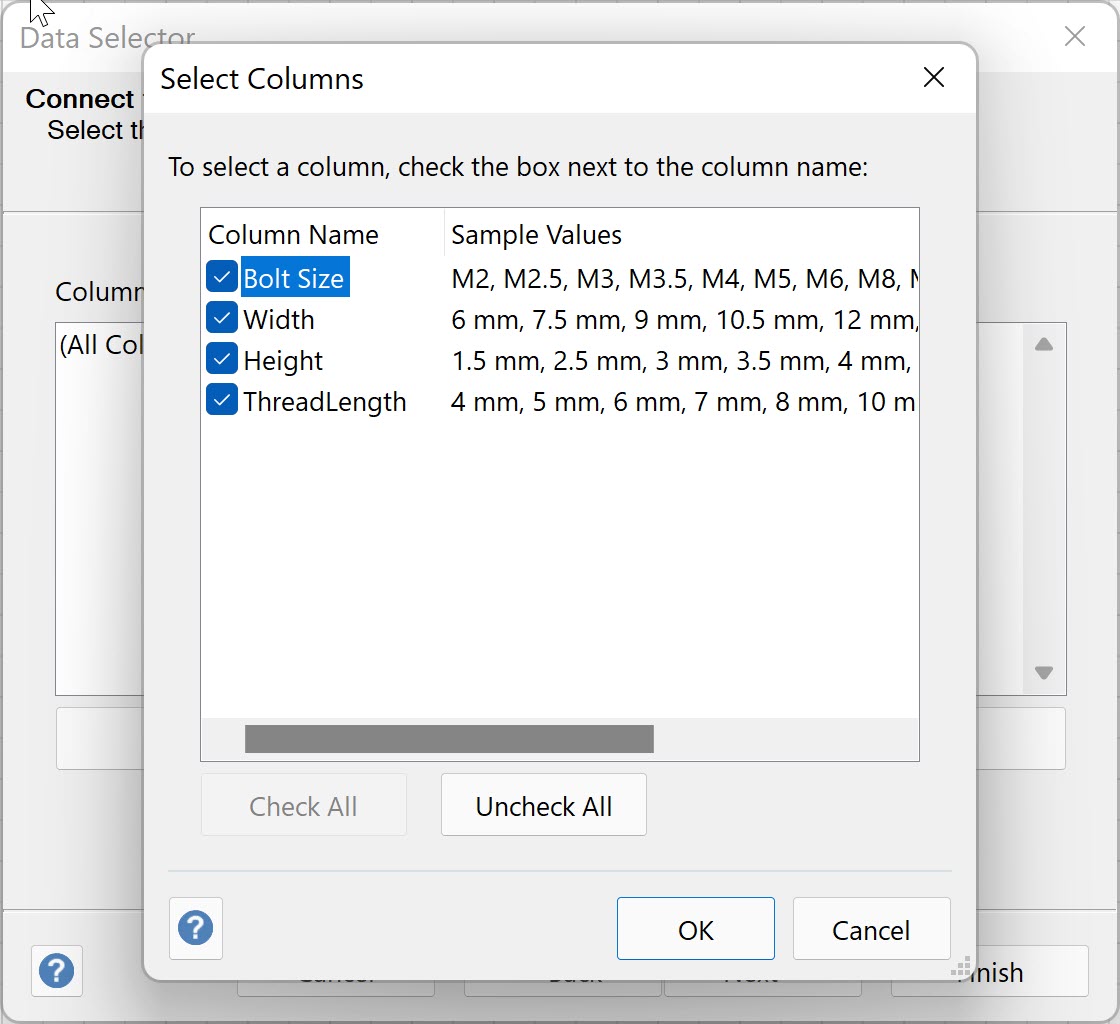
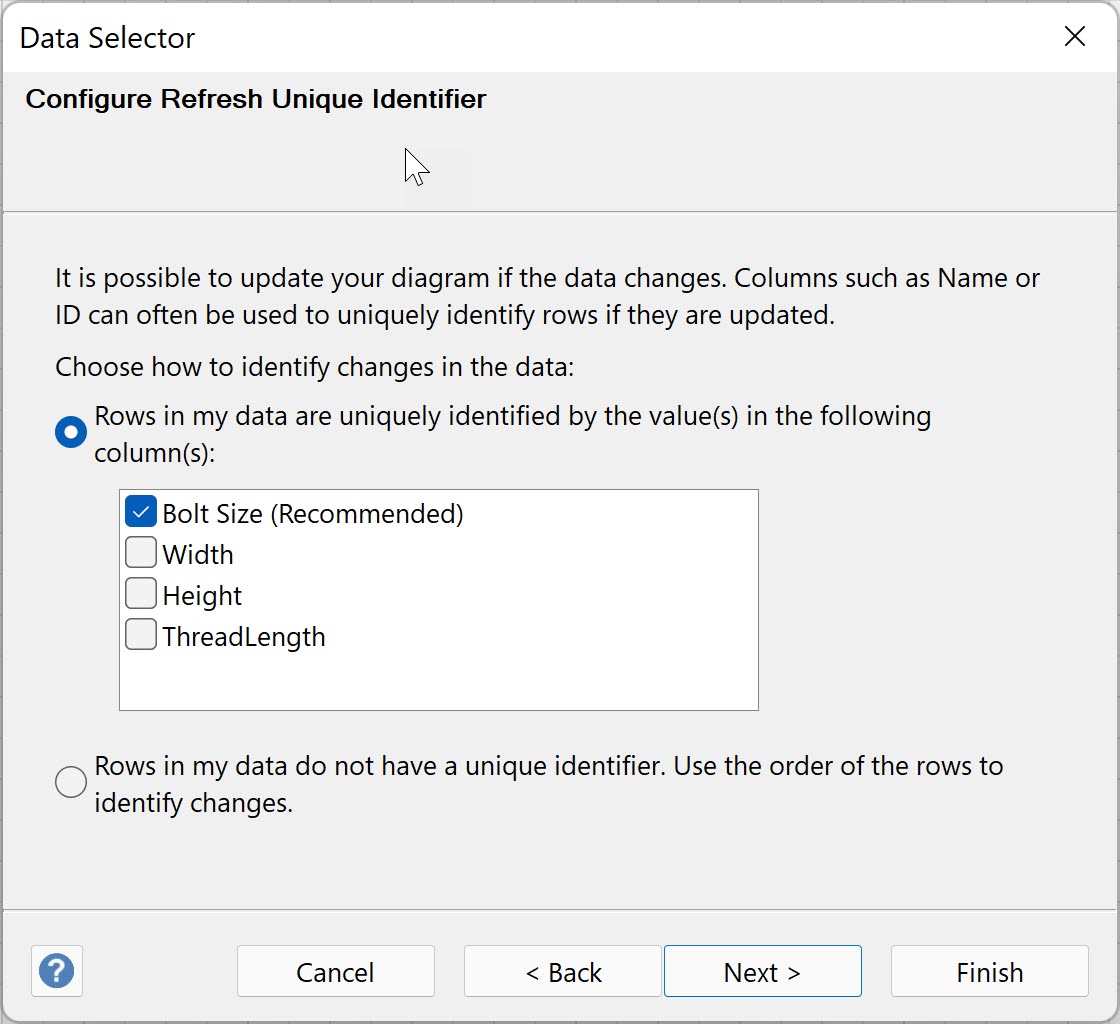
For my example, I used the Visio Sample Database that has been installed with Visio since 1997 for demonstrating the old database linking technology. It is an old style Access database (mdb), and can be found in a sub-folder of the Visio installation folder. I simply used the Data \ External Data \ Custom Import command to import the Bolts – Square Head table.


This will display the selected table in the External Data window in Visio, and simply dragging and dropping a row from this recordset onto the page, will automatically create a Rectangle master shape (unless you had another master selected), and adds the data columns as Shape Data rows, and usually displays some of this data as Data Graphics.

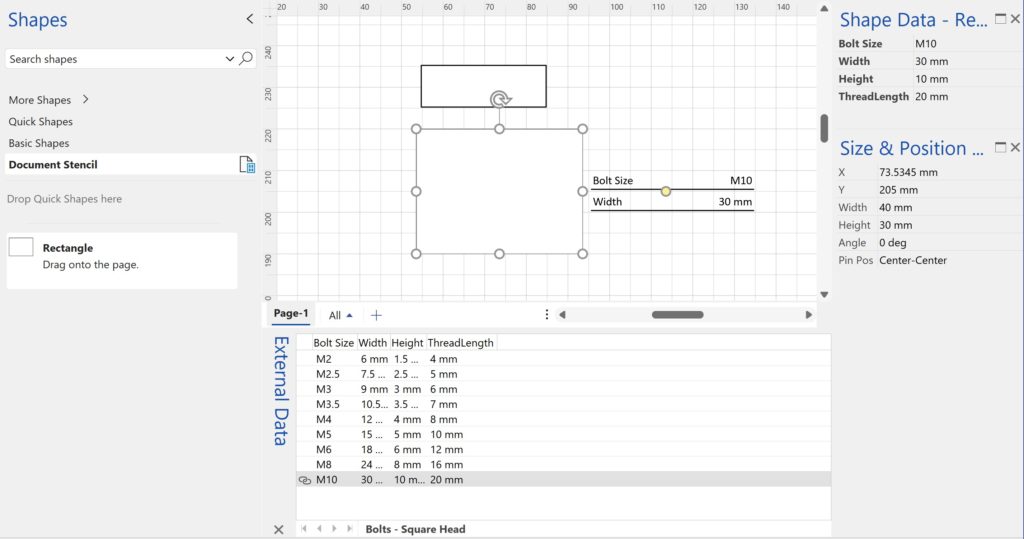
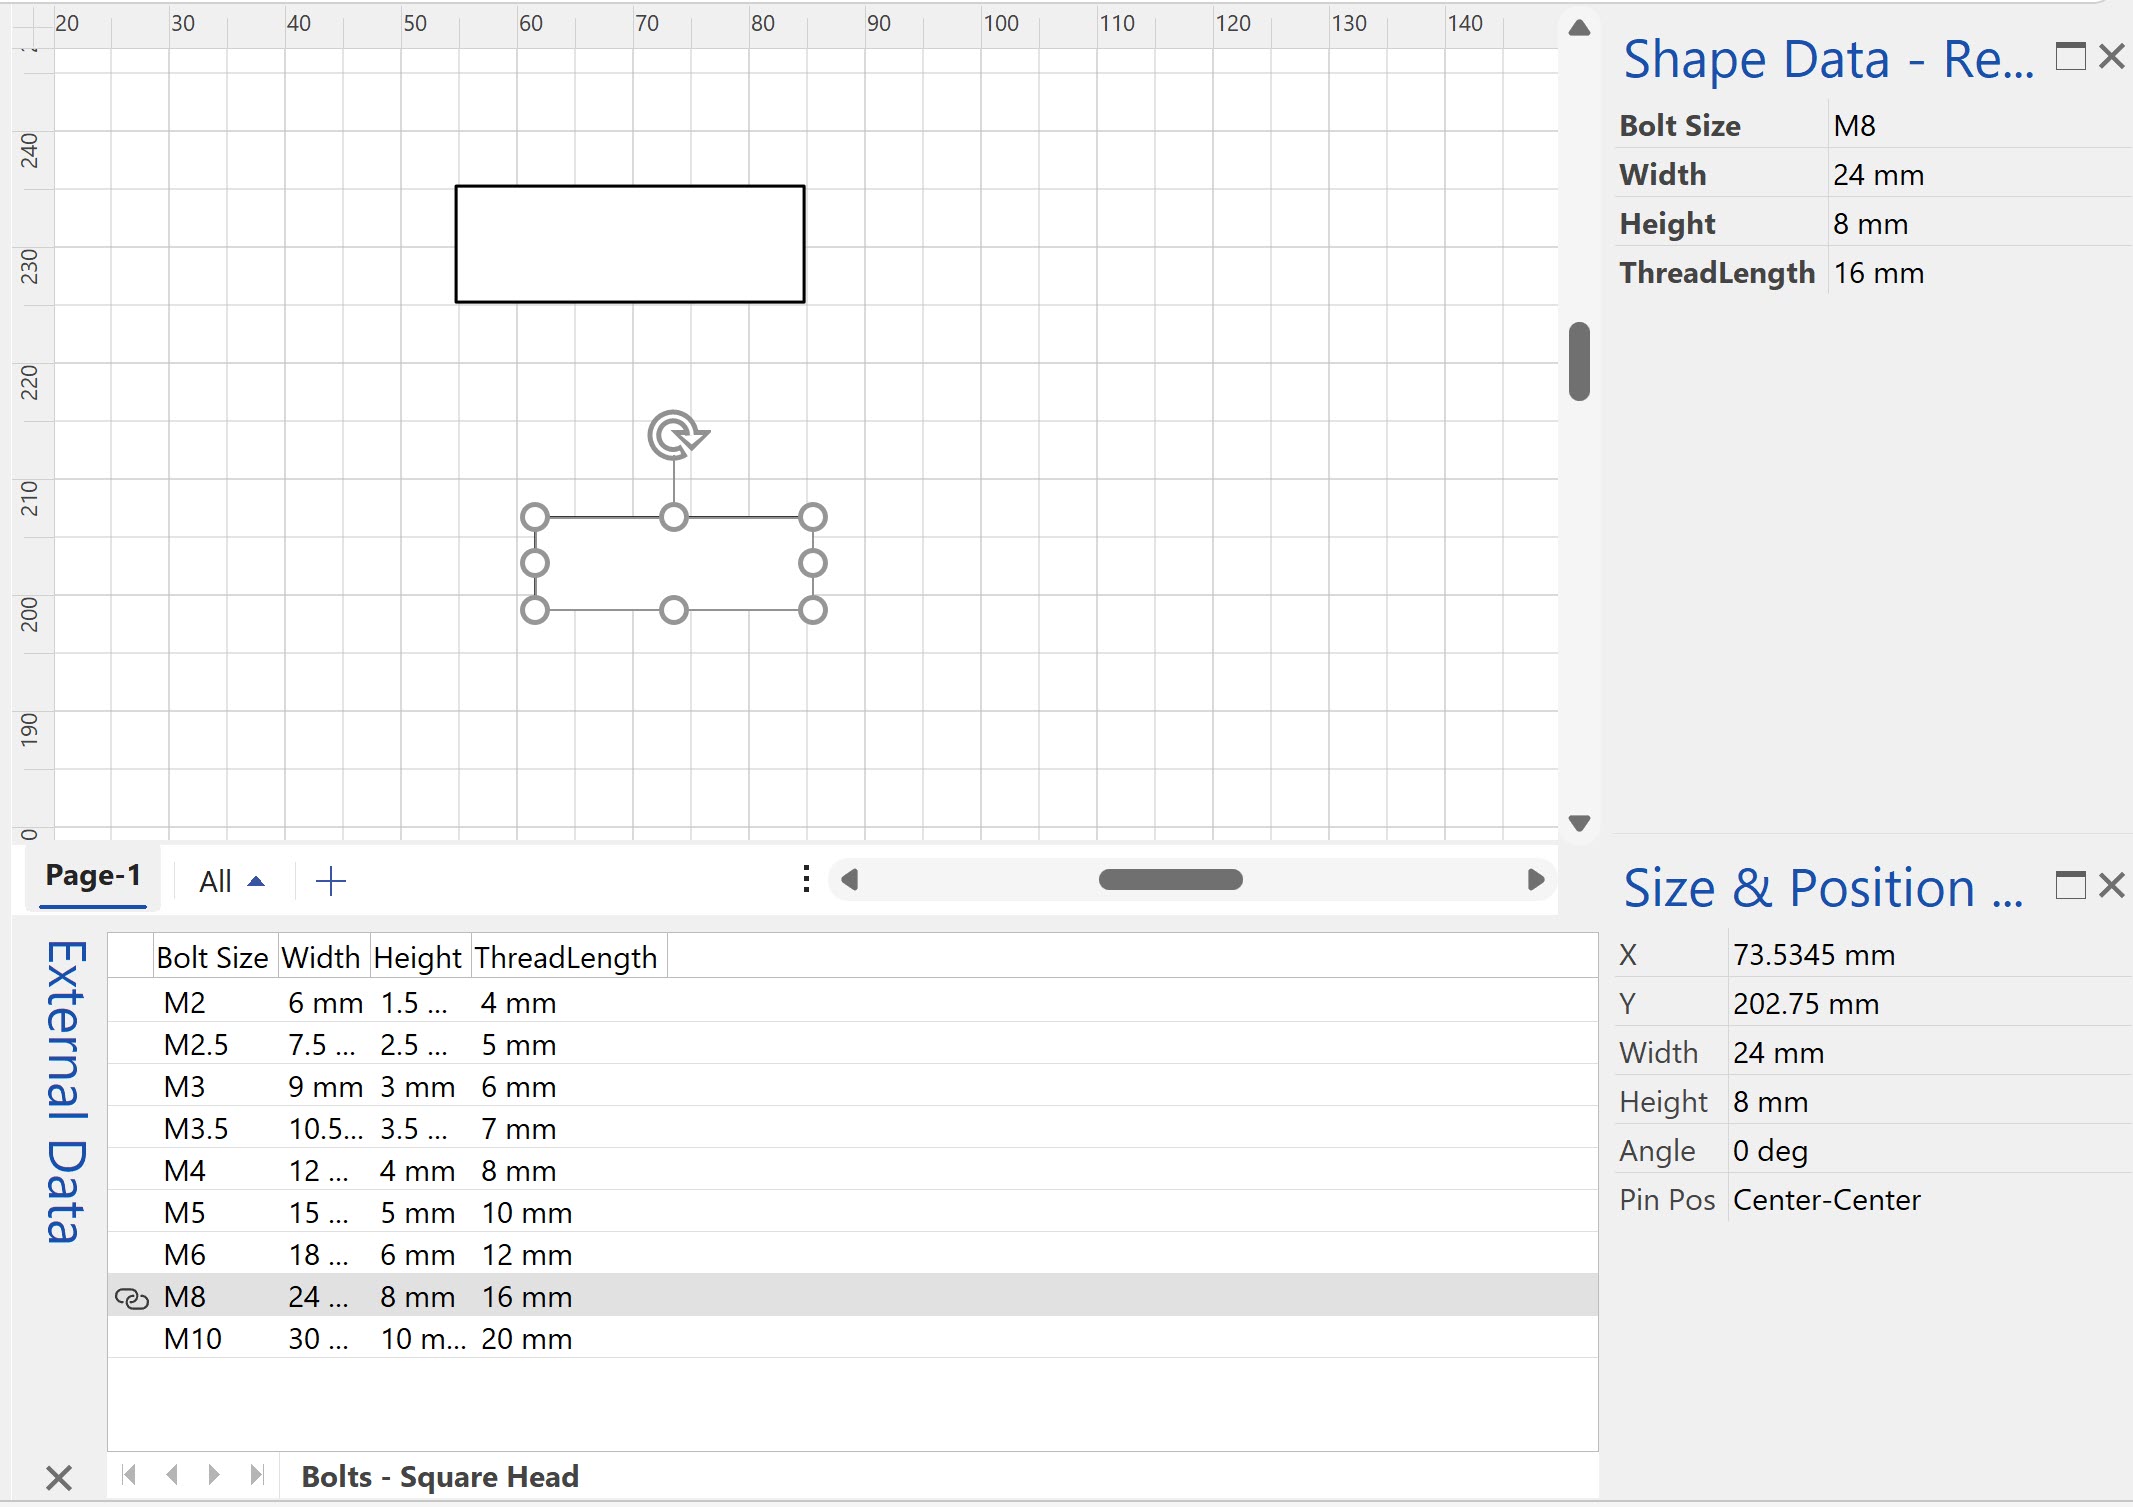
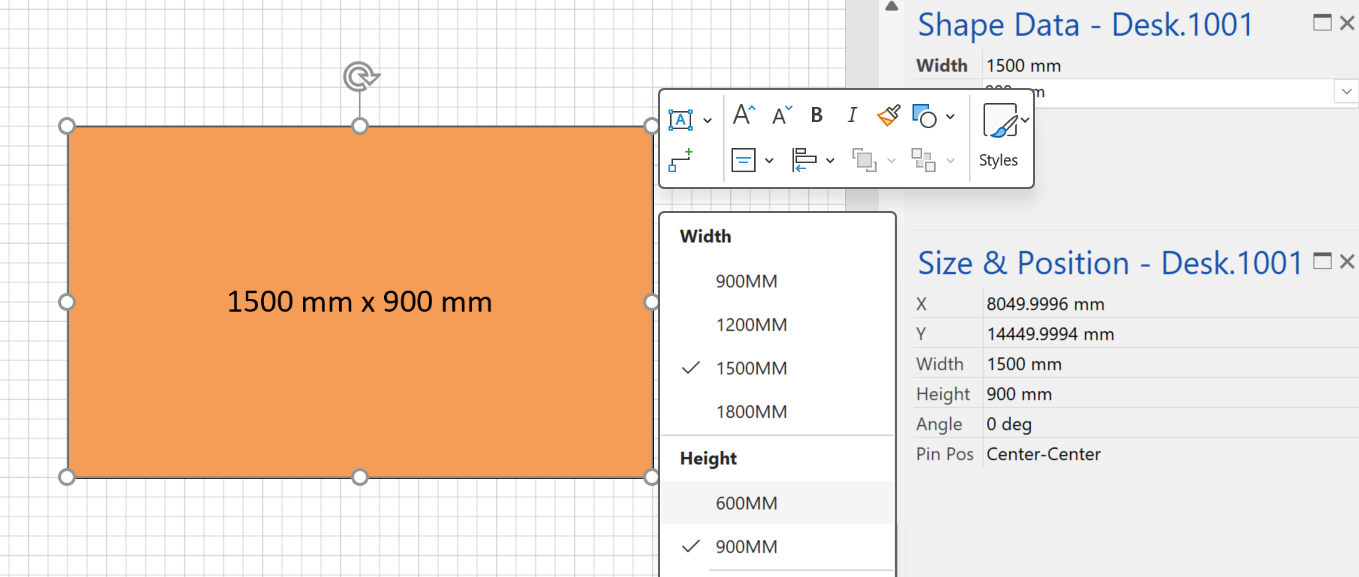
Well, the automatically applied data graphics can be switched off by unticking the Data \ Advanced Data Linking \ Advanced Data Graphics \ Apply after Linking Data to Shapes option, but notice that the shape size has not changed to reflect the values in the Width and Height columns.
This can be fixed by entering a SETATREF(…) function into the Shape Data value cells whose values you want to re-direct to another cell. In this case the formulas =SETATREF(Width) and =SETATREF(Height), are entered into the Prop._visDM_Width.Value and Prop._visDM_Height.Value cells.

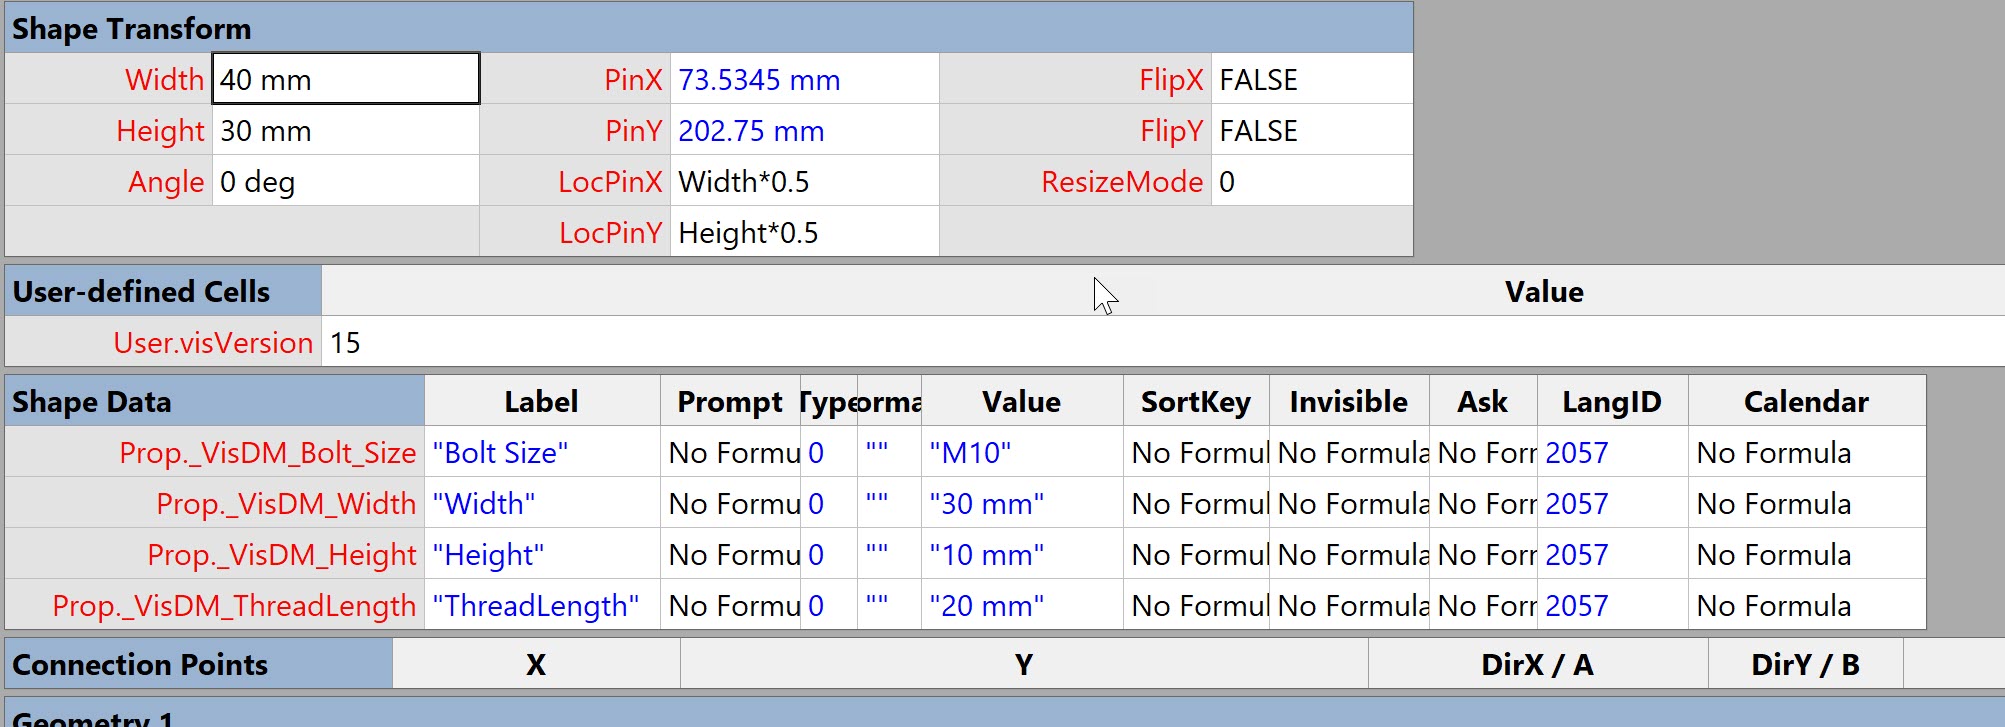

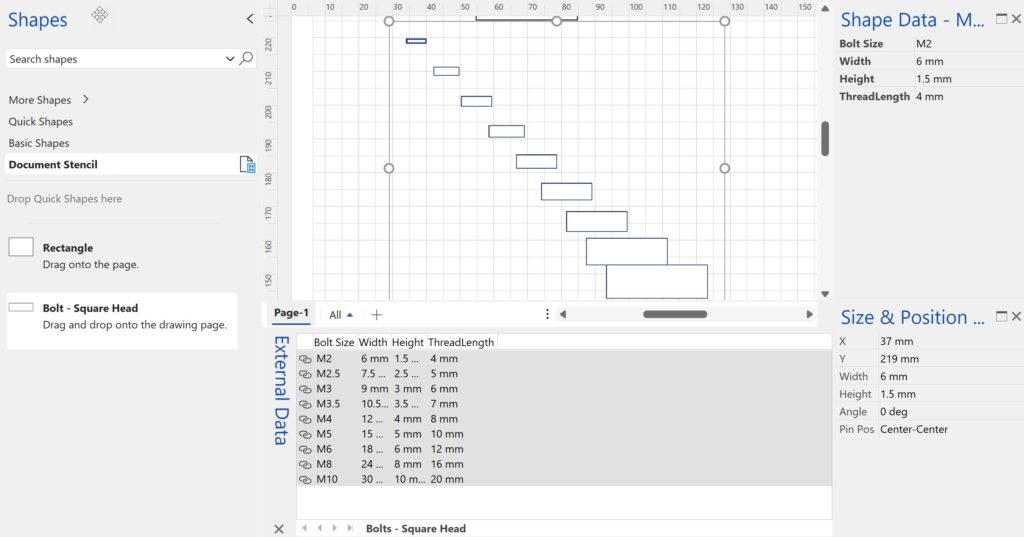
The Width and Height of the shape is then automatically set to the desired values, and if a different row from the recordset is dragged and dropped onto the same shape, then the values are replaced, and the shape automatically changes size.


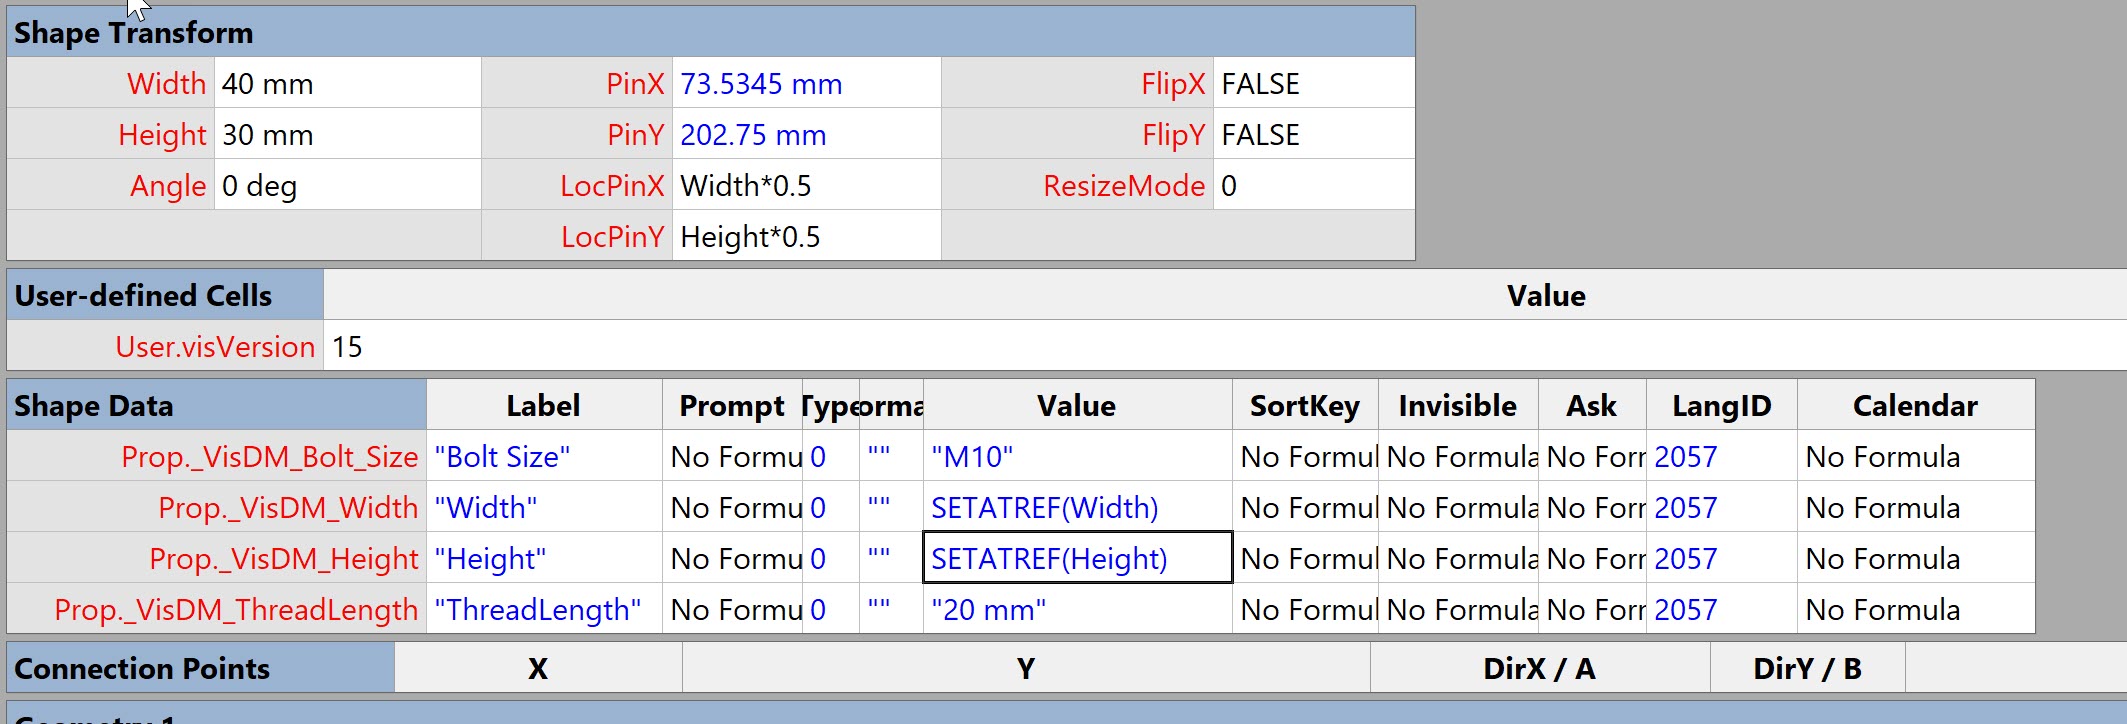
All that is required now is to drag and drop this shape on to a stencil to create a master shape, which I called Bolt Head – Square Head. Now this master can be used to create multiple shape copies by simply dragging and dropping from multiple rows from the External Data window, whilst the Bolt – Square Head master is selected in the stencil.

The values in the Width and Height Shape Data rows can also be manually entered using the Shape Data window, but, if that is not required, then their Invisible cell should have =TRUE in them. This will hide them from the user-interface in the Shape Data window.
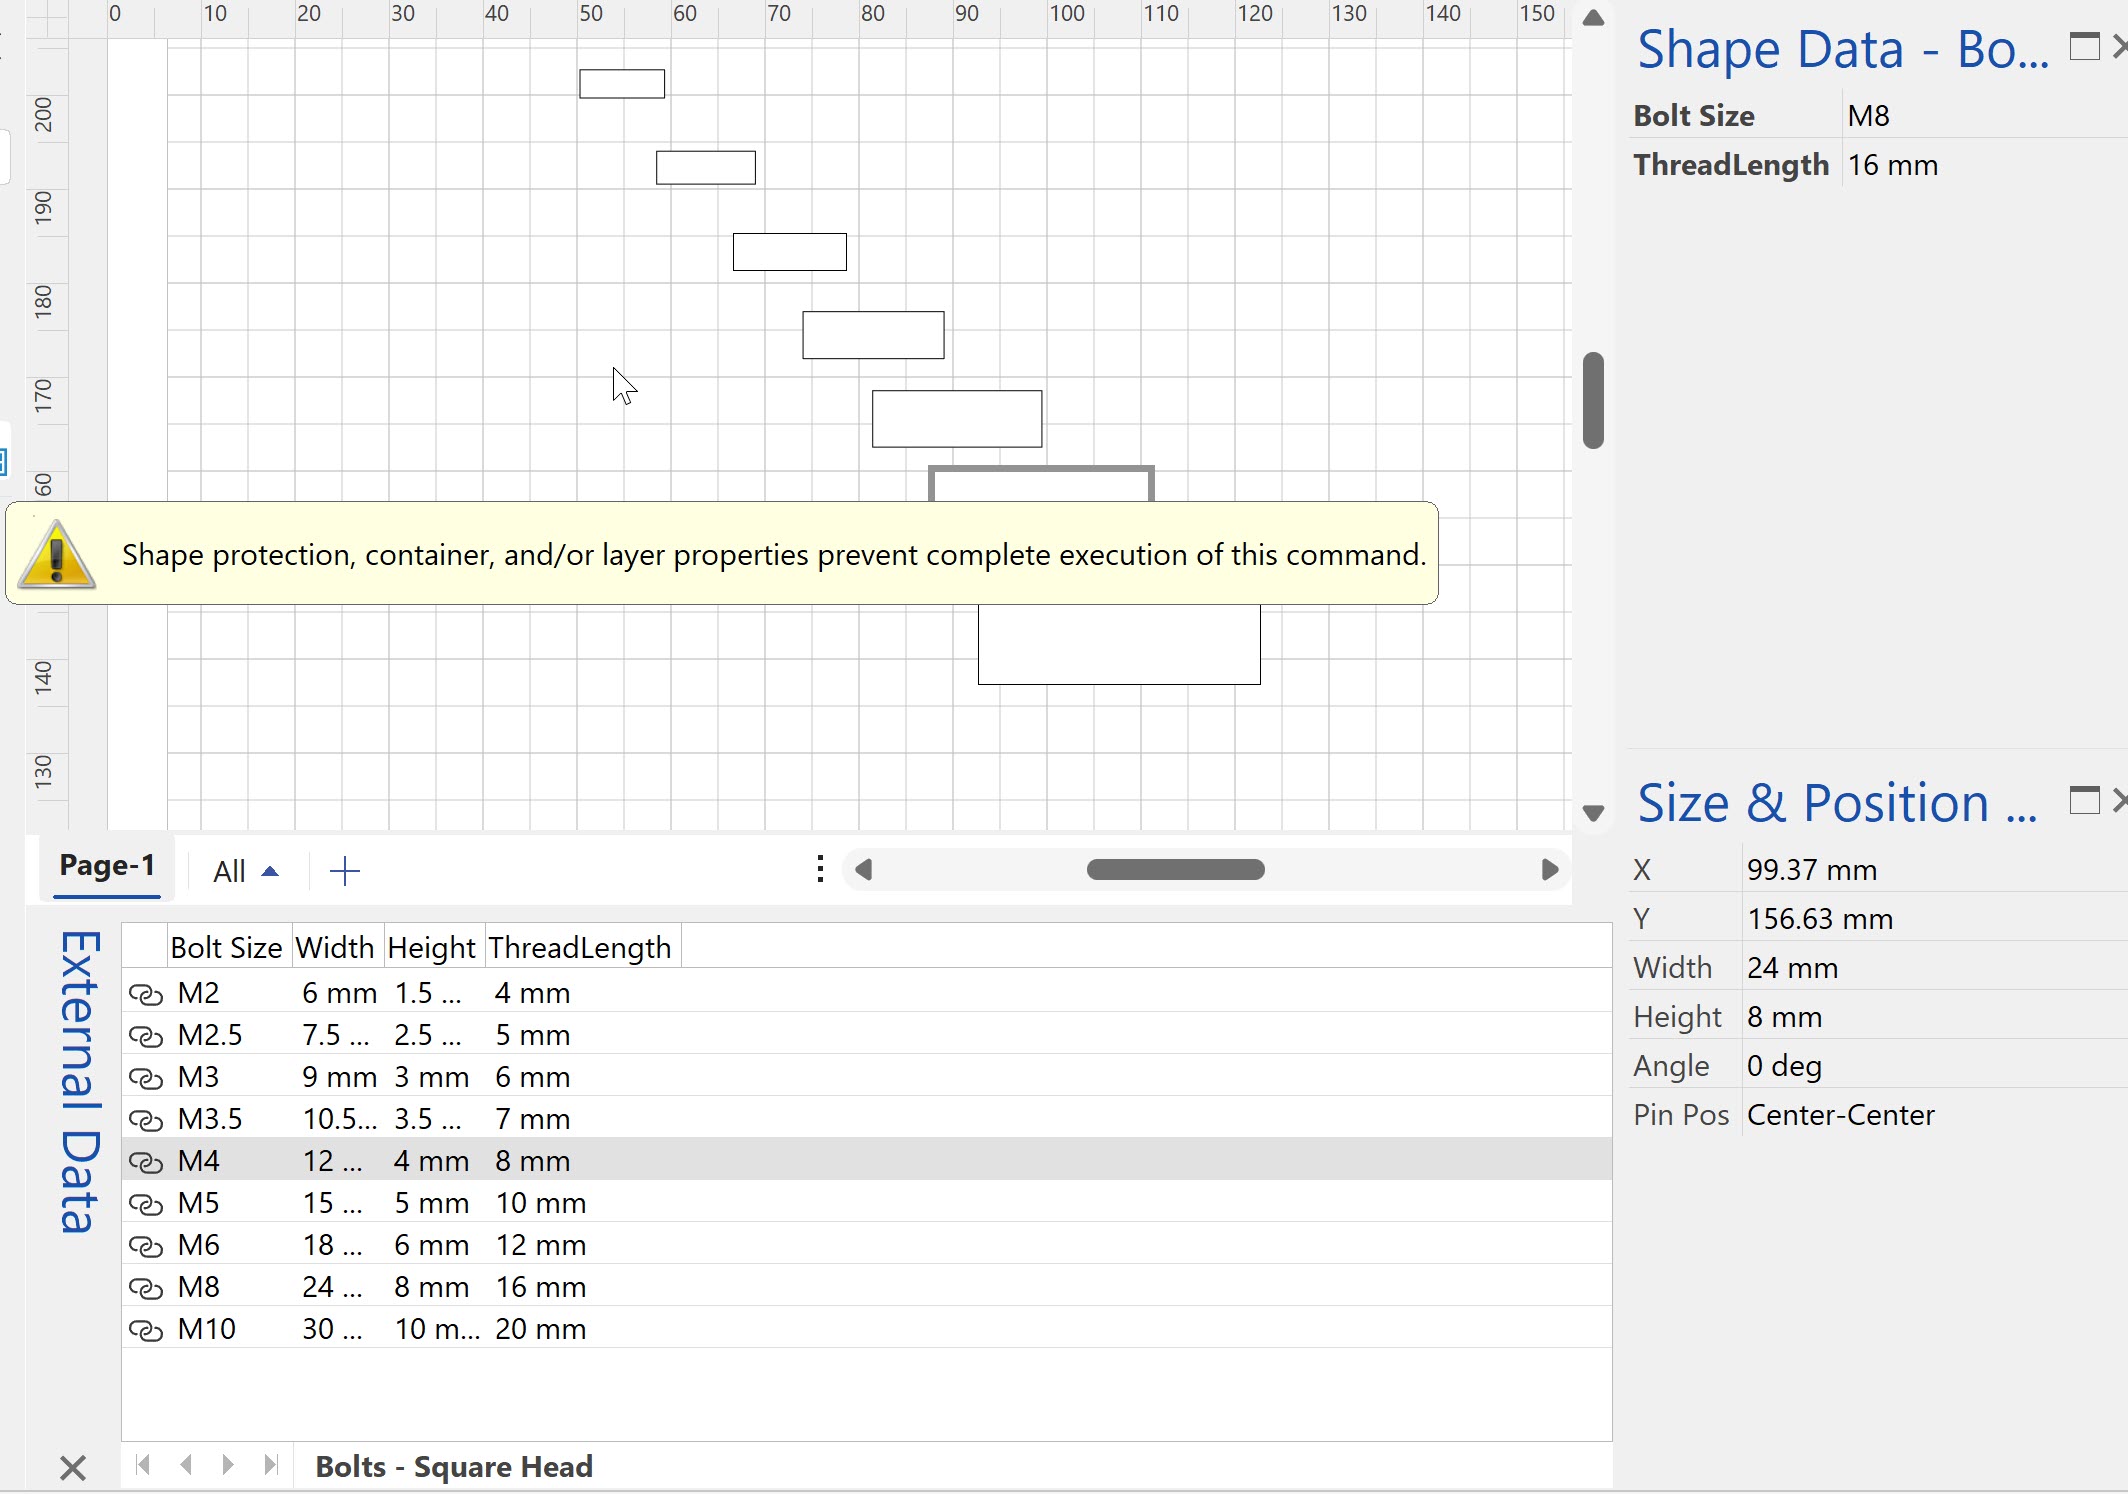
However, if you want to also prevent the user from manually resizing the shape with the mouse or with the Size & Position window, then simply enter =1 into the LockWidth and LockHeight cells in the ShapeSheet. The shape Width and Height can now only be updated from the source data columns.

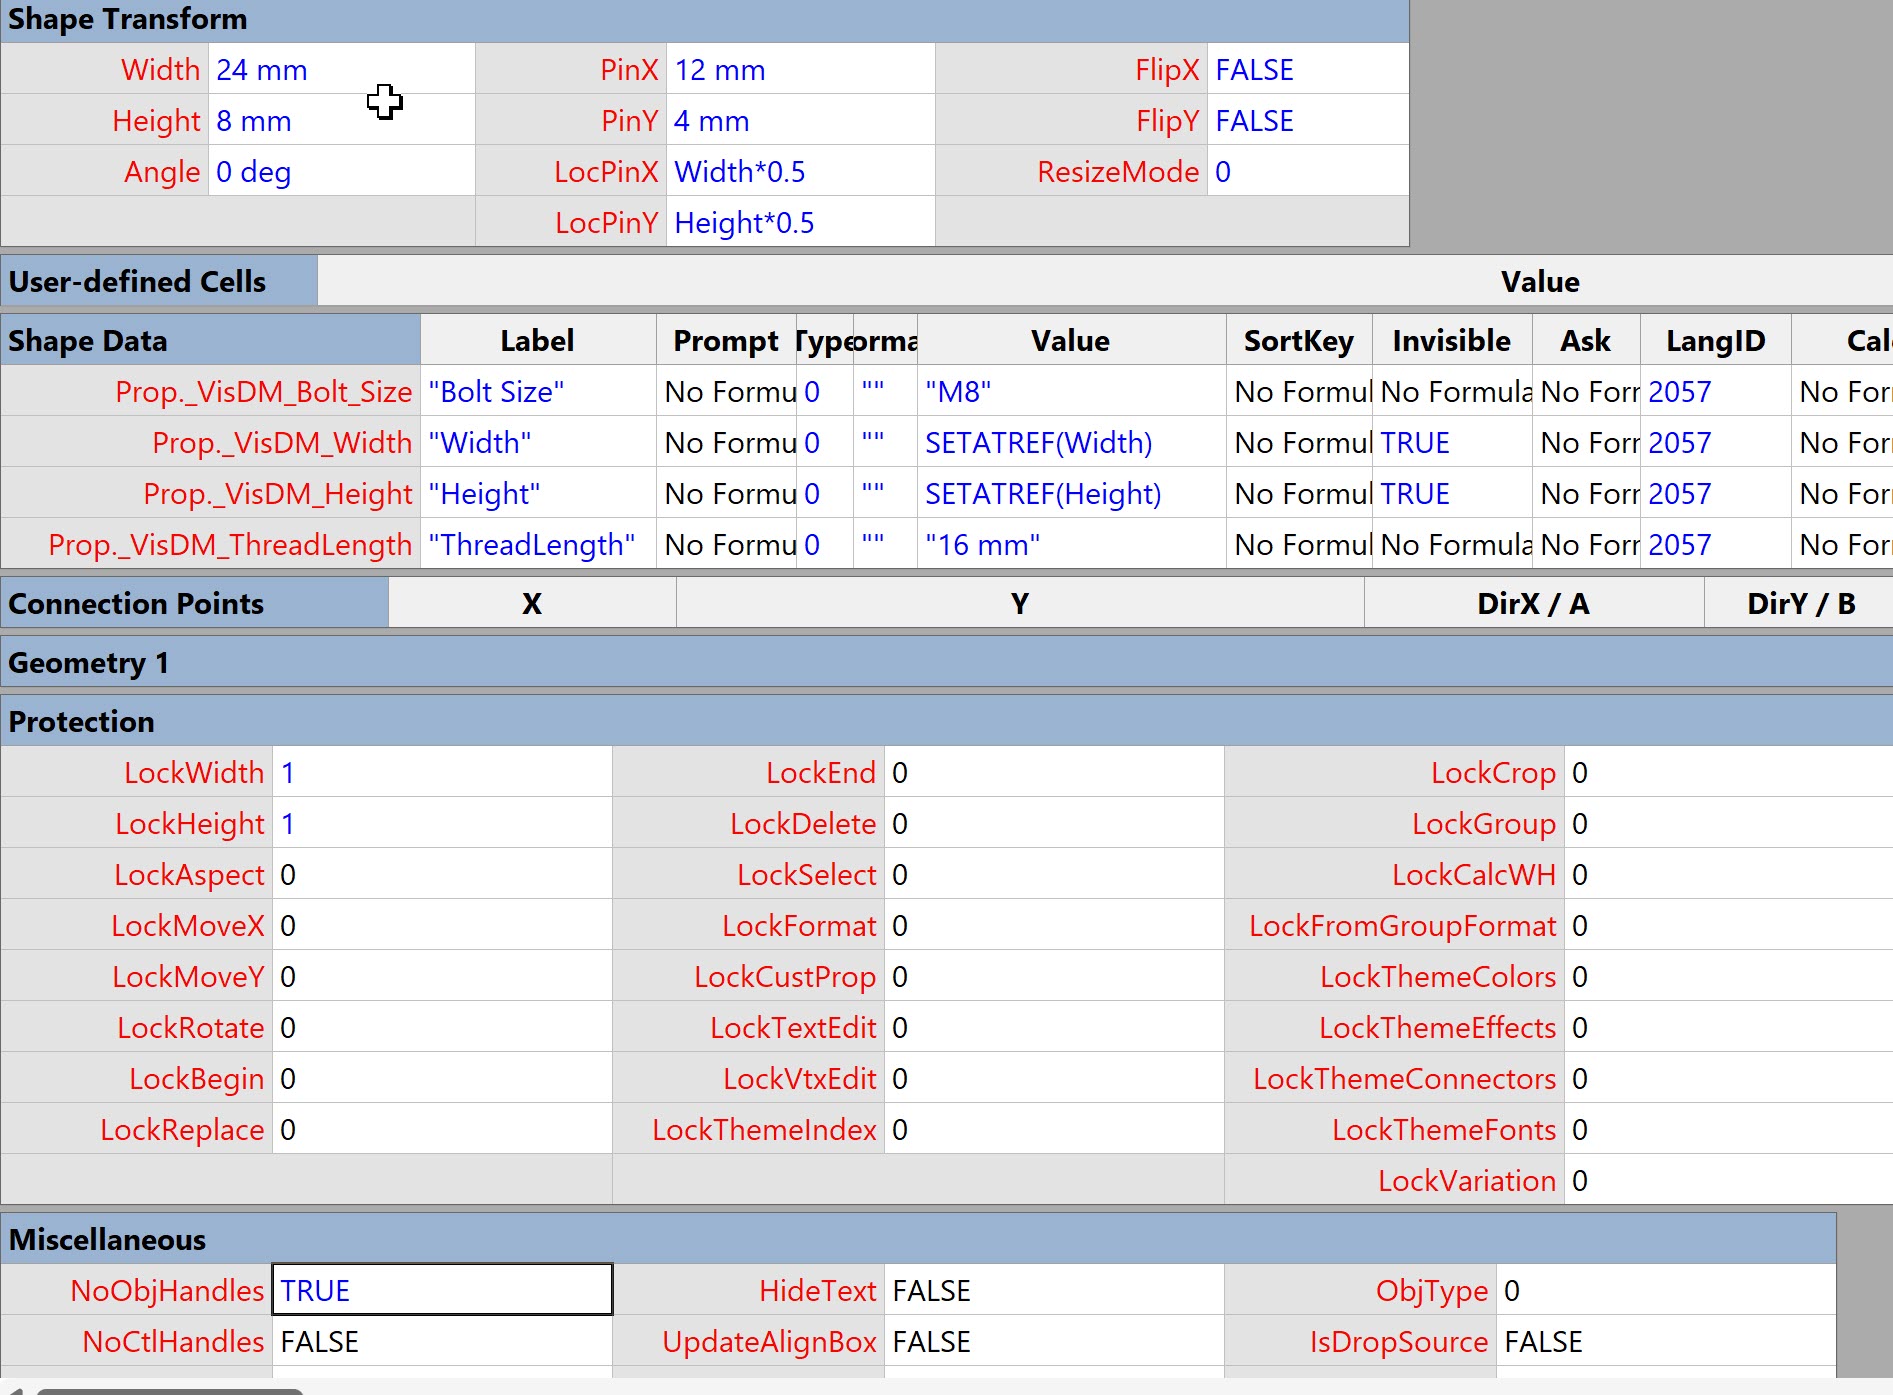

Notice that I also entered =TRUE into the NoObjHandles cell, to make the appearance cleaner.
Of course, Width and Height are not the only cells that can be automatically updated in this way, and the entries can be formulas rather than values.


Migrating from Lucidchart to Visio?
My fellow Visio MVP, Michel Laplane, and I recently converted and transformed 15k Lucidchart documents to Microsoft Visio for a large multi-national organization. This was approximately 4 years after they had moved from Visio to Lucidchart! I do not know the full reason behind these changes in technology, and I do not have a particular…


Creating Boolean Context Menus in Visio
Over the many, many years that I have been creating Microsoft Visio solutions, I have had to create numerous right-mouse context menus for shapes to control their Shape Data values. Over that time, patterns emerge, so this article is highlighting three different appearances for simple Boolean values, otherwise known as True/False or Yes/No values, and…

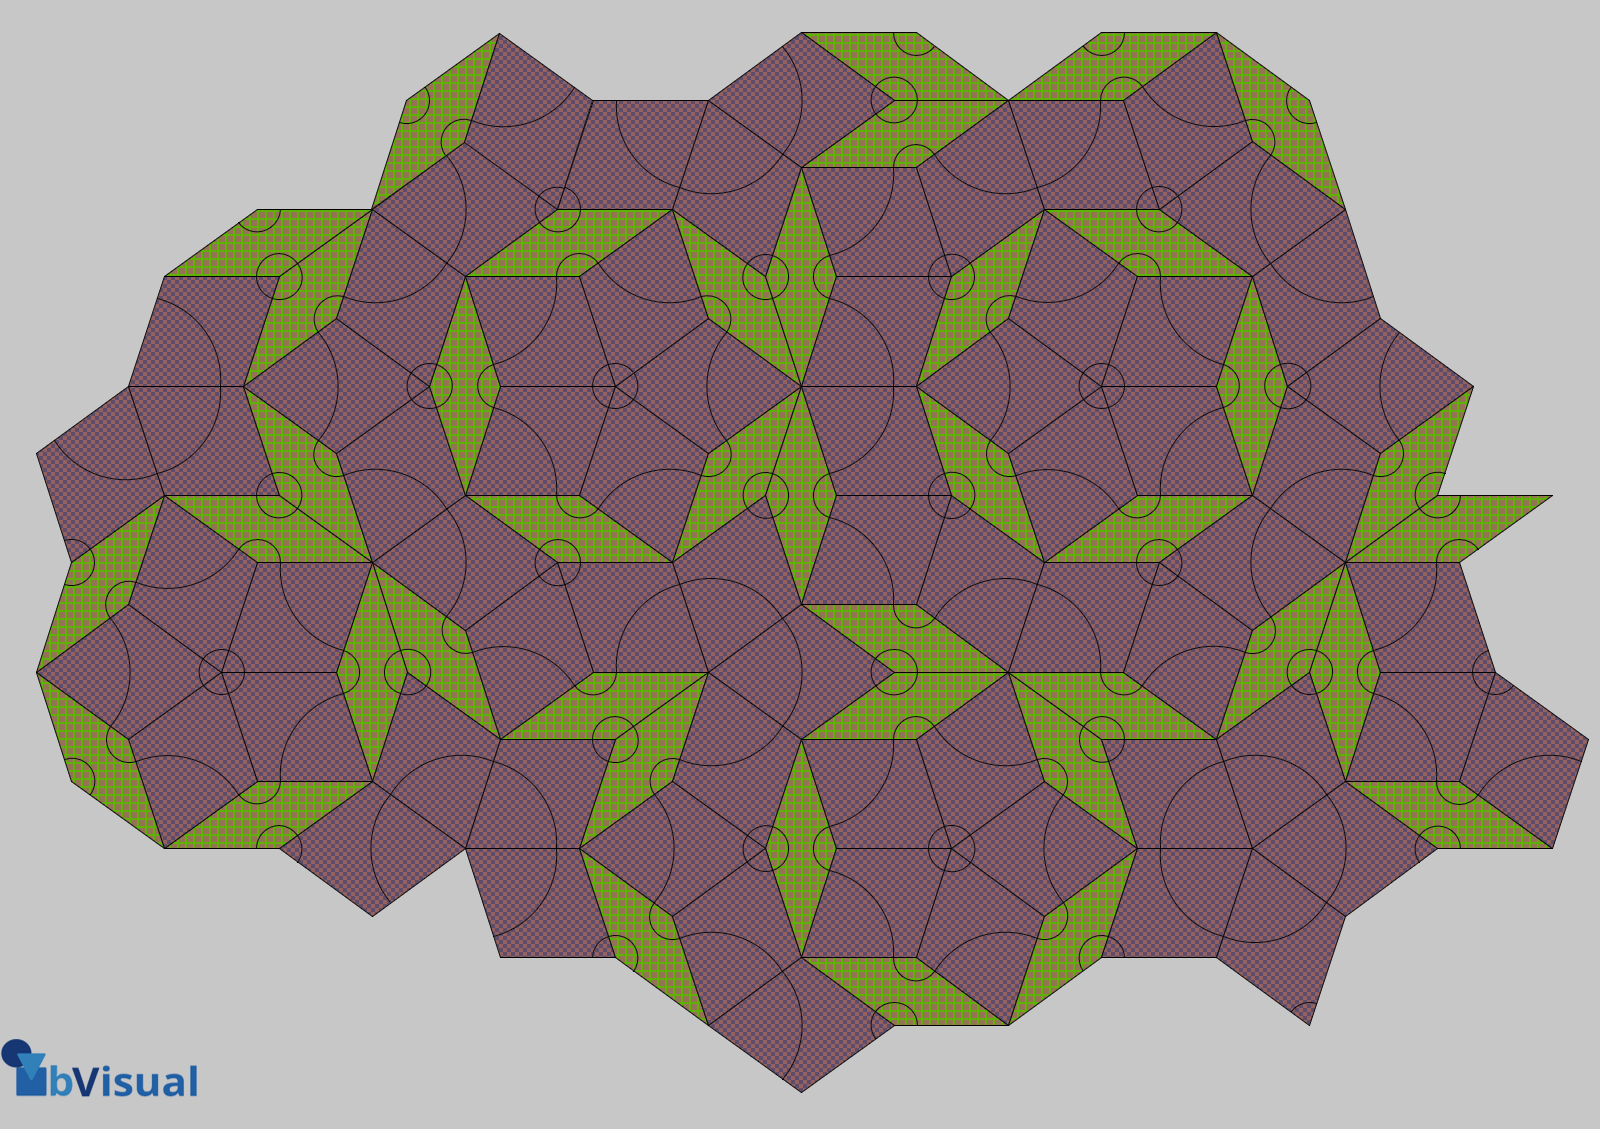
A visual exploration of Penrose Tiling in Visio
Maybe it is because I used to be a building architect, but I have always been fascinated by the relationship between numbers and visualisations. Perhaps the most famous one is the Golden Ratio which has been used as the basis of many building designs and art pieces. It is often recognised to create a harmony…

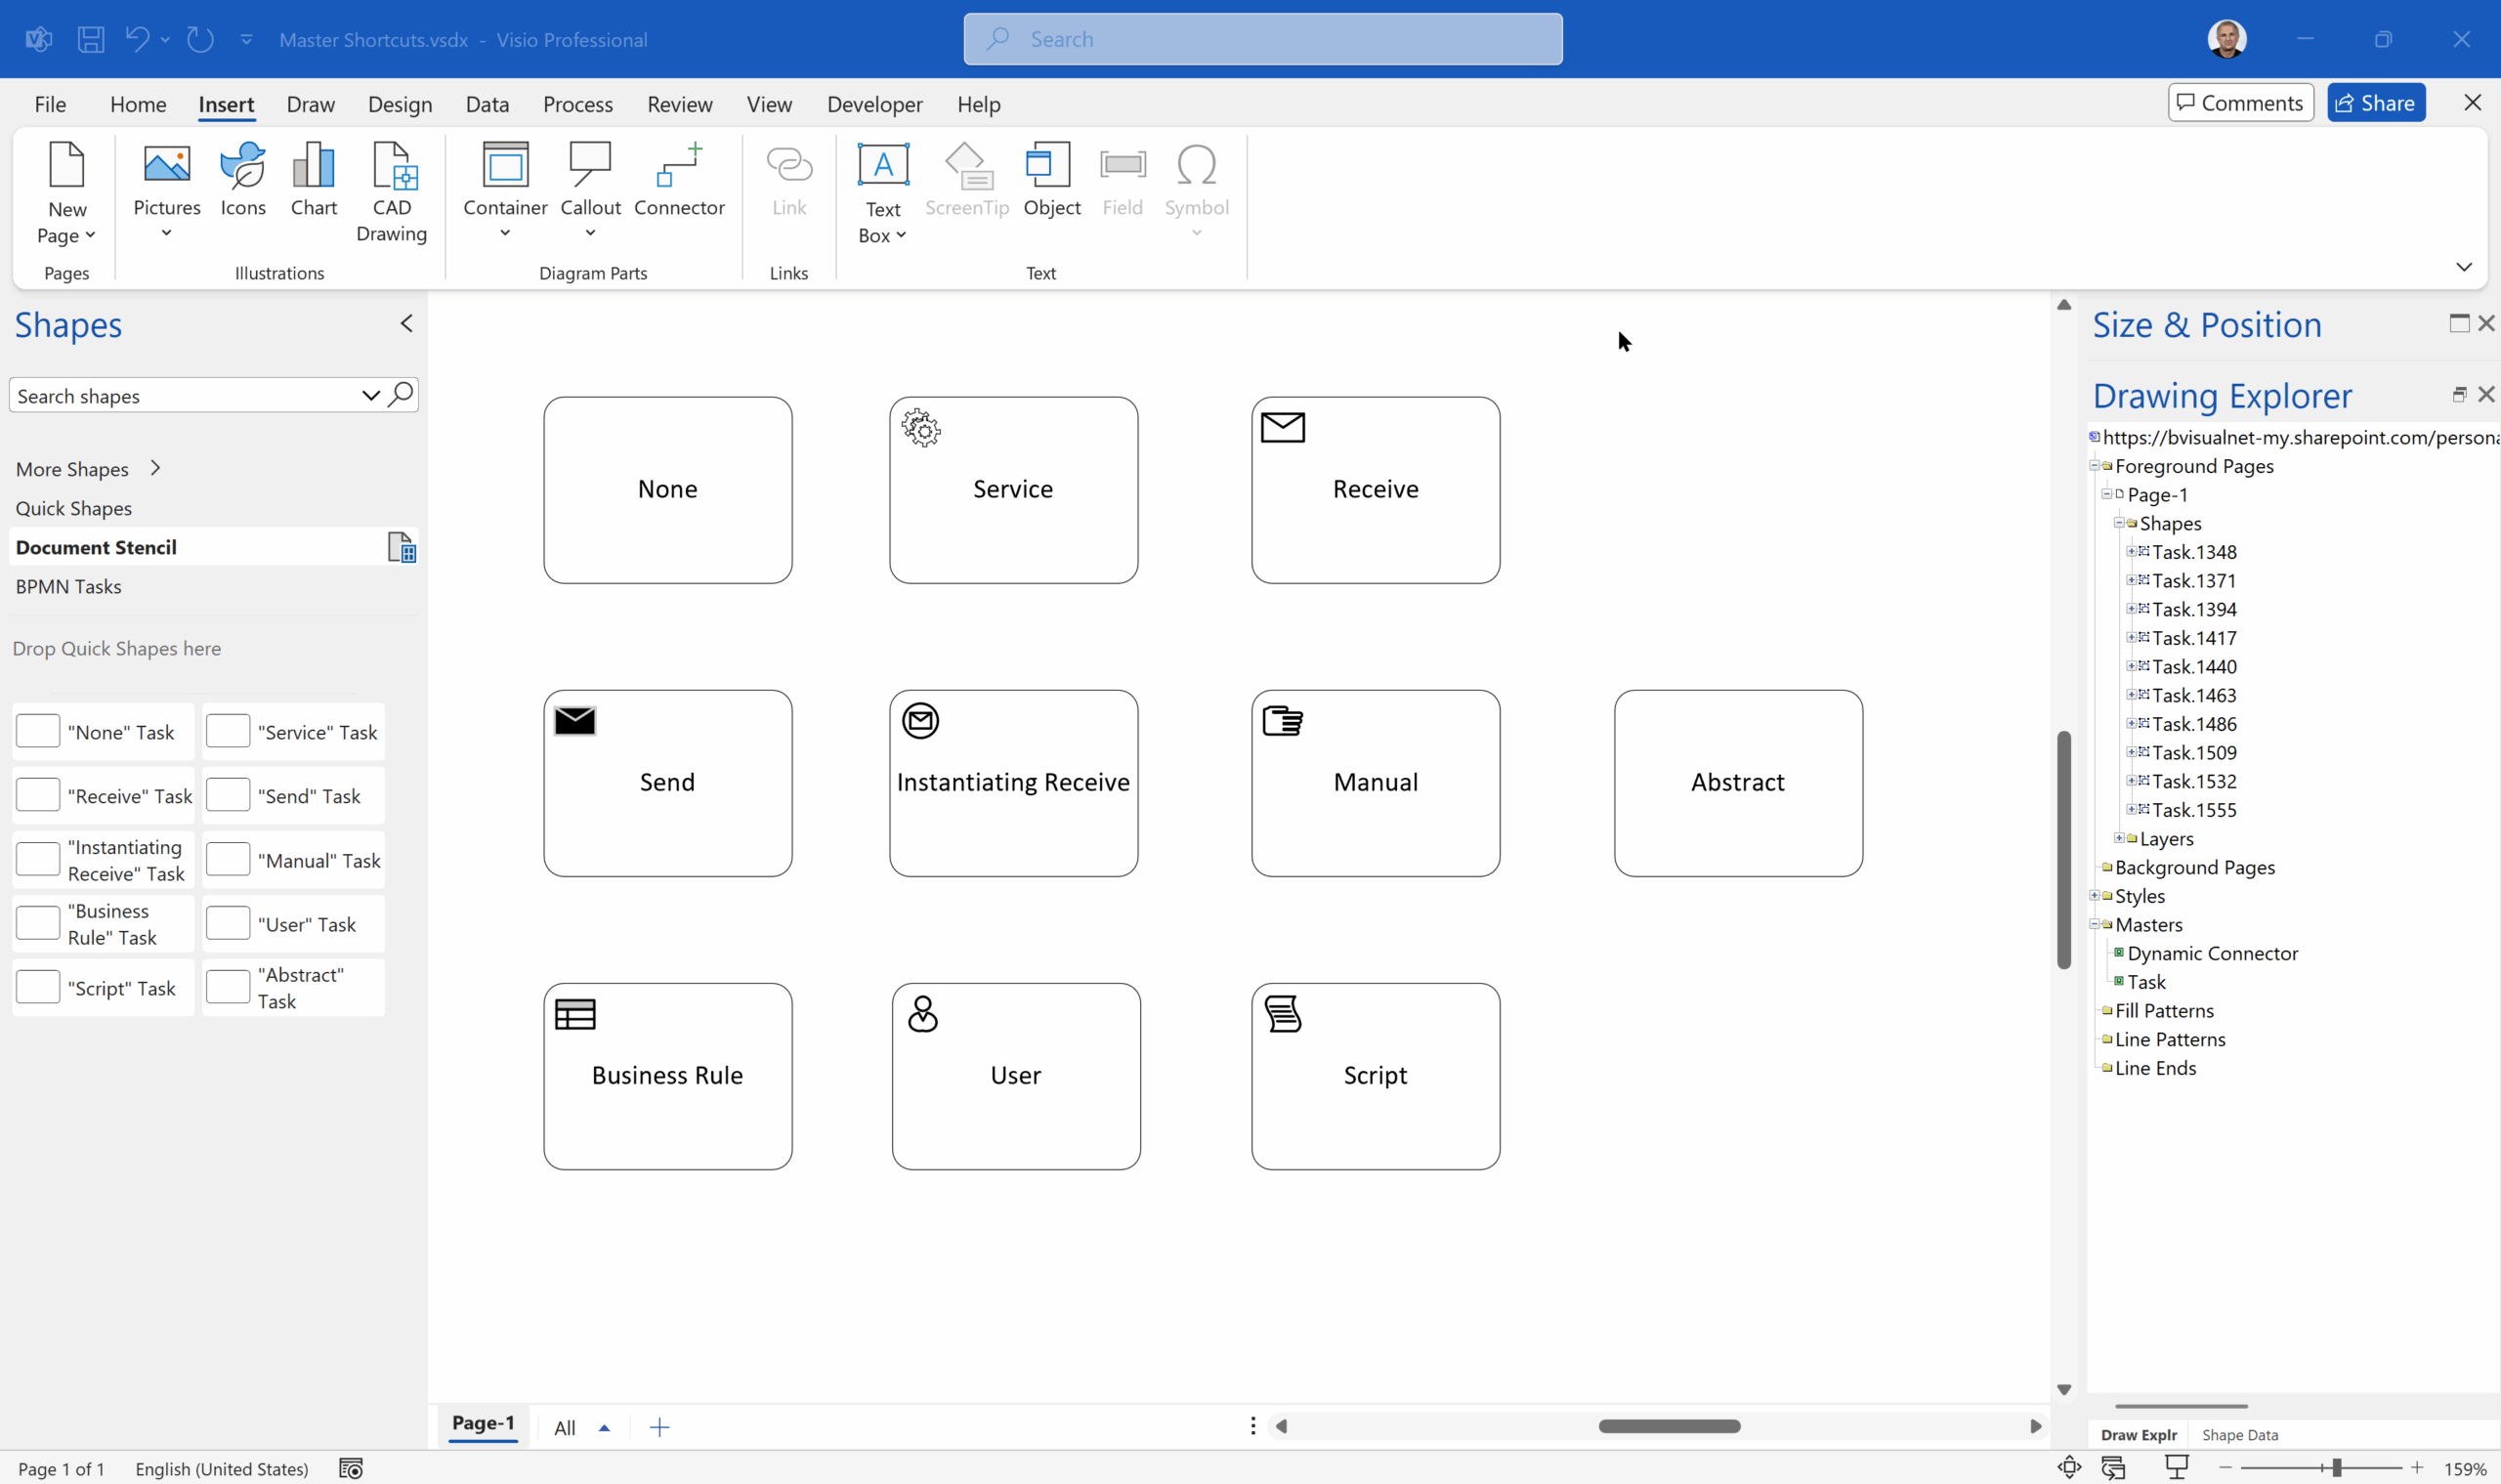
Are Master Shortcuts useful in Visio?
Many Visio users may not even understand the question, but this almost hidden feature has been available for many years. A Master Shortcut looks like a normal Master in a stencil, but it is merely holds a reference to another Master in a Stencil, not necessarily the same one, and has an option to add…

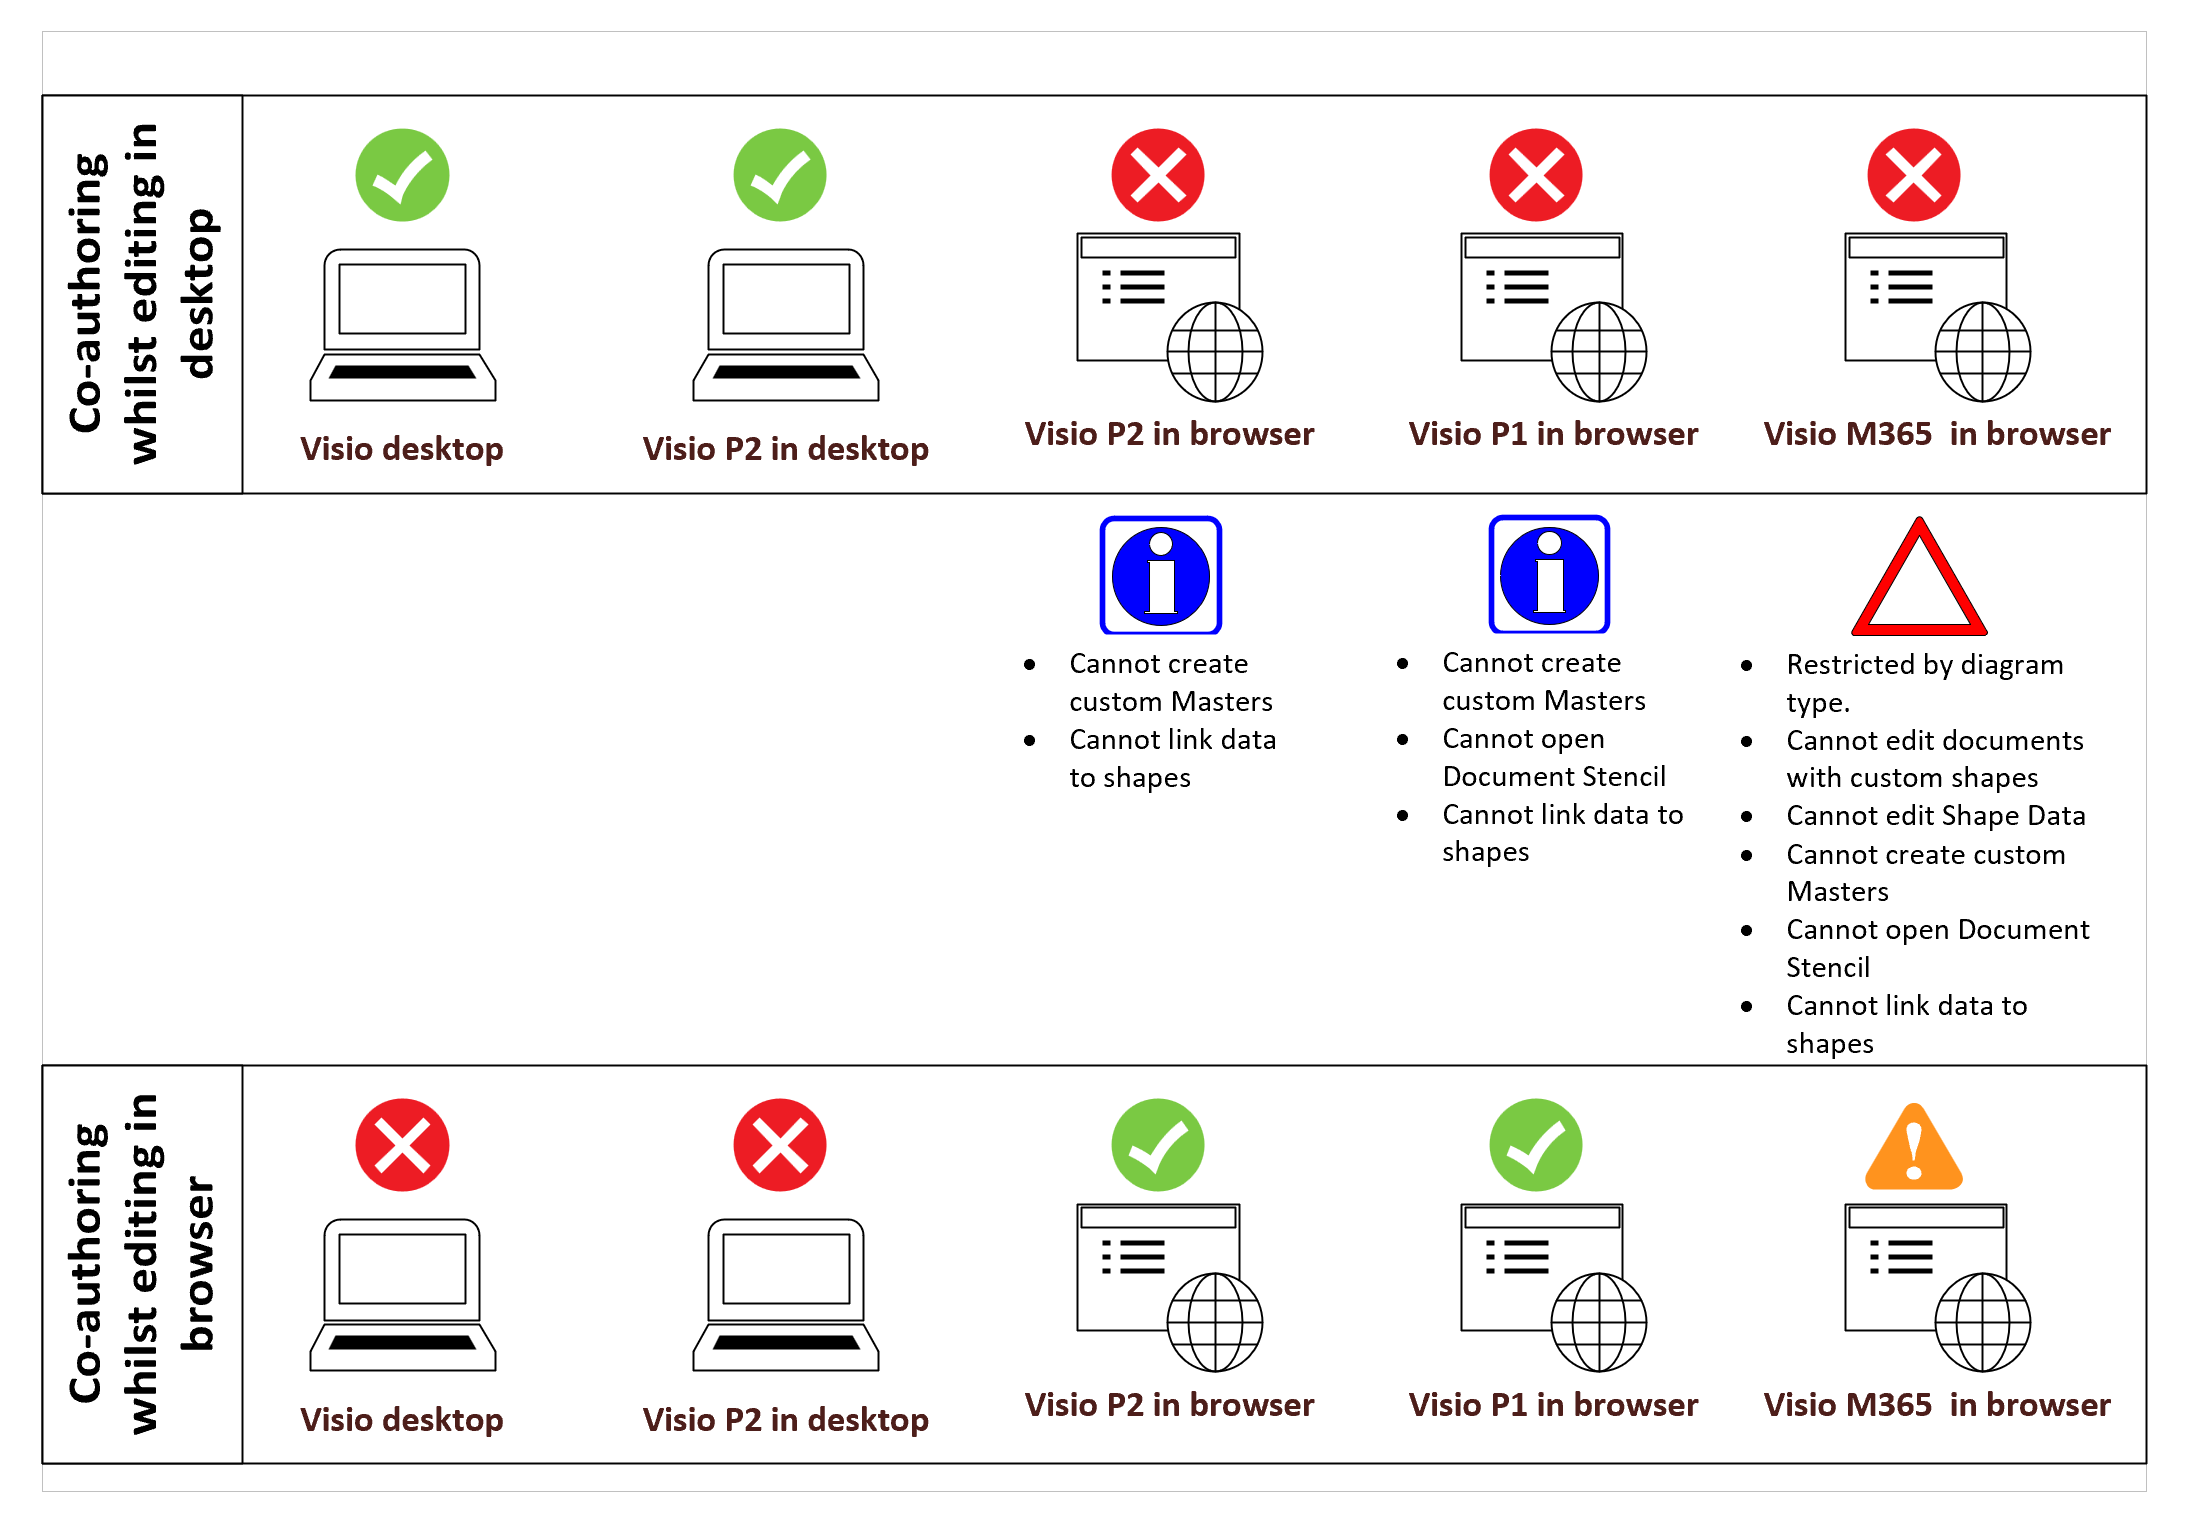
Co-authoring and Commenting with Visio Documents
Microsoft Visio can be used in the web browser and on the desktop, but there are several licensing options available, so which ones can be used concurrently whilst supporting co-authoring and commenting? This article tests the various scenarios but assumes that the Visio documents are stored in OneDrive for Business or SharePoint Online\Teams. The Microsoft…

Fixing dimensions of 2D shapes
I am often asked what makes Visio unique and makes it stand out from the crowd, especially in today’s online world. Well, I think there are many reasons, but one of them is the ability to create scaled drawings with parametric components of specific dimensions. This was crucial for my adoption of Visio back in…