


In my last post, I showed how you can actually have up to six icons in a Visio Data Graphics Icon Set ( see How to have six icons in a Visio Data Graphic Icon Set/ ), and I finished by saying that I would now show how to create new icon sets from existing shapes … automatically. In fact, I will show you how to do it with existing SmartShapes or with images.
I was asked to make KPI icons from six weather images:

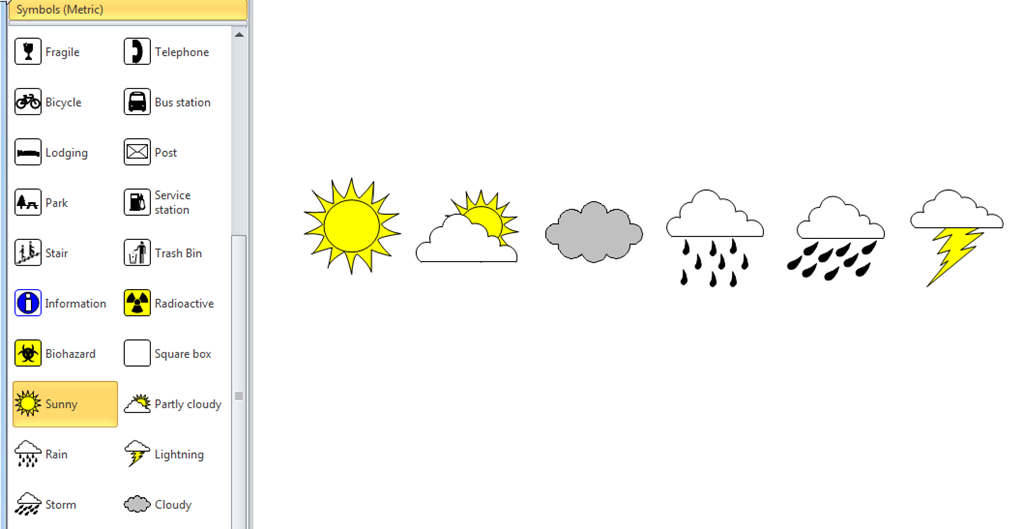
I wasn’t too keen with the graphics, so I explored the built-in Visio stencils, and found a similar series of shapes on the Symbols stencil:
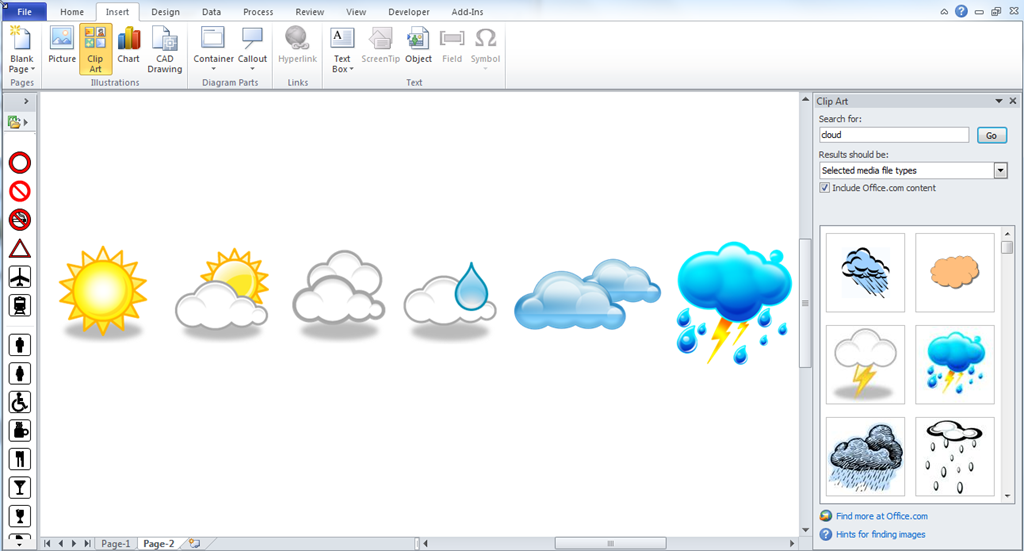
They are okay, but I thought that I would also explore the images available from Clip Art:
So, now I have 3 alternative sets of cloud icons, and I wanted to see how they look as Data Graphic Icon Sets. It can be a bit tedious to manually make icons sets from code, so I thought that some VBA code would be best.
I am not going to go through all of the code in this article, because I have included it as a download at the end of this post.
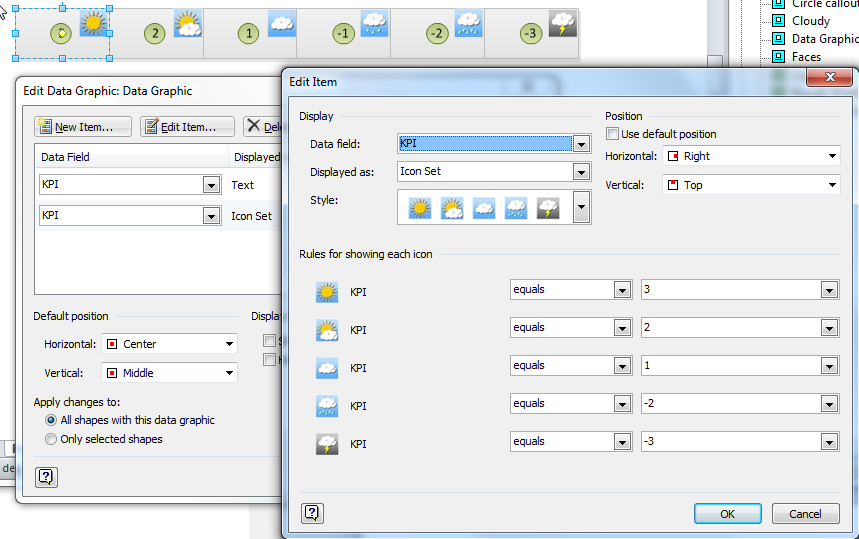
The code is provided in a stencil, called bVisualIconSetMaker.vss, with no master shapes in it, so the easiest way to use it is to drop into your My Shapes folder, because you can then easily open it for any Visio document. There is just one public function, MakeIconSetFromShapes(), that expects you to have 1 to 6 shapes selected in the document that you want to add an icon set to. Read the previous article to see why 6 shapes can be selected, but also realise that the order that you select your 6 shapes dictates the order that they will appear in the icon set, with the sixth selected shape becoming the default icon. Of course, you don’t have to select six.
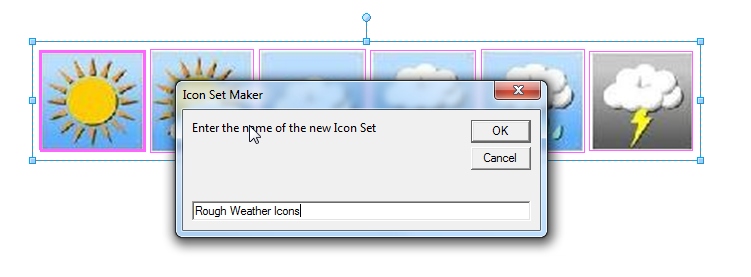
When you have selected your shapes in the order that you want them to appear (I selected the fourth one last in my example), then run the macro in the bVisualIconSetMaker stencil:

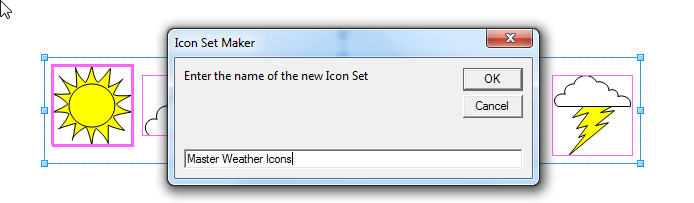
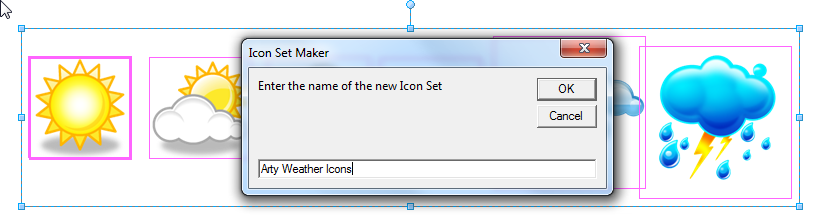
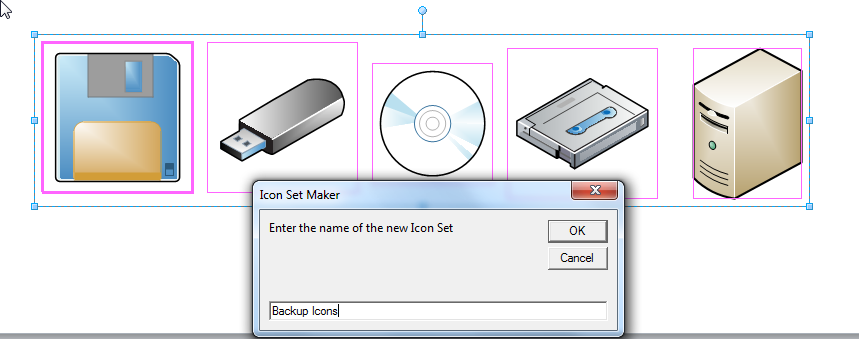
You will then be prompted to enter the desired name for your new icon set:
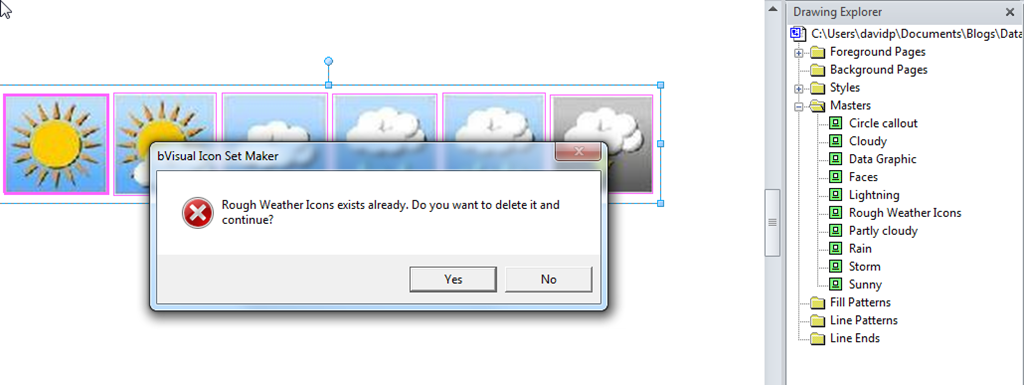
If the icon set name already exists, then you will be prompted to confirm that you want to delete the existing one first:
No that I had a new icon set, I could use it to change the icon set used in my test shapes:
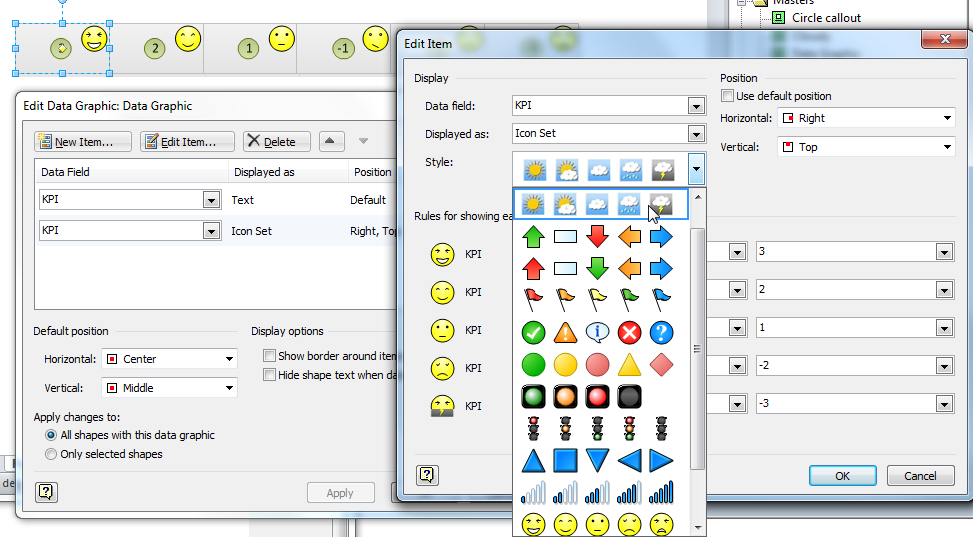
Then I applied the new icon set to my strip of test shapes:
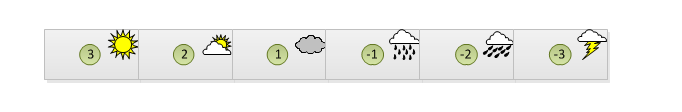
Faithfully reproduced, but too obviously an applied image for my taste…
I then repeated the task with the master shapes that I found in the Symbols stencil:
I then applied them to my test shapes:
Not bad … better than the rough weather icons I had been given.
Finally, I tried it with the arty images that I found using Clip Art:
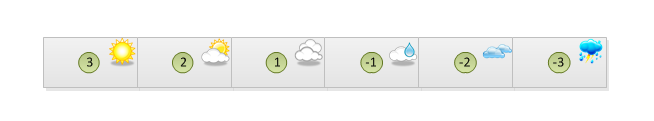
When I applied them to my test shapes, I think I found my favourite:
Of course, the IconSet Maker can be applied to almost any shape. For example, I dragged and dropped 5 shapes from the Workflow Objects Shapes stencil.
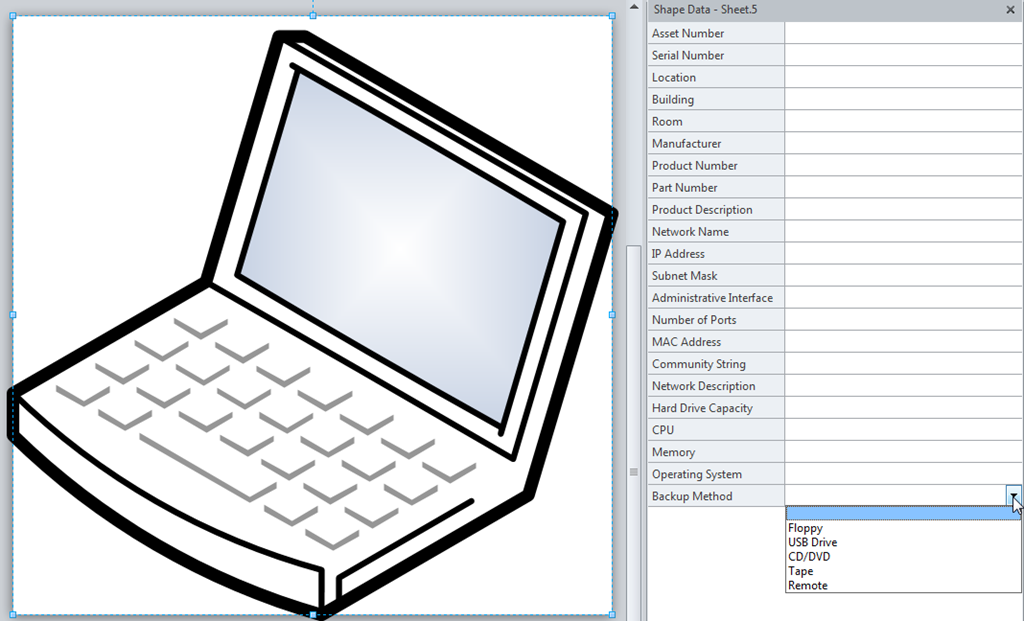
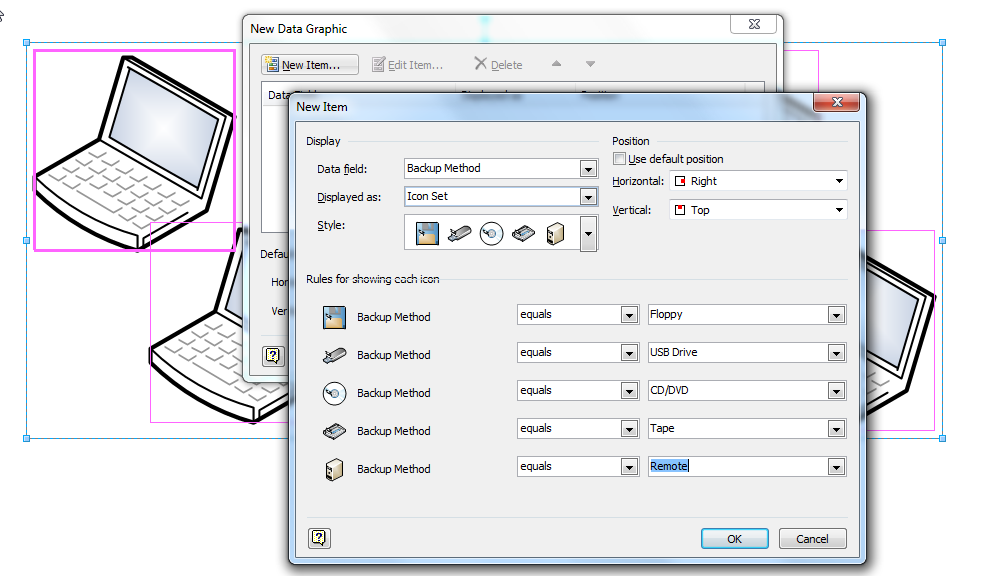
I also added an extra Shape Data row, labelled Backup Method, to the Laptop Computer master shape, and made it a Fixed List type with the following Format formula:
=”;Floppy;USB Drive;CD/DVD;Tape;Remote”
This provides 6 options in the drop-down list because the first one is an empty string:
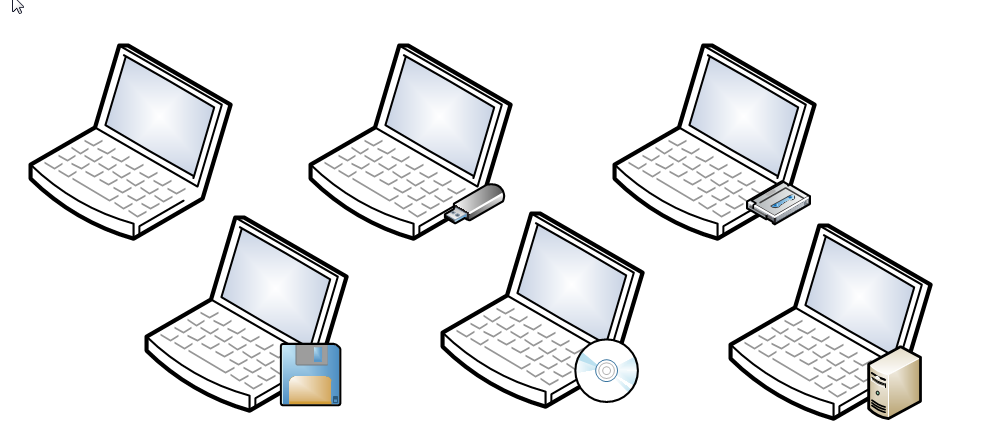
Then I applied the new Backup Icons icon set to some test shapes:
Then it is so simple to see which laptop is using which backup method:
Note : There is a Private Const iconSize statement at the top of the code file in the bVisualIconSetMaker.vss document. The normal values are 6 mm for Metric documents, and 0.25 in for US Unit documents. I changed it to 9 mm for the above Backup example.
This file contains all the code – bVisualIconSetMaker.vss or bVisualIconSetMaker.vssm:
This file contains the samples displayed in this article – MakeIconSets.vsd
Related Articles

Using Visio Color by Value on Connectors
Data Graphics in Visio Plan 2 and Visio Professional is great, but it only enables us to use them with 2D shapes in Visio, i.e. not on connectors. So, what if you want to change the line colour of the connectors between the 2D shapes because of the data flowing between them? Well, it is…

Understanding Visio Data Graphic’s Color by Value
The desktop Visio editions, Visio Professional and Visio Plan 2, have a great way of automatically displaying data as Data Bars, Icon Sets, Text Callouts and Color by Value. The first three types of Data Graphics require sub-shapes to be inserted into each shape that they are applied to, but the last one, Color by…

Linking Data to Visio Shapes in Code
One of the most useful capabilities of Visio Professional and Visio Plan 2 is to link external data to shapes and have them refreshed by changes in the data source. So, many of my solutions involve writing code to make these links, and they are covered with some VBA examples in my book, Mastering Data…

Keeping Visio Data Graphic Items Level
My good friend Scott Helmers, Visio author and trainer, of Harvard Computing Group , recently asked for some help in keeping data graphic items level when their target shape is rotated. Fortunately, I was able to assist, so I thought I would explain how this can be done, and also update my Icon Maker macro…

Duplicating Visio Data Graphics
I was recently asked about switching between different Visio Data Graphics within a page, so I thought I should record a few short videos to explain how Visio Data Graphics work, how they can be edited and duplicated, and how to automate switching between them. (more…)

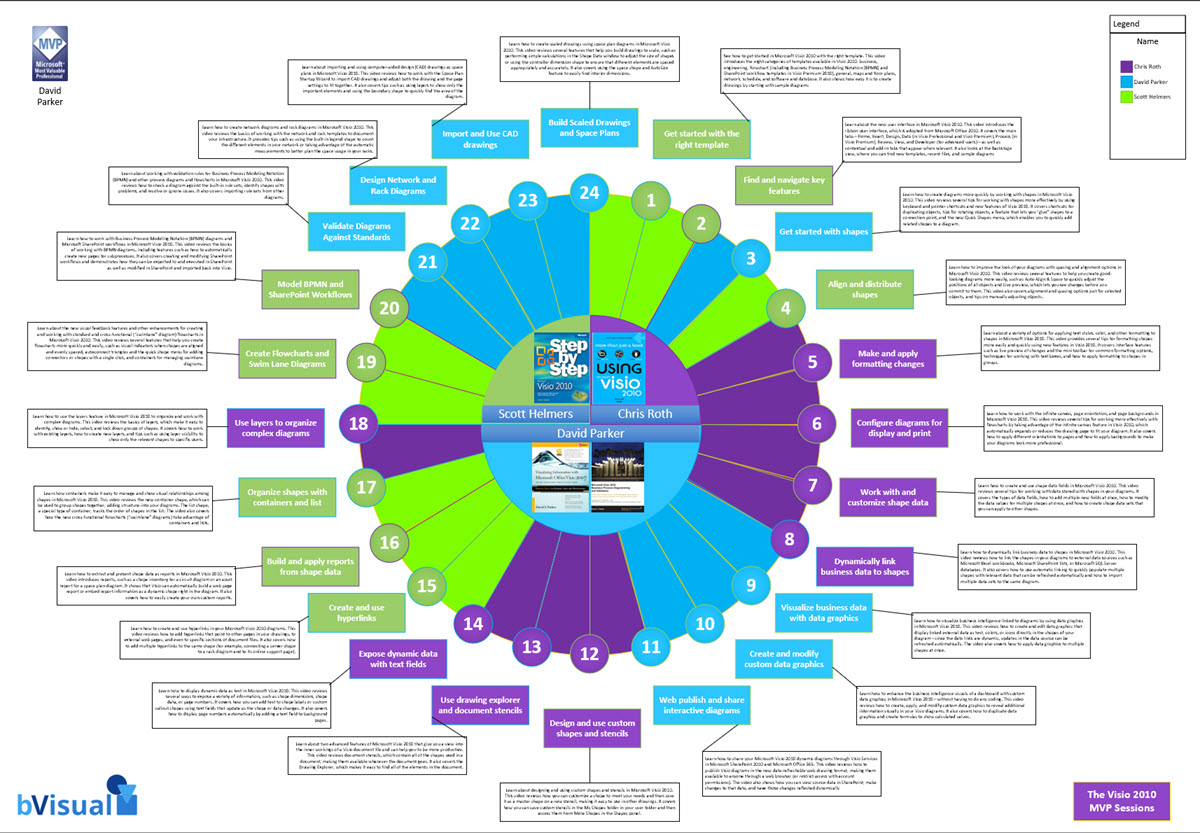
Visio 2010 MVP Session videos reprise
Back in 2012, my fellow Visio MVPs, Scott Helmers and Chris Roth, and I recorded a series of 24 videos about Visio 2010. They were first hosted on Microsoft’s web site, then they put them up on YouTube, they they got deleted :-(. Well, we have managed to retrieve them, and put them back up…