

A few years ago, I wrote an article about displaying the RGB value of shapes ( see http://blog.bvisual.net/2010/04/22/displaying-the-rgb-values-of-shapes ). I had forgotten about it, but a reader recently asked if it was possible to force the Foregnd field to display the RGB value for the standard color palette values. For example, red is number 2 in the palette, and has a value of RGB(255,0,0). In revisiting the article, I realised that there is a smarter way to display the values, without the need of any macros.
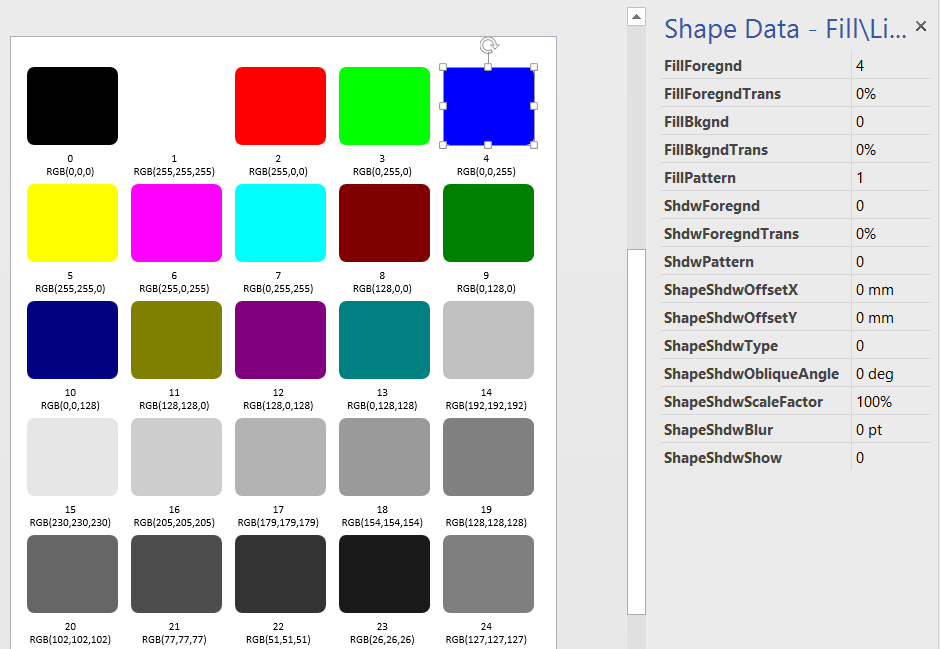
I simply created a master shape that exposes each of the cells in the Fill and Line sections as Shape Data rows. This allows me to enter values in the Shape Data window and see the effect on the shape immediately. So, it was easy to drop one shape, insert text fields, and then use the Array Shapes tool to layout the shapes. Finally, I just entered the the standard color map numbers 0 to 24 in the FillForegnd Shape Data row.
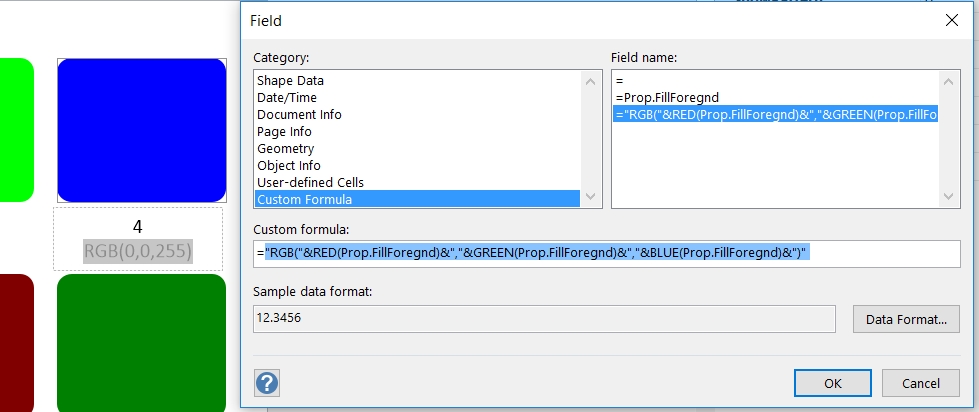
The text block actually contains two rows, both pointing to the Prop.FillForegnd cell (it could actually go direct to the FillForegnd cell instead). The second row of text concatenates a string using the RED(), GREEN() and BLUE() functions.
The ShapeSheet is fairly simple and self explanatory:
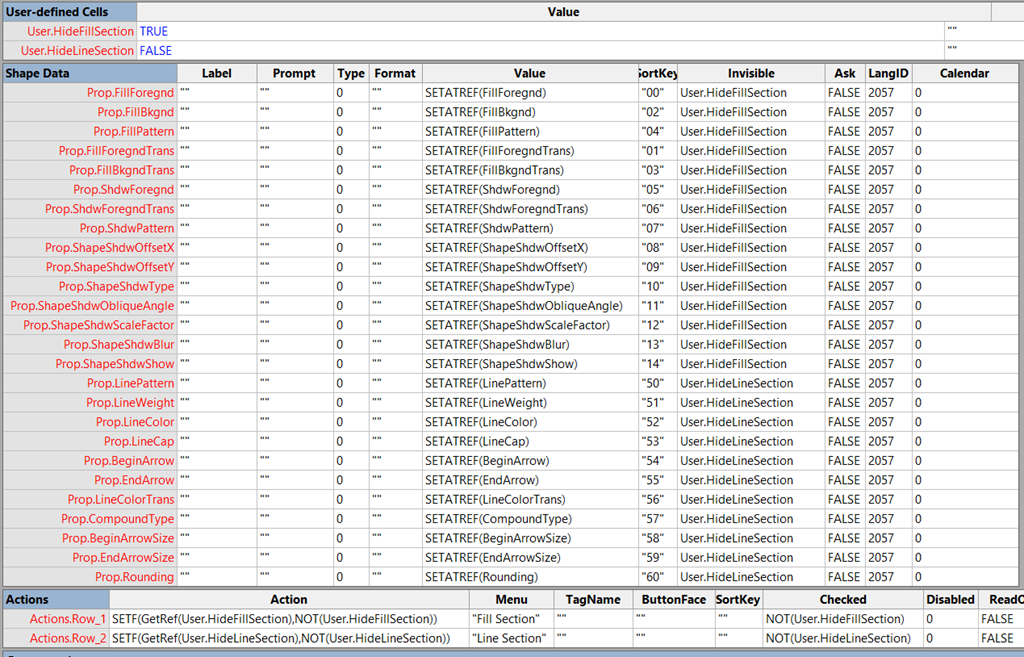
As a nicety, I added right-mouse actions to allow the visibility of the Fill and Line section Shape Data rows to be toggled. Since my original article, the Fill dialog has been replaced with the Format Shape window.

The Visio 2013 Version of the file is available here : https://onedrive.live.com/redir?resid=3350D61BC93733A9!396959&authkey=!AHcw1-IzUXpFuLk&ithint=file%2cvsdx
The (untested) pre-Visio 2013 Version of the file is available here : https://onedrive.live.com/redir?resid=3350D61BC93733A9!396960&authkey=!AL3ll-waz7AXqWw&ithint=file%2cvsd