


I was recently asked to represent the values of Key Performance Indicators (KPIs) in Visio. Great, I thought, this is just what Visio’s Data Graphic Icon Sets are for! Only trouble was, that there were six possible values for the KPI, but all the example Icon Sets have a maximum of five icons in them. So, I had to come up with a way of displaying six icons …
In the following example, I have defined a Shape Data row with a Fixed List type that can have a value from the list “3;2;1;-1;-2;-3”
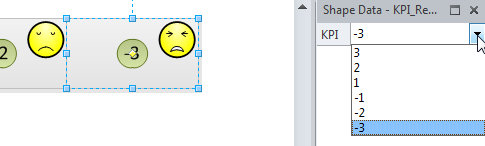
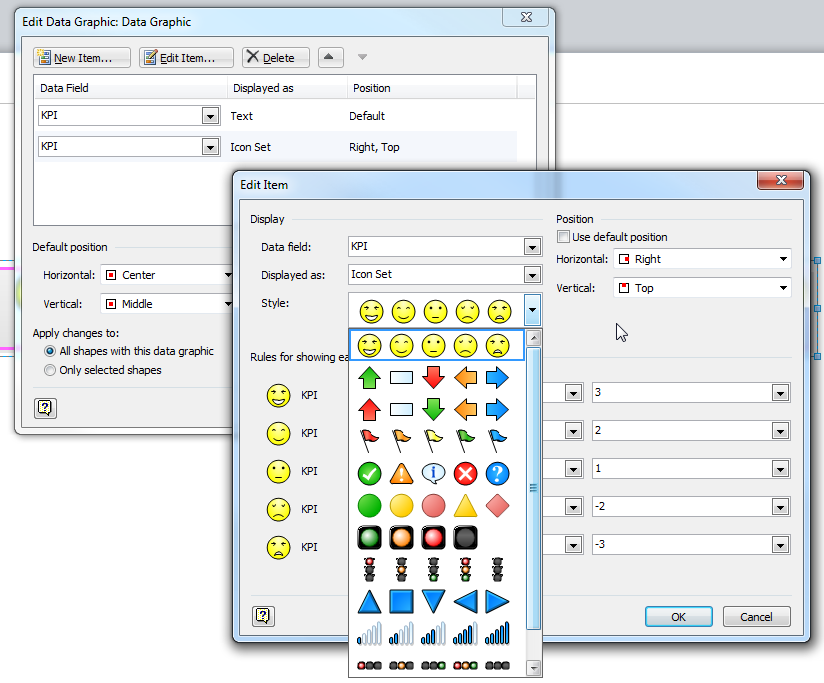
I applied the Faces Icon Set, and set icons for each value, except for –1:
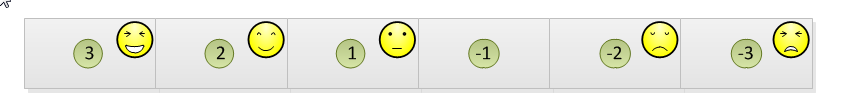
Consequently, when I dropped six shapes, each with one of the possible values, then there is no icon shown for the –1 value:
So, I explored the Faces icon set to see if I could display an icon if the value does not match one of the assigned matched values in the icon set. (Note that the sixth icon will not be for the value –1 specifically, but for any value that is not matched already).
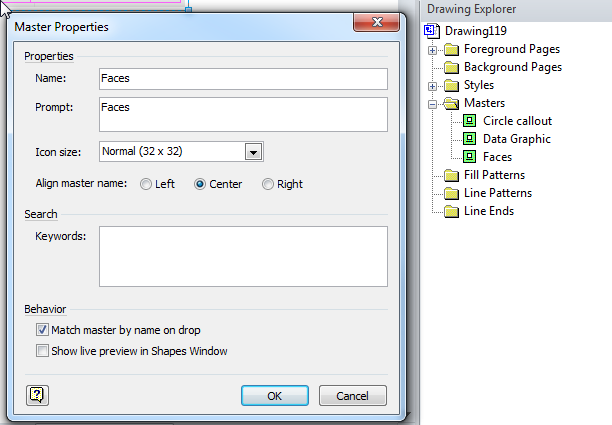
First of all, I opened the Drawing Explorer (from the Developer tab when in Developer Mode), and ticked the Match master by name on drop property. This ensures that Visio will not attempt to use the original Faces icon set master (provided that any changes are not too drastic).:
I then selected Edit Master Shape, and viewed the ShapeSheet of the main group shape, Sheet.5 :
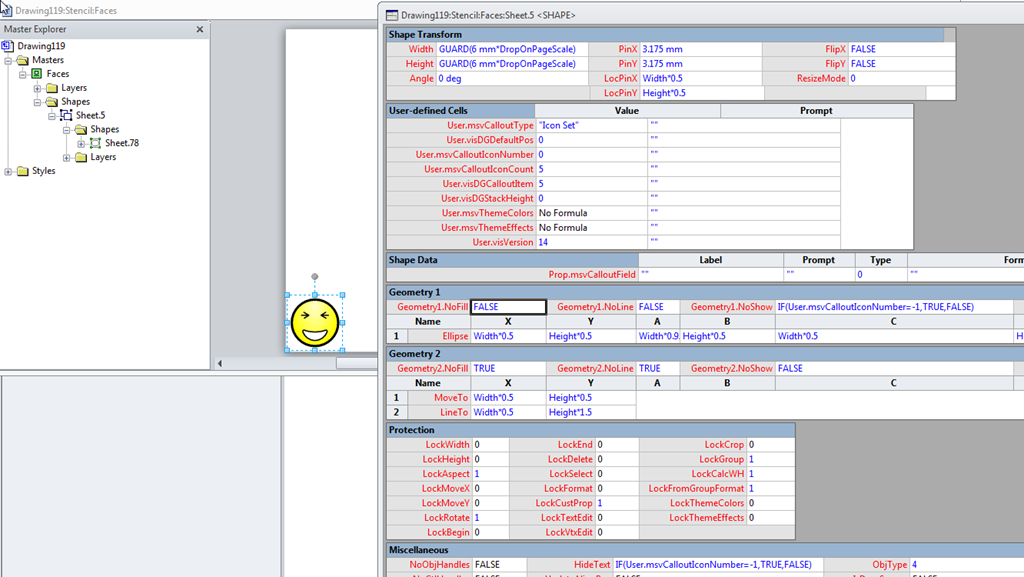
Notice that the Geometry1.NoShow and the HideText cells have the formula
=IF(User.msvCalloutIconNumber=-1,TRUE,FALSE)
I opened the ShapeSheet of the sub-shape, Sheet.78, and noticed that there are many Geometry sections, each of which have their NoShow formula linked to the value 0 to 4 for the User.msvCalloutIconNumber cell, which references the User.msvCalloutIconNumber cell in the parent group shape.
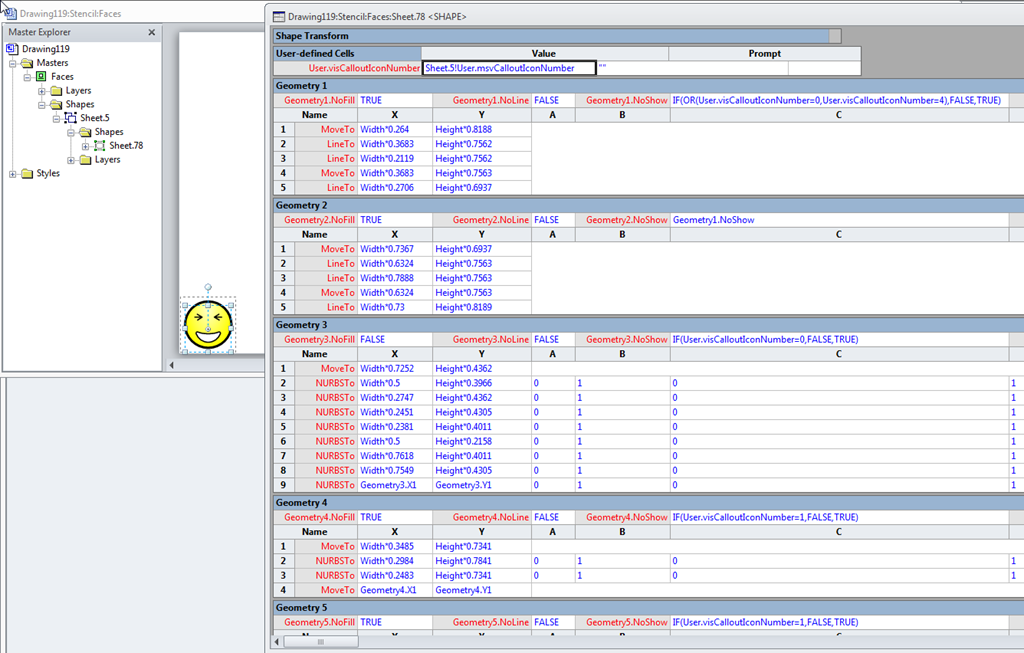
Therefore, all that is needed is to amend the formulas to display geometry if there is no matched value.
So, I manually edited the value of the User.msvCalloutIconNumber in Sheet.5 to –1. This switched off the display of all graphics:

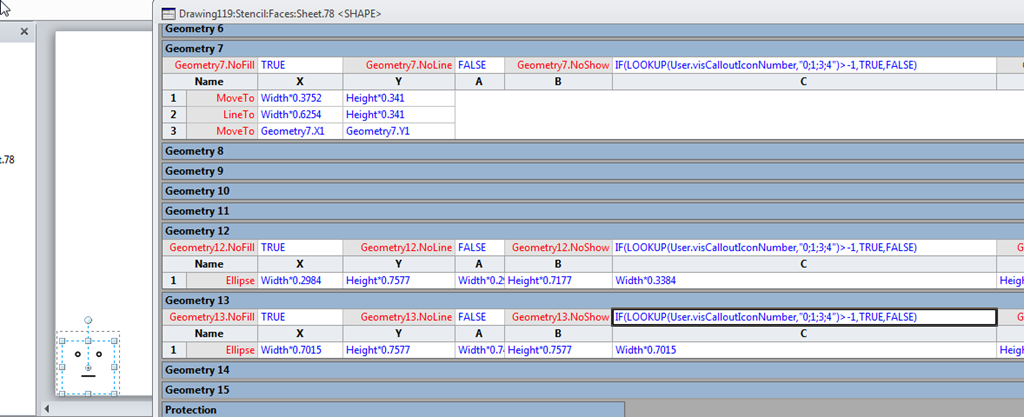
I then changed the formula in the NoShow cell of Geometry sections 7, 12 and 13 from:
=IF(User.visCalloutIconNumber=2,FALSE,TRUE)
to:
=IF(LOOKUP(User.visCalloutIconNumber,”0;1;3;4″)>-1,TRUE,FALSE)
This gave me two eyes and a mouth:
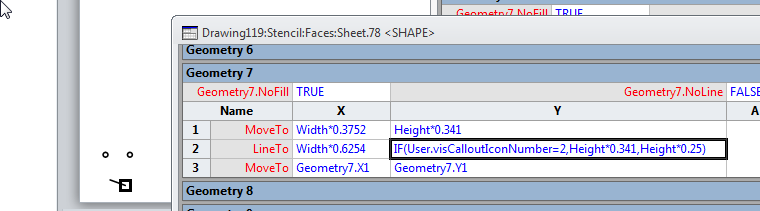
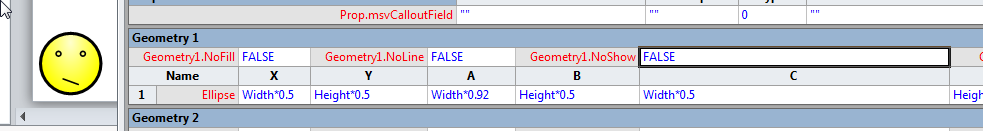
I decided to give the mouth a slant in order to distinguish it from the case when the value = 2. So, I changed the formula for the Geometry7.Y2 from:
=Height*0.341
to:
=IF(User.visCalloutIconNumber=2,Height*0.341,Height*0.25)
All that remains is to edit the Geometry1.NoShow cell formula of Sheet.5 to =FALSE :
Finally, I closed the master shape window to save the icon set.
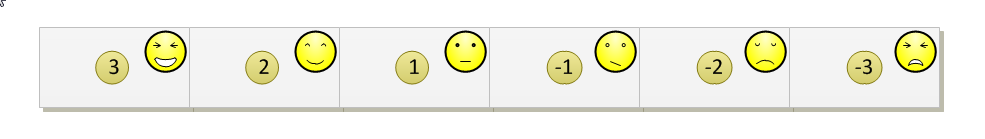
I then refreshed the displayed icon set by selecting another one, applying, then back to the Faces icon set. Now I get an icon for each of the six values in my KPI Shape Data row:
Note that these edited icon sets are in the document stencil. You can download this example from : https://skydrive.live.com/redir.aspx?cid=3350d61bc93733a9&resid=3350D61BC93733A9!2514&parid=3350D61BC93733A9!197
I have shown how you can modify one of the built-in icon sets in Visio 2007/2010, and you can apply the same principle to all of the other built-in icon sets, or you can build your own icon sets.
Make Your Own Data Graphic – Icon Sets at http://blogs.msdn.com/b/visio/archive/2007/07/20/make-your-own-data-graphic-icon-sets.aspx
Create your own Icon-Sets for Data Graphics at http://blogs.msdn.com/b/chhopkin/archive/2009/02/03/create-your-own-icon-sets-for-data-graphics.aspx
Using Data Graphics to Reinforce Information in https://bvisual.net/resources/visualizing-information-with-microsoft-visio/
In the next blog, I will be showing you how to create new icon sets from existing shapes … automatically.