

Microsoft have recently released a preview of the Microsoft Visio Data Visualizer for Excel, and if you have not yet tried it … you should! I am sure that it is far more powerful than one might expect because you can create some very useful Visio diagrams without a Visio license! Sure, you do need a Visio license to edit the diagram, but, if you keep your source table updated, then the diagram will automatically update itself. You can now create, update and share process flow diagrams and organisation charts from Excel and add them to Power BI reports!
Reviewing the original Data Visualizer functionality
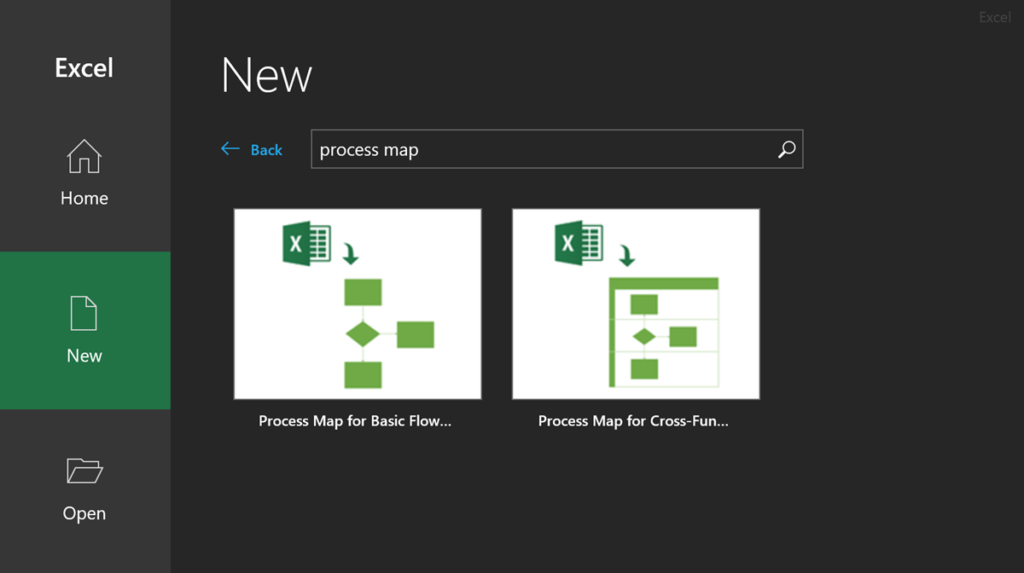
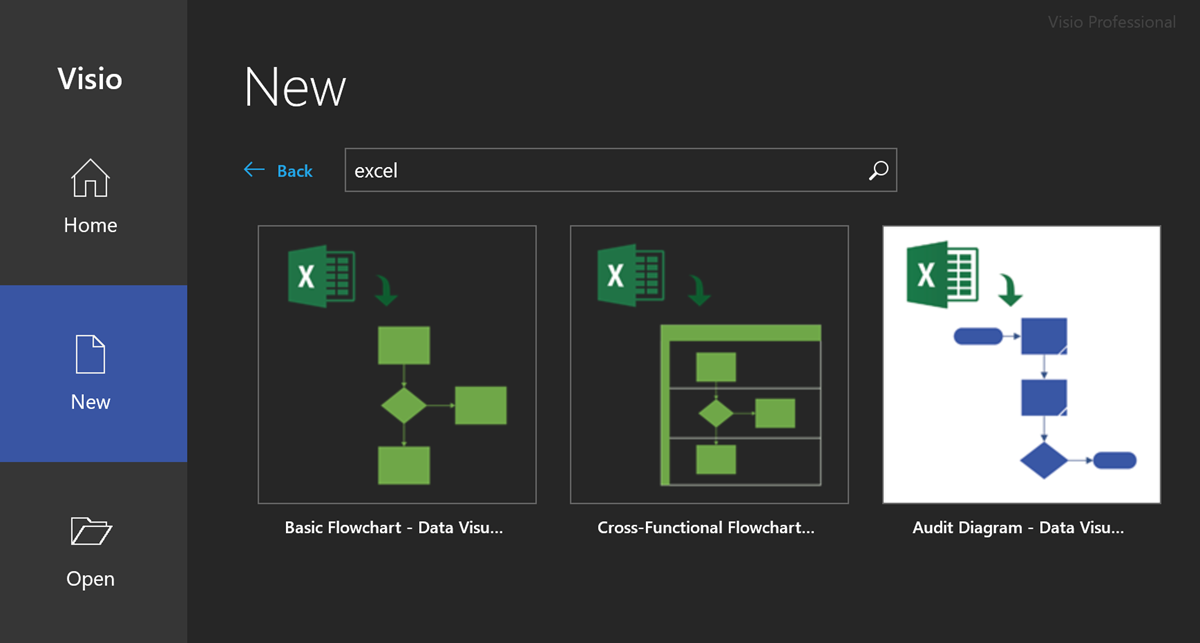
Until now, the integration of Visio and Excel with the two Process Map templates in Excel or three Excel templates in Visio have been limited to basic and cross-functional flow charts. In both cases, it is necessary to have licences for both Excel and Visio to create and maintain the diagrams.


This feature does include two-way updates, so the user can either update the source table in Excel or the target diagram in Visio, and then refresh the other. Although this capability exists, it is not always necessary to have bi-directional updating and refreshing, and indeed I wrote an article a while ago about using a database as a read-only source for Data Visualizer for Visio Pro for Office 365 – Part 2. By the way, Visio Pro for Office 365 was the original name for Visio Plan 2.
The key feature is that flow charts can be easily created from Excel tables with some specific requirements, such as a column with a unique identifier, and a column that specifies the predecessor or successor unique identifiers. There is a column to specify the shape type (master name) to be used, the text to be applied, and, in the case of cross-functional flowcharts, the swimlane or stage to place the shapes in.
The new Visio Data Visualizer add-in
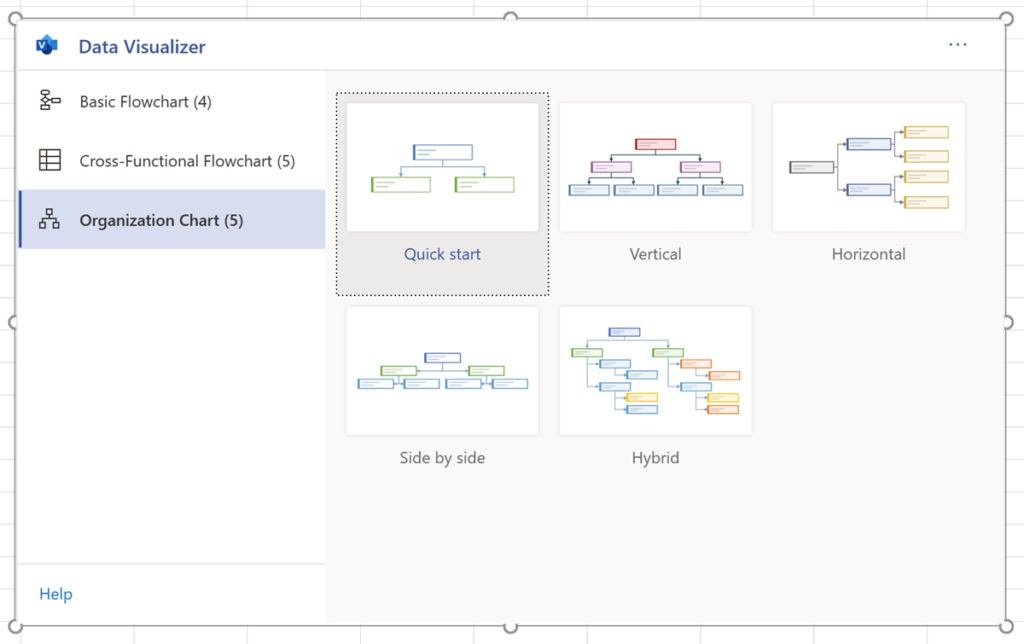
It was always the intention of Microsoft to increase the diagram types beyond flow charts, and so organization charts became the next offering in this new add-in for Excel.
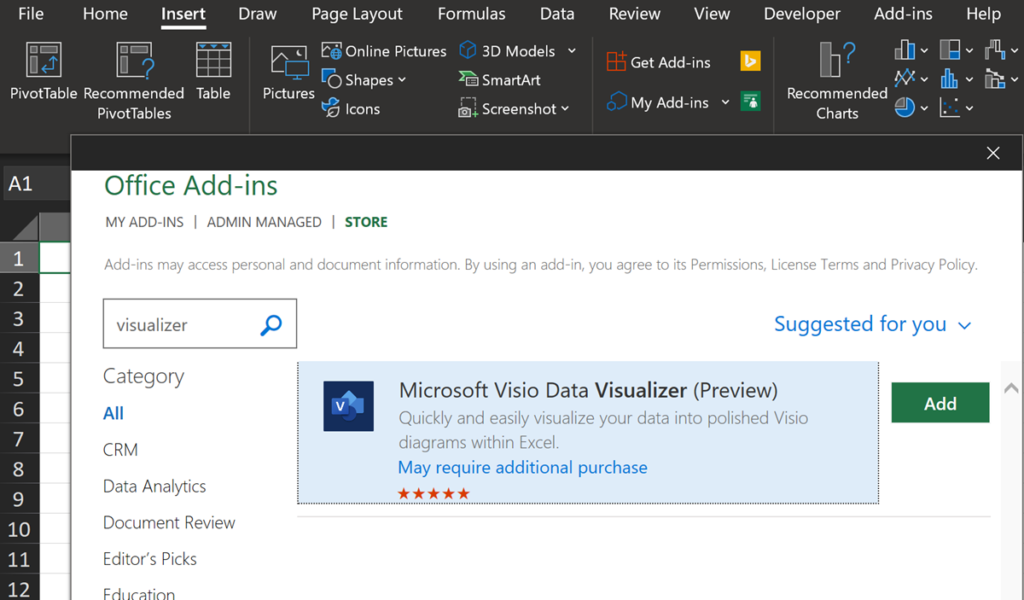
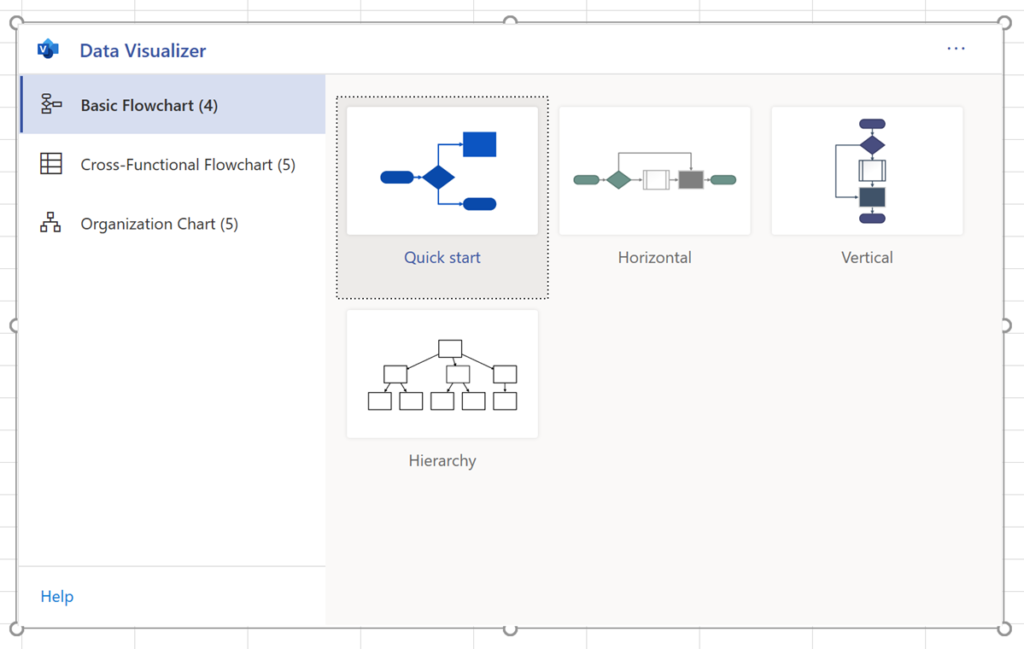
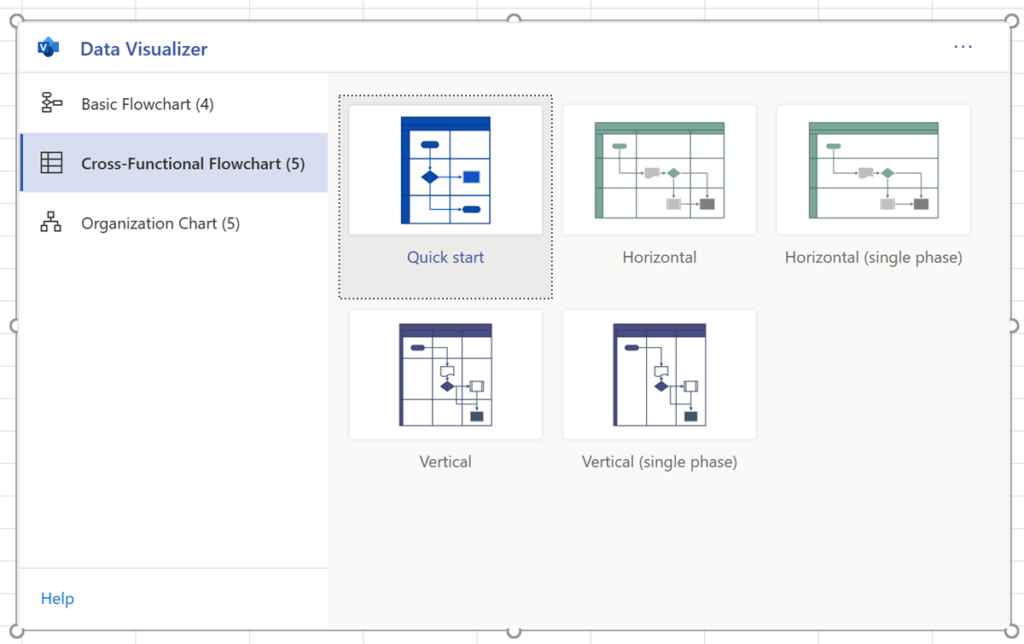
The Visio Data Visualizer includes Basic and Cross-Functional Flowcharts, but has added Organization Charts to the list! Simply go to the Microsoft store with the Insert / Add-Ins / Get Add-Ins button, and enter Visualizer as a search string. Then Add the Microsoft Visio Data Visualizer add-in to your Excel environment, trusting it if prompted. You can use the add-in on any blank worksheet tab, but it is advised to first save the Excel workbook to a OneDrive for Business or a SharePoint Online folder before using it because the add-in will automatically save the new Visio document there. You will be prompted with three types of Visio diagrams to create.


- Learn more about using the add-in : Create a diagram in Excel with the Visio Data Visualizer add-in
- Learn more about the add-in capabilities : About the Data Visualizer add-in for Excel
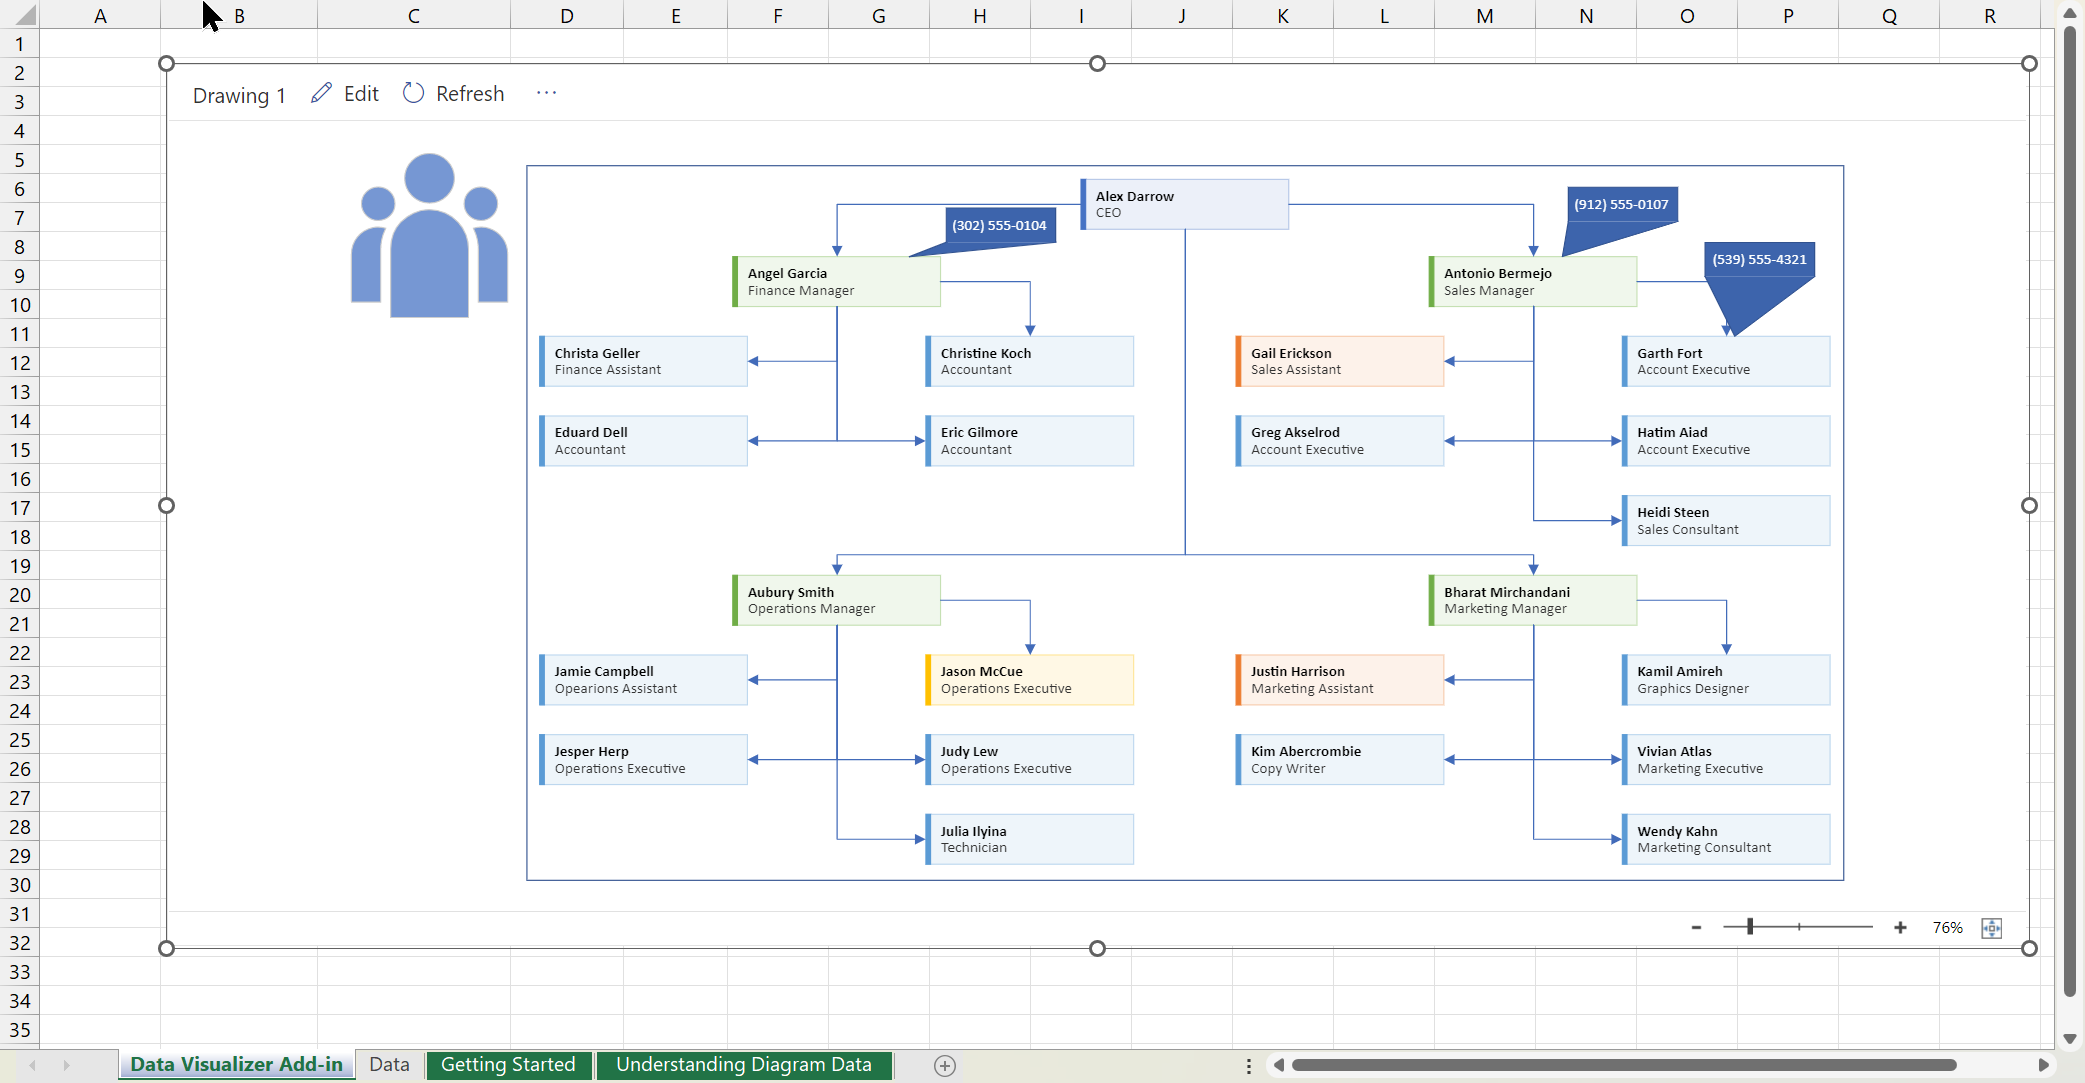
Creating an Organization Chart
Microsoft Visio has had an organizational chart feature for over 20 years, and is used by many companies, and it has a few issues, including not being able to update any hierarchy changes without having to completely re-draw. This new Visio Data Visualizer add-in for Excel, however, can automatically change the structure of the diagram to match the data. This applies to all of the diagram types, not just Org Charts. When a diagram type is selected, a Visio control is added to the Excel worksheet along with a sample source table that is used to generate the diagram.

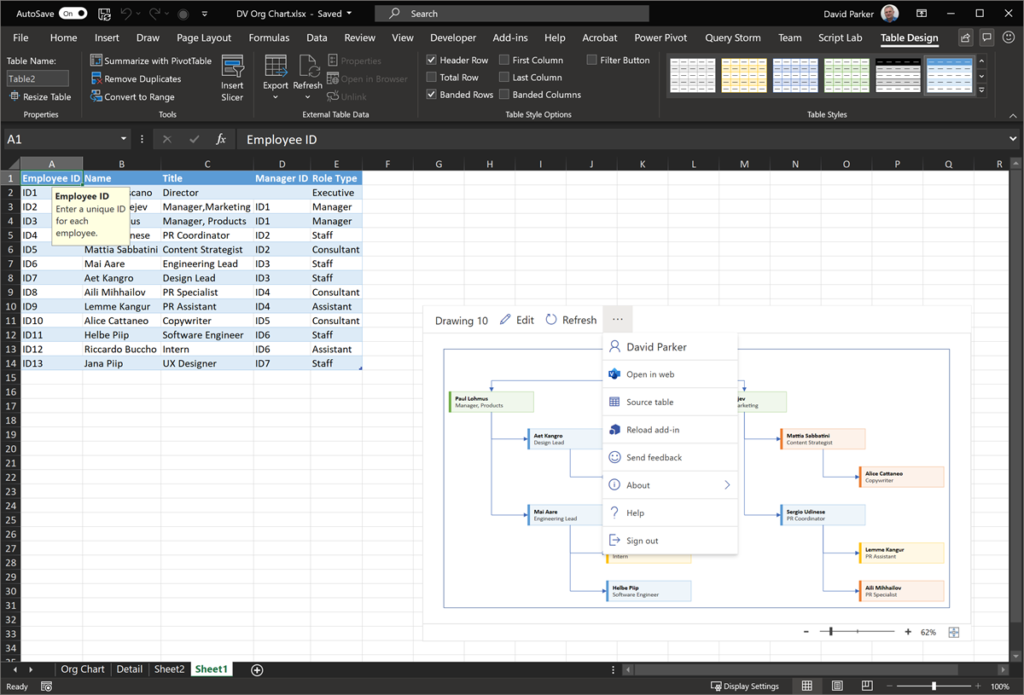
There are five required columns for an Organization Chart:
- Employee ID Must be unique
- Name The name is displayed as the first line of text, in a bold font.
- Title The title is displayed as the second line of text
- Manager ID The ID of the manager, which must exist in the Employee ID column
- Role Type The role type is used to colour the shapes by value
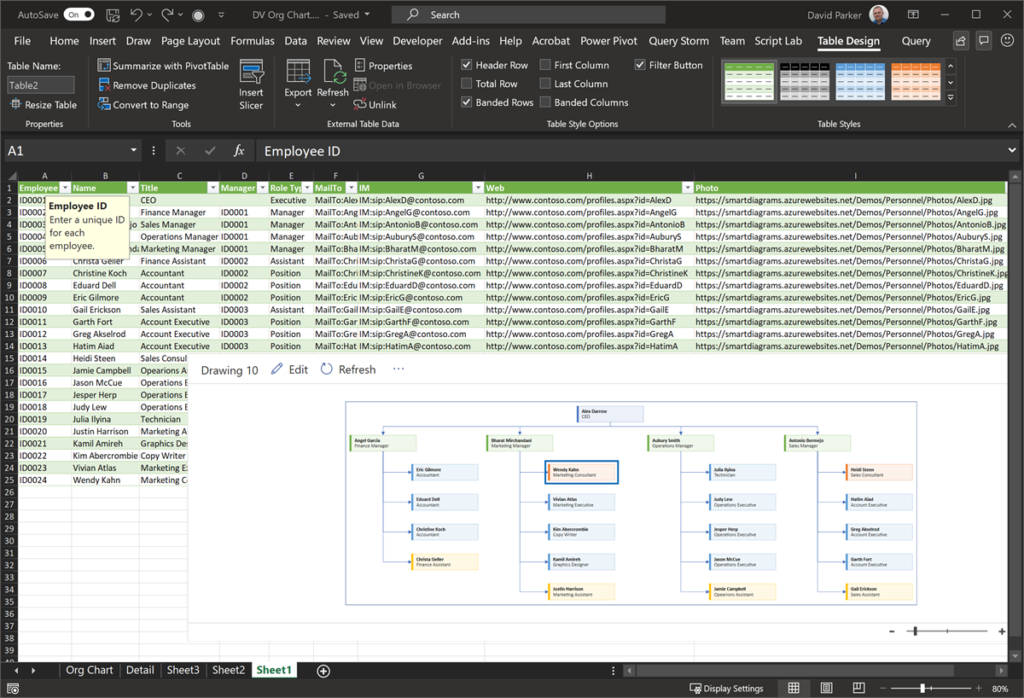
You can add extra columns to the table, and they will be added as data rows to each shape, but they will not be displayed on the shapes, unless the Visio document is edited in Visio for Desktop or opened with the Visio for Web in reading view.
The Visio control displays the Visio file name, an Edit button, a Refresh button, and a Show more commands (…) button.
Replacing the sample data with your own
The Source table option selects the current source of the data, which can then be manipulated, if desired. For example, the above organization chart is based on the Table2 table. This can, of course, be edited be adding extra columns or rows. It can also be replaced with a PowerQuery that comes from another data source, and, if the name, eg Table2, is re-applied before the Refresh command is pressed, then the Visio diagram will be updated with the new data.

If you do have a Visio Plan 2 license, then you can edit the Visio document in Visio for Desktop to update the masters of the shapes to provide more text and hyperlinks, for example.
I have always thought that using Excel as a data source for Data Visualizer to be a tremendous feature because it allows the Visio developers to spend more time on visualising the data better. In addition, the PowerQuery skills are directly transferable to Power BI. Just one look at the number of data sources available, in Data / Get Data, to generate Visio diagrams from is staggering. These would be read-only diagrams, but if they are automatically updated, then their usefulness is boundless.
- Learn more about PowerQuery : Getting Started with Get & Transform in Excel
Sharing the Visio Diagram with others
One of the Show more commands is to Open in web, which will open a new browser window with the Visio document in reading view. This does have the advantage that any data, and hyperlinks, on a shape can be viewed in the Shape Info window.

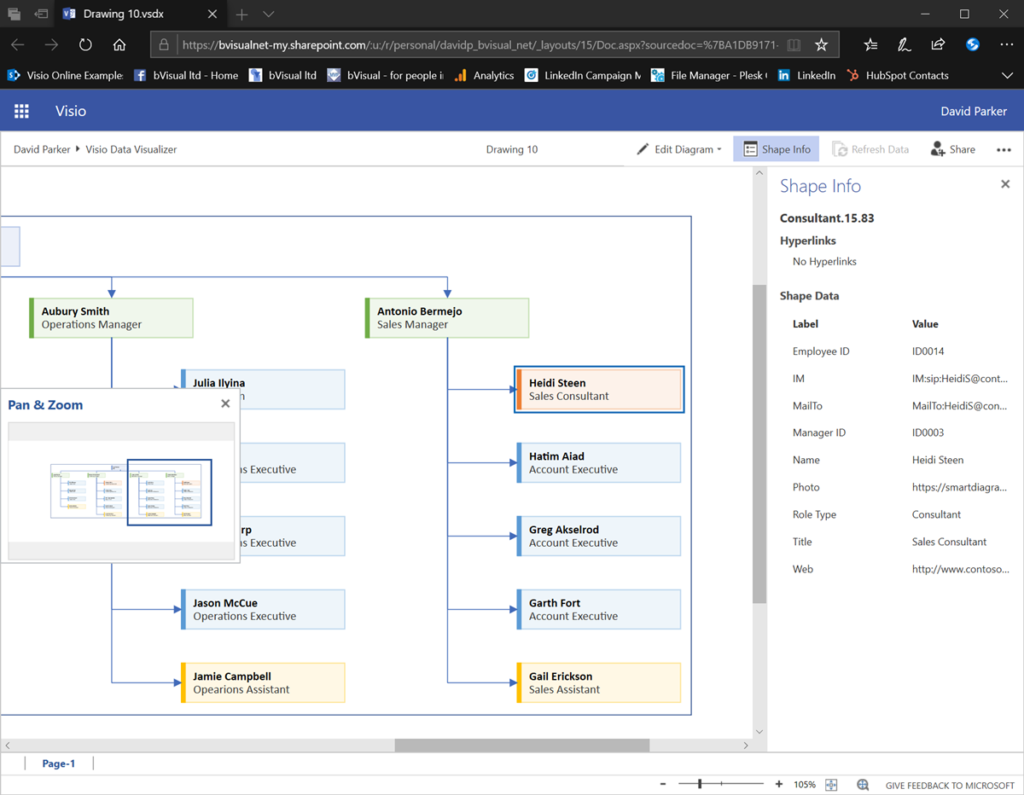
There are multiple options in this Show more commands (…) button in the top right corner. One of these options is to view and edit Comments, but notice the many other options that may be available, depending upon permissions, such as Find, Print, Download, Download as PDF and Embed.
- Learn more about Comments and co-working in this article : Work together on Visio drawings.
- Learn more about Print and Download as PDF in this article : Print a Visio diagram on the web.
- Learn more about Embed in this article : Display a Visio Diagram on a Web Page.
The Visio document is given a unique default name, Drawing xx, and is created in the same folder as the Excel workbook. This file name can be edited by users that have a Visio license, and this should be done within Visio for Web before electing to edit in Visio for Desktop.
Integrating with Power BI
One of the really cool consequences of this new add-in is that it is possible to create a Visio document and embed it within a Power BI report without a Visio license. You will only need a Power BI licence to collaborate with others ( see powerbi.com ).
First, create a new Power BI report and get the data from the Excel table, or from the source of the query that forms the Excel table. This data is then available in Power BI, and normal visuals such as the Chiclet Slicer, Table and PowerApps visuals can be utilised, as shown below.
Then simply retrieve the shareable link of the Visio document from the Open in Web option above and paste it into the Visio Visual with the unique identifier field of the query selected. The records will then be automatically mapped to the correct shape in the Visio Visual, and then the shapes can have extra text added to them, or they can be coloured by a numeric value.

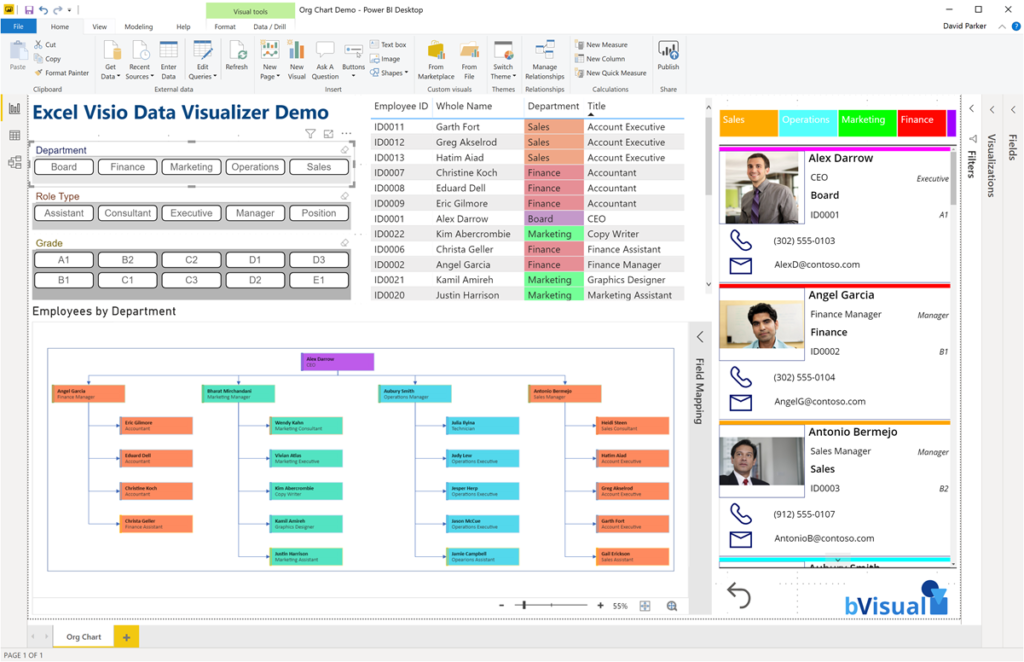
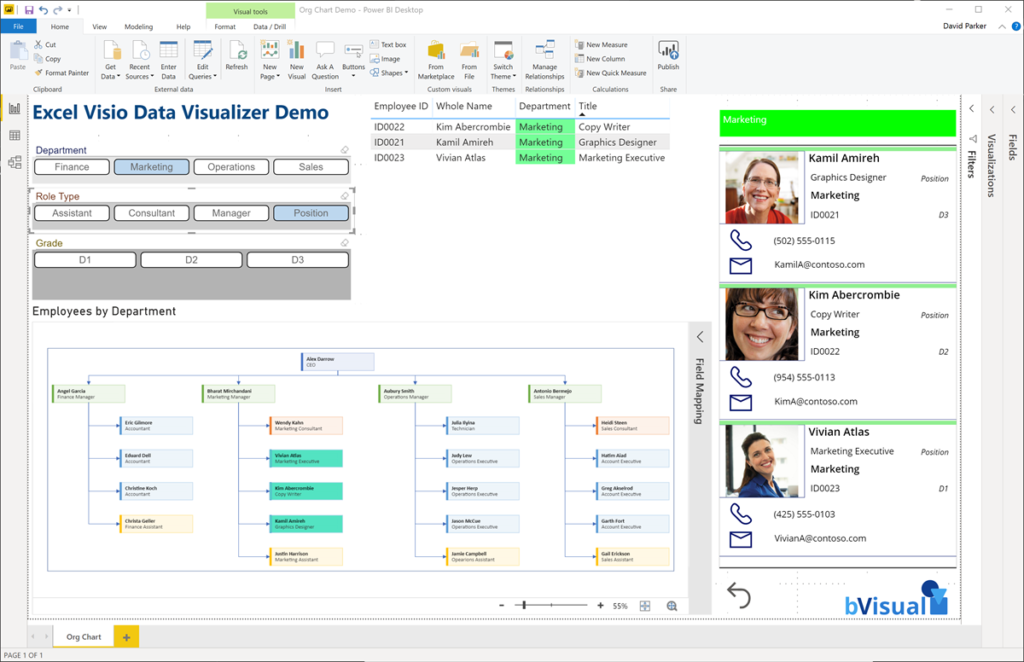
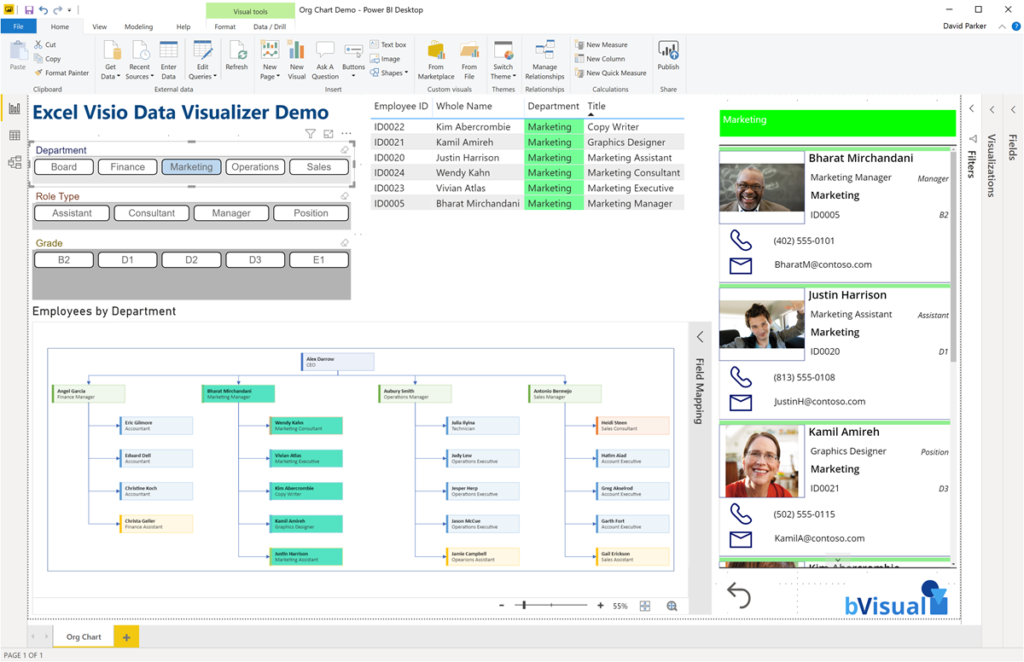
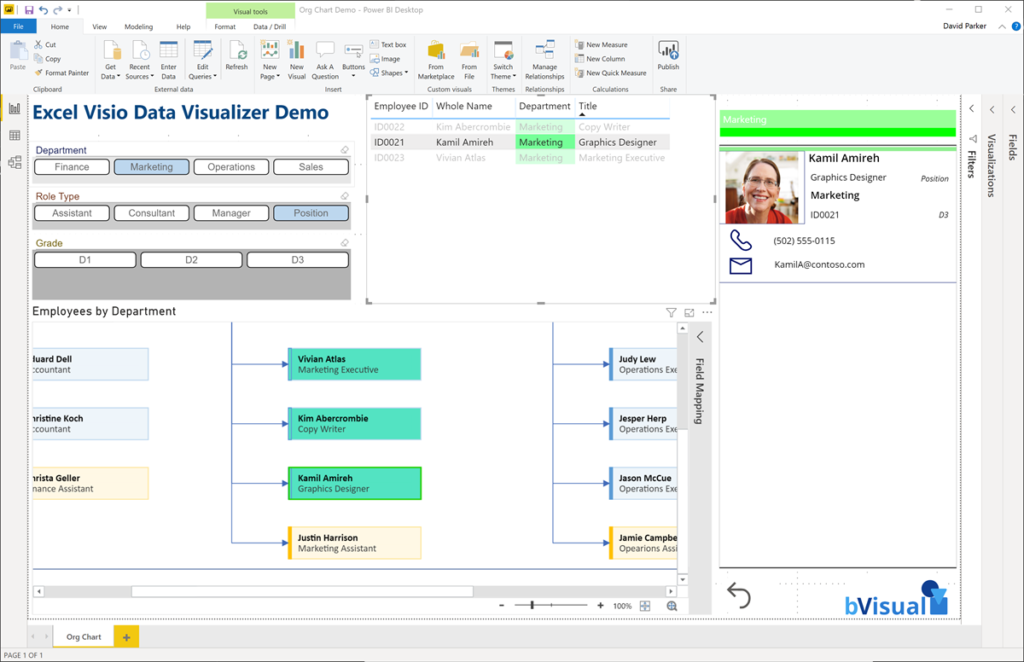
Notice how the Power BI visuals, in this case PowerApps, provides the ability to include images, something that the Visio Data Visualizer add-in is not yet capable of providing.
- Watch a short video of the above : https://youtu.be/9SD5eBEn4rY
- Learn more about Visio and Power BI, including a free guide at : Visio Power BI articles
The future of Data Visualizer
This add-in is currently a preview, so I encourage you all to try it and provide feedback in User Voice to impress the Microsoft development team to focus on the features that are important to you.
This add-in is a truly encouraging direction for Microsoft to take, and I hope will expand to include other diagram types, such as network infrastructure, roadmaps, project plans, and more. There are many refinements that I would also make to the add-in before release, but the future of instantly updateable diagrams is looking extremely encouraging.


My new book on Visualizing Processes with Microsoft Visio has launched
Back in the early 1990s, there was an application called ABC Flowcharter that was the market leader for diagramming business flowcharts, but some of the brains behind Aldus PageMaker saw an opportunity to create something smarter, and left to write the Visio product, with the stated aim to overtake ABC Flowcharter within 2 years. They…

Pushing Data Visualizer in Visio beyond its limits
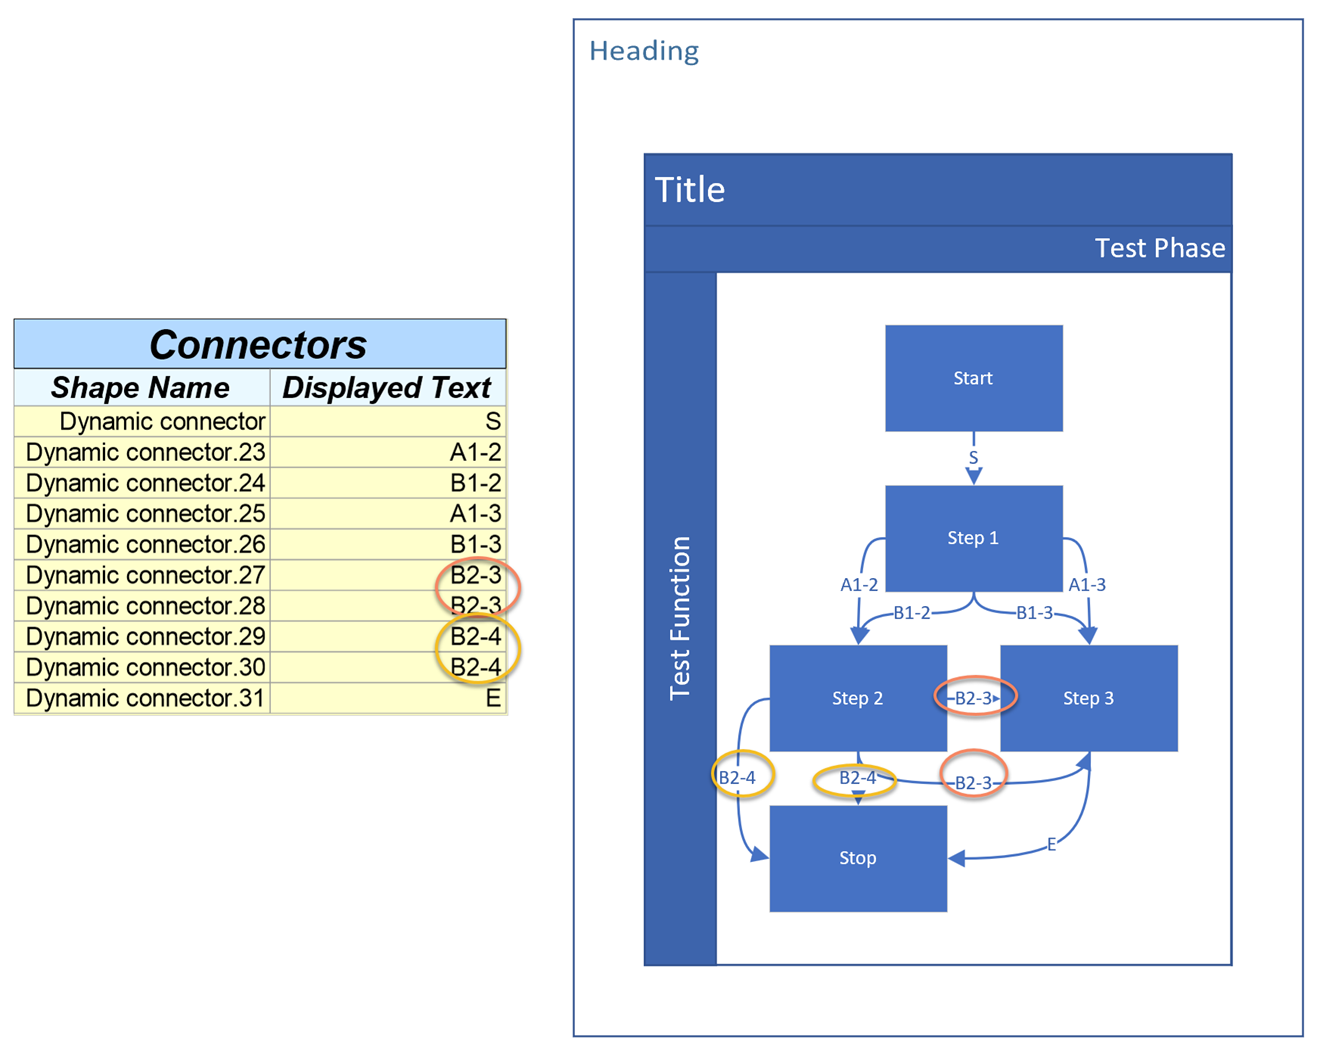
My last post was about some of the lessons learnt when trying to push Data Visualizer to its limits, but this one has some ways of overcoming these limitations. The main lesson learnt is that DV binds the shapes within the DV container shape, CFF Data Visualizer, and controls some of the ShapeSheet cells that…

Pushing Data Visualizer in Visio to the limits!
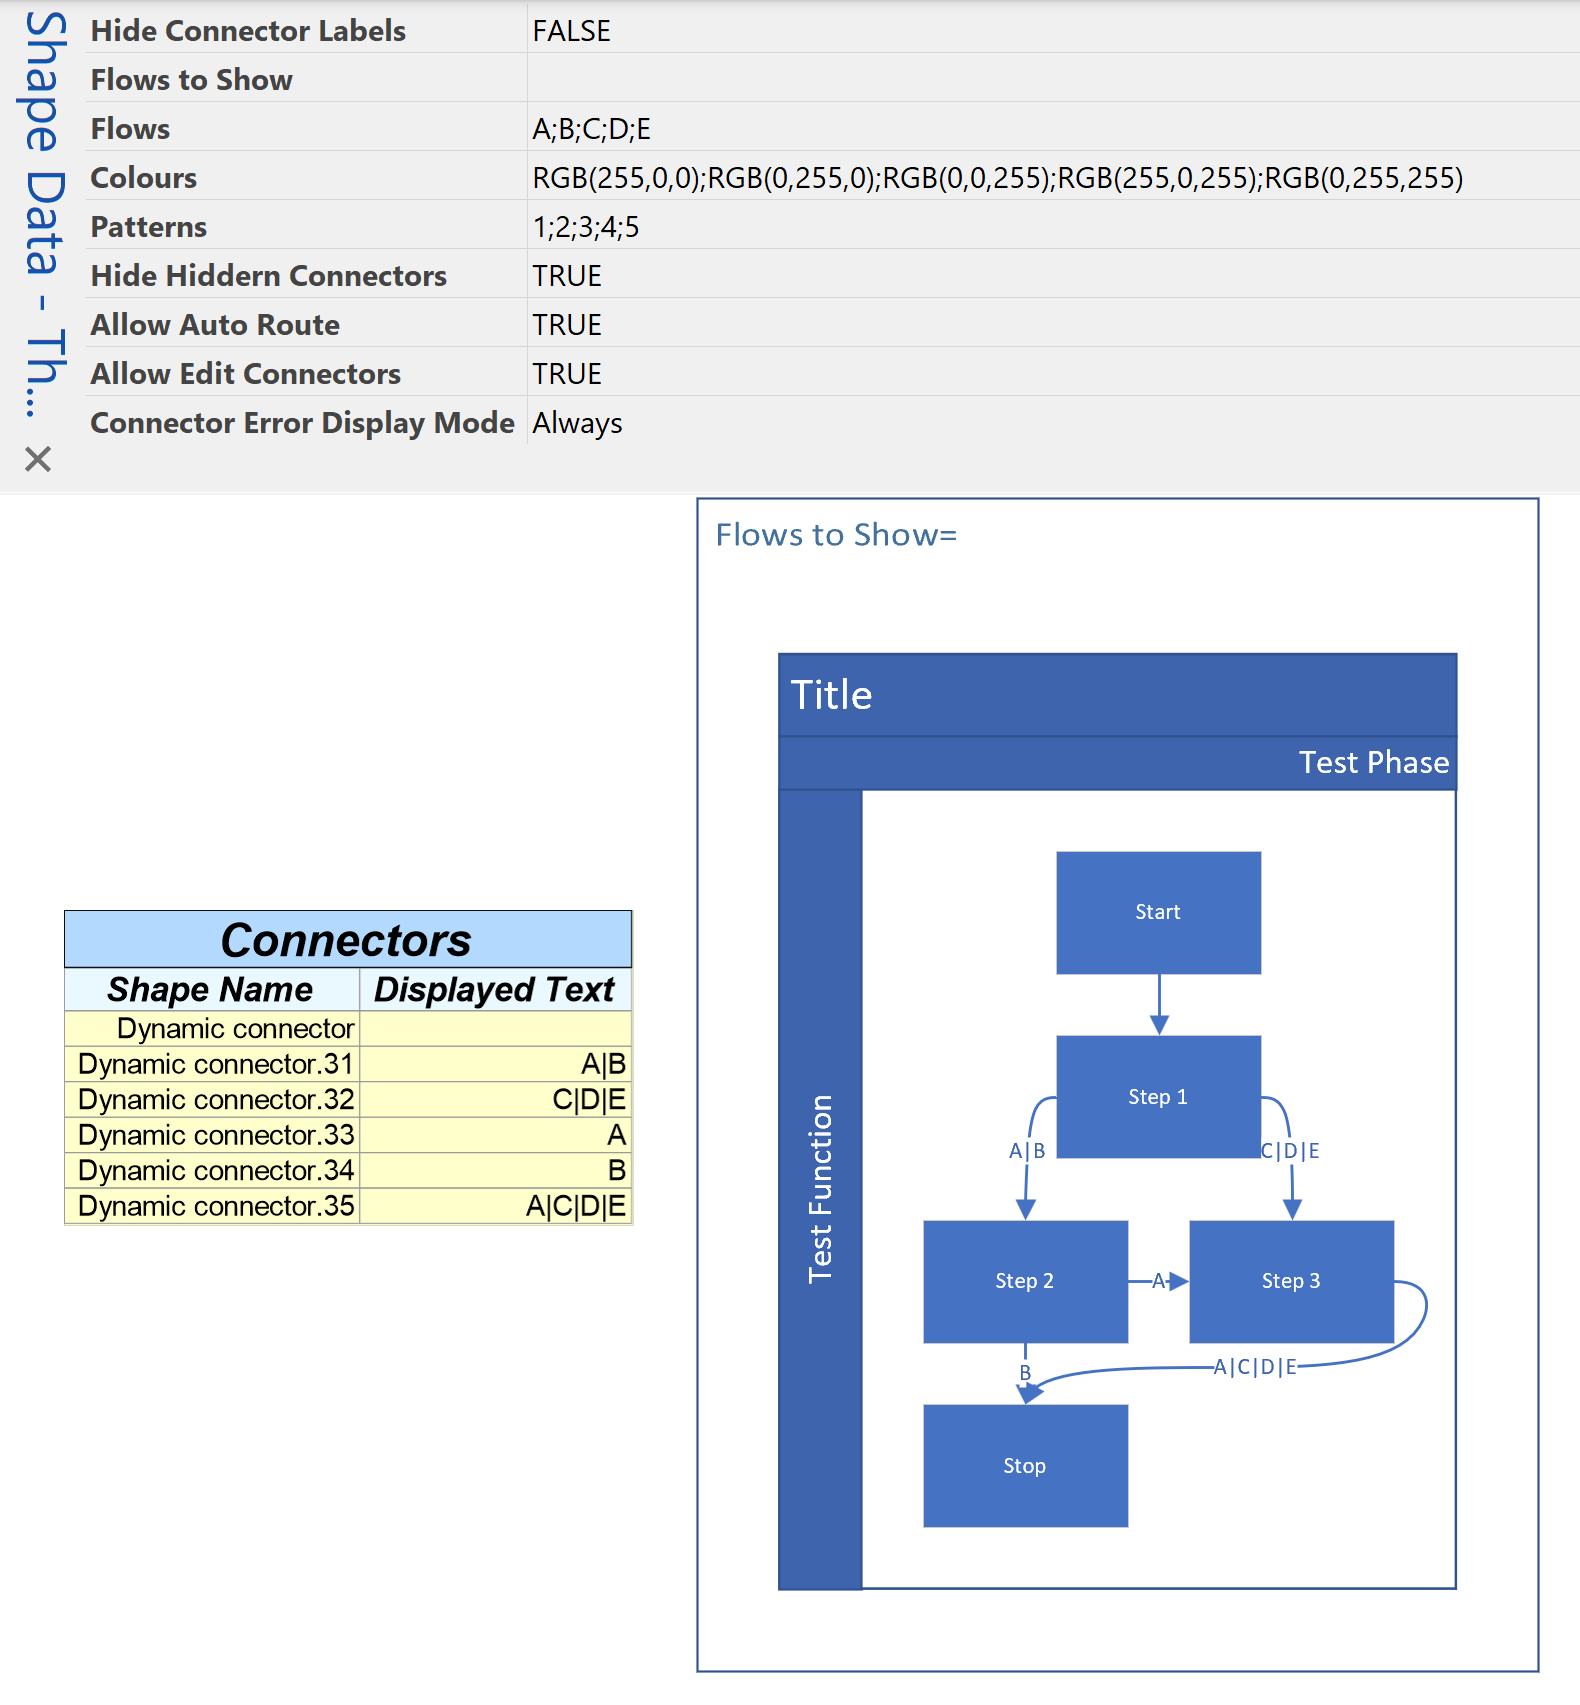
Regular readers of my blog will know that I like to use the Data Visualizer (DV) in Visio Plan 2, but I recently tried to help a user who really decided to push it to the limits. In this scenario, there were multiple connections, but with different labels, being created between the same flowchart shapes,…


Teams Tuesday Podcast Recording about Visio
I am delighted to share the link to my recent demonstration and conversation with fellow MVP Peter Ward about Visio in Teams. We discussed more than just Visio … and I look a bit like Max Headroom! (more…)

Binding Visio and Excel with Data Visualizer
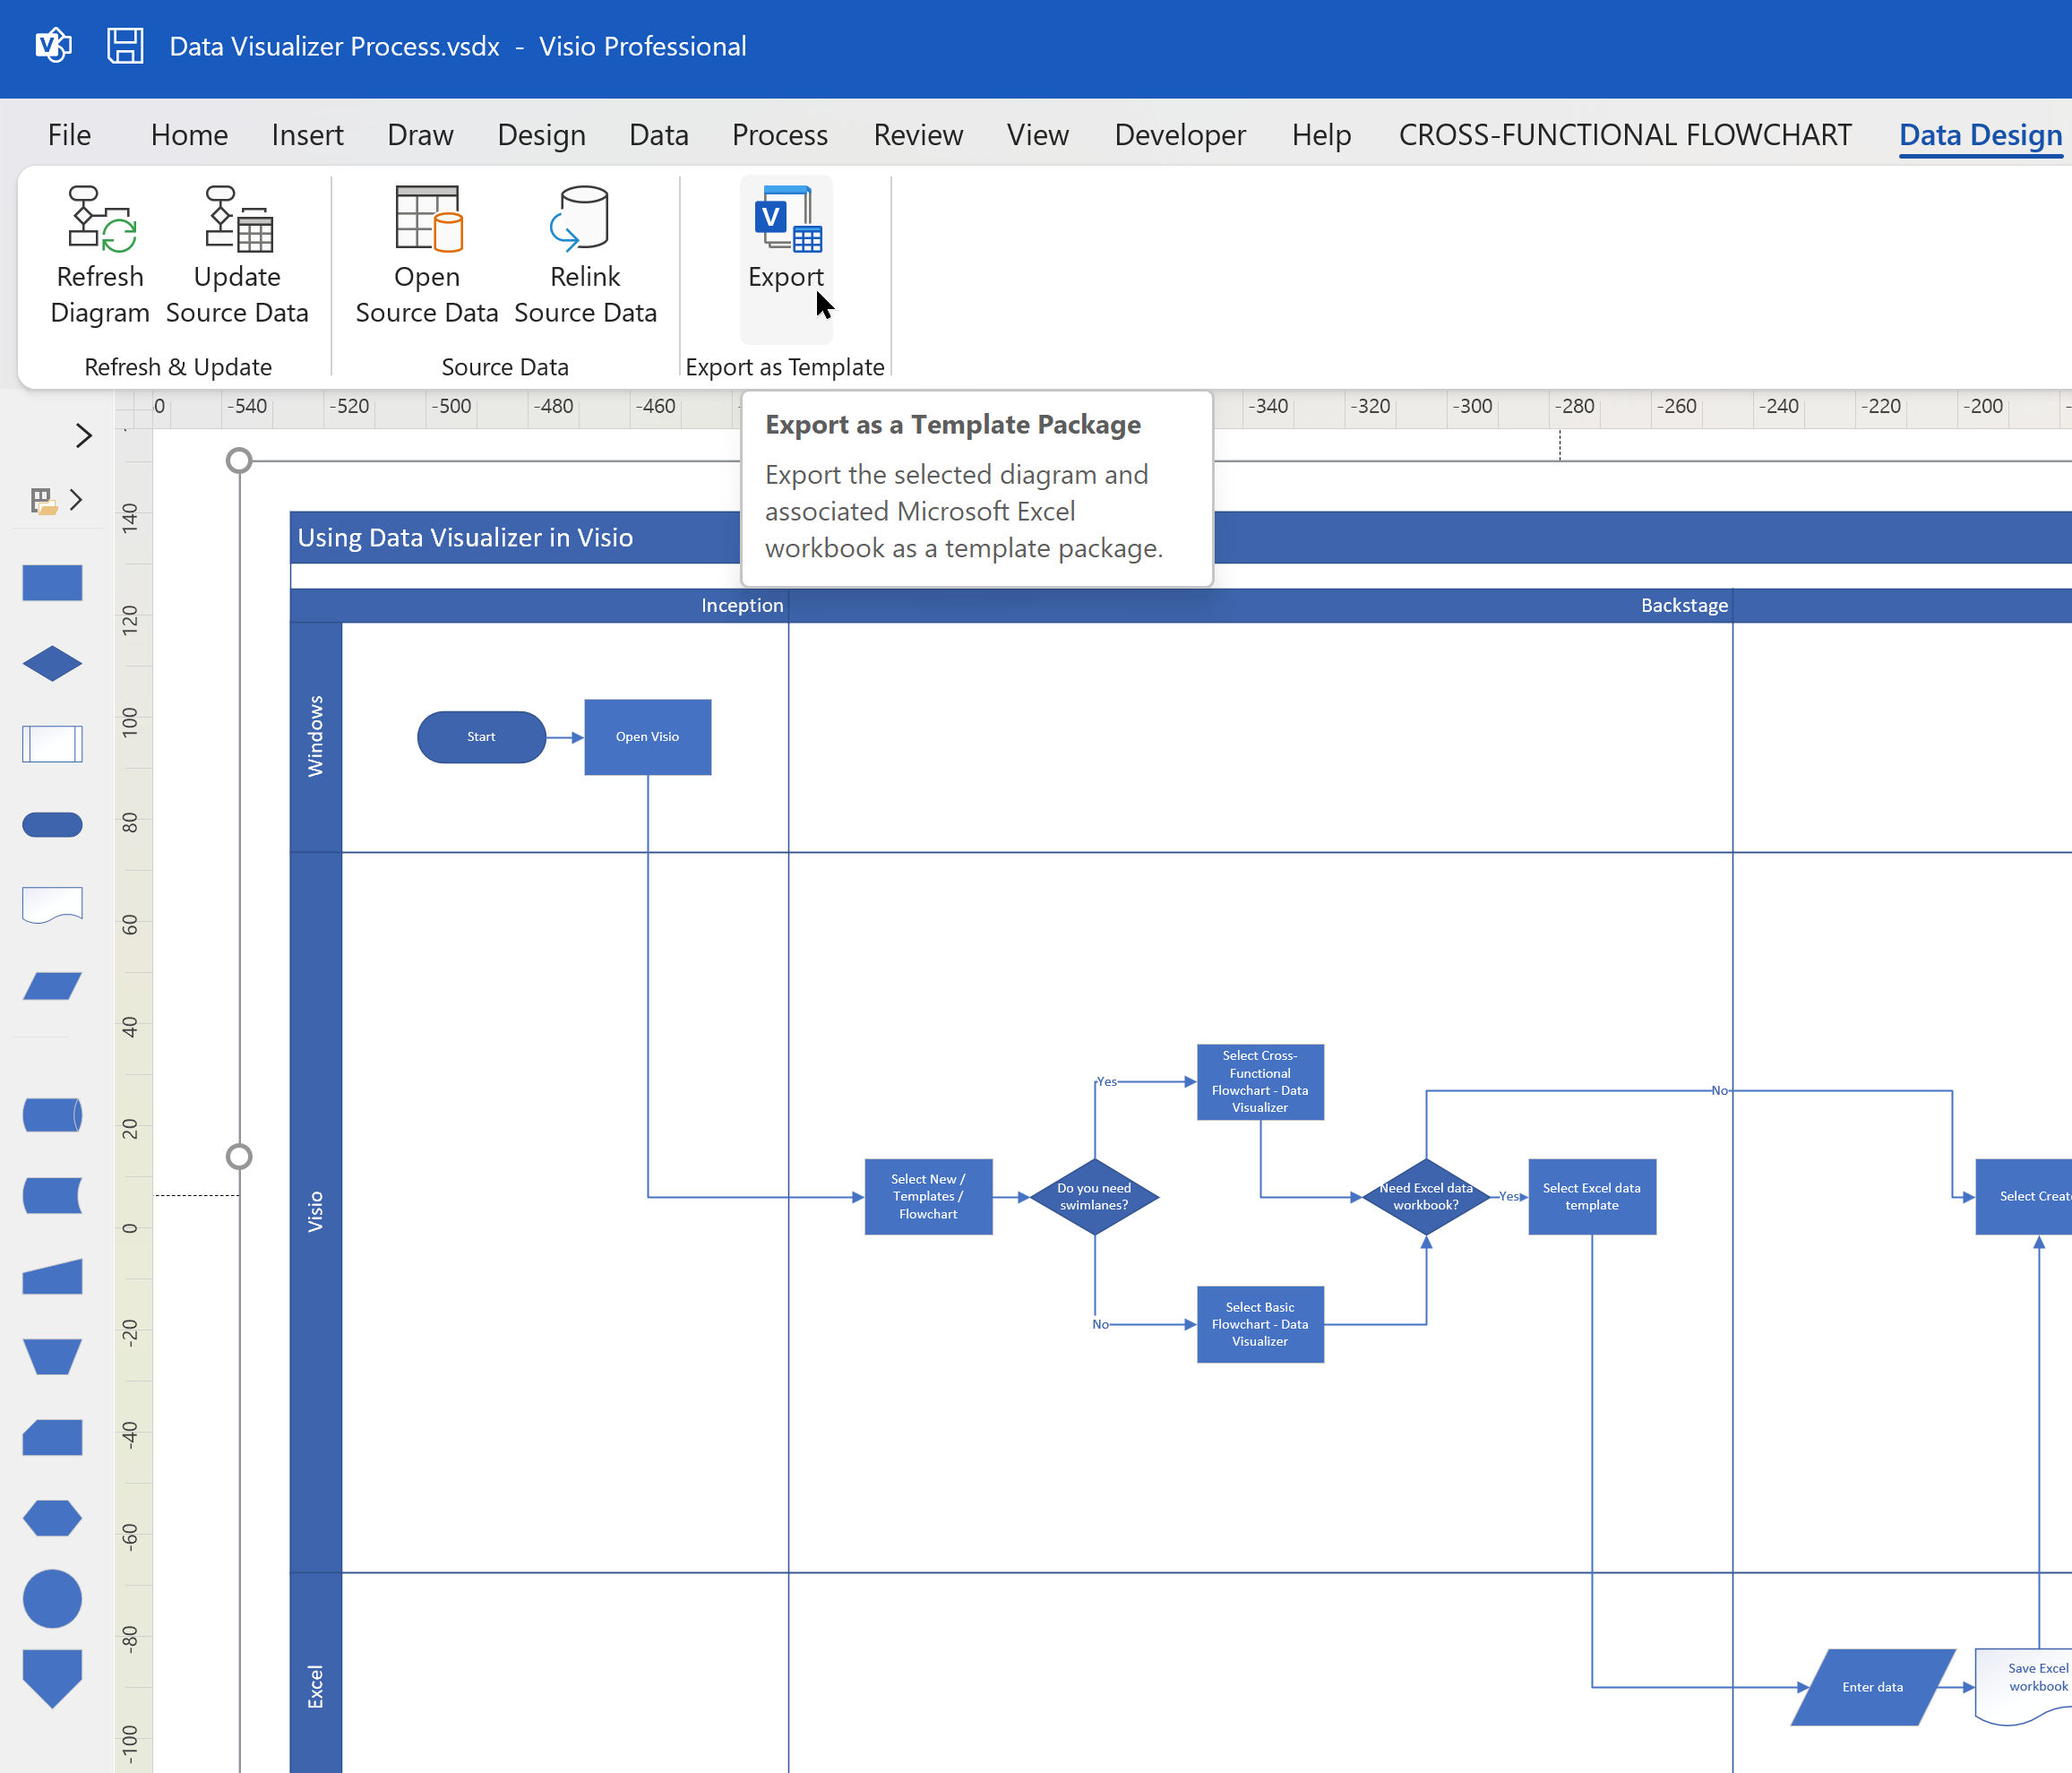
I re-vamped some of my content about the Visio Data Visualizer add-in for Excel in my last post, so I thought I should expand a bit more on the Data Visualizer feature in Visio for Desktop (Visio Plan 2) and Excel for Desktop. I have described it in detail in previous posts, but I never…

Editing Visio Data Visualizer in Excel
I have previously described how to use the Visio Data Visualizer add-in in Excel, but I didn’t make it clear how you can edit the diagram created if you have a Visio license. So, I have recorded three short videos to briefly explain this. (more…)