

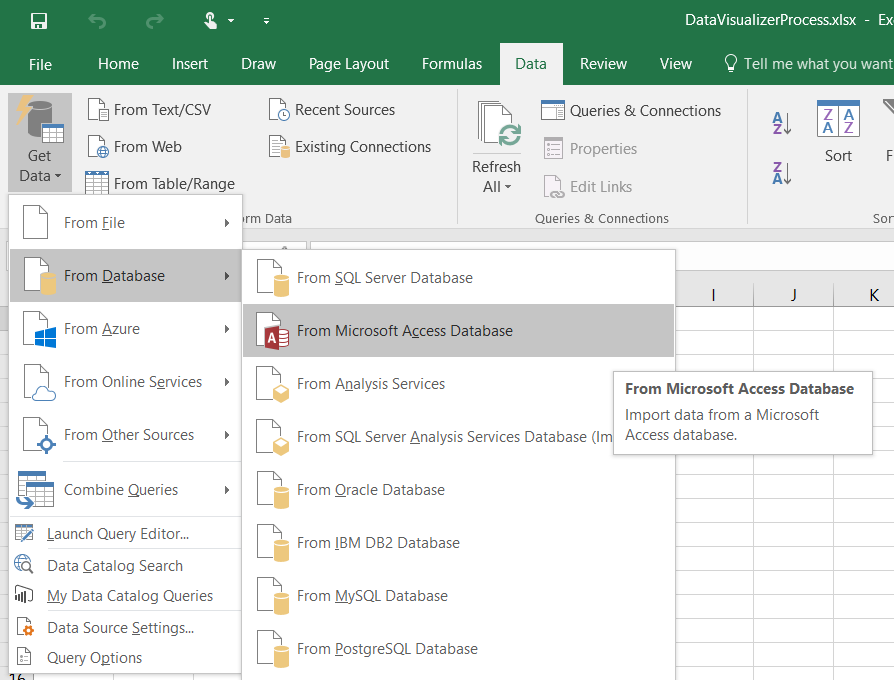
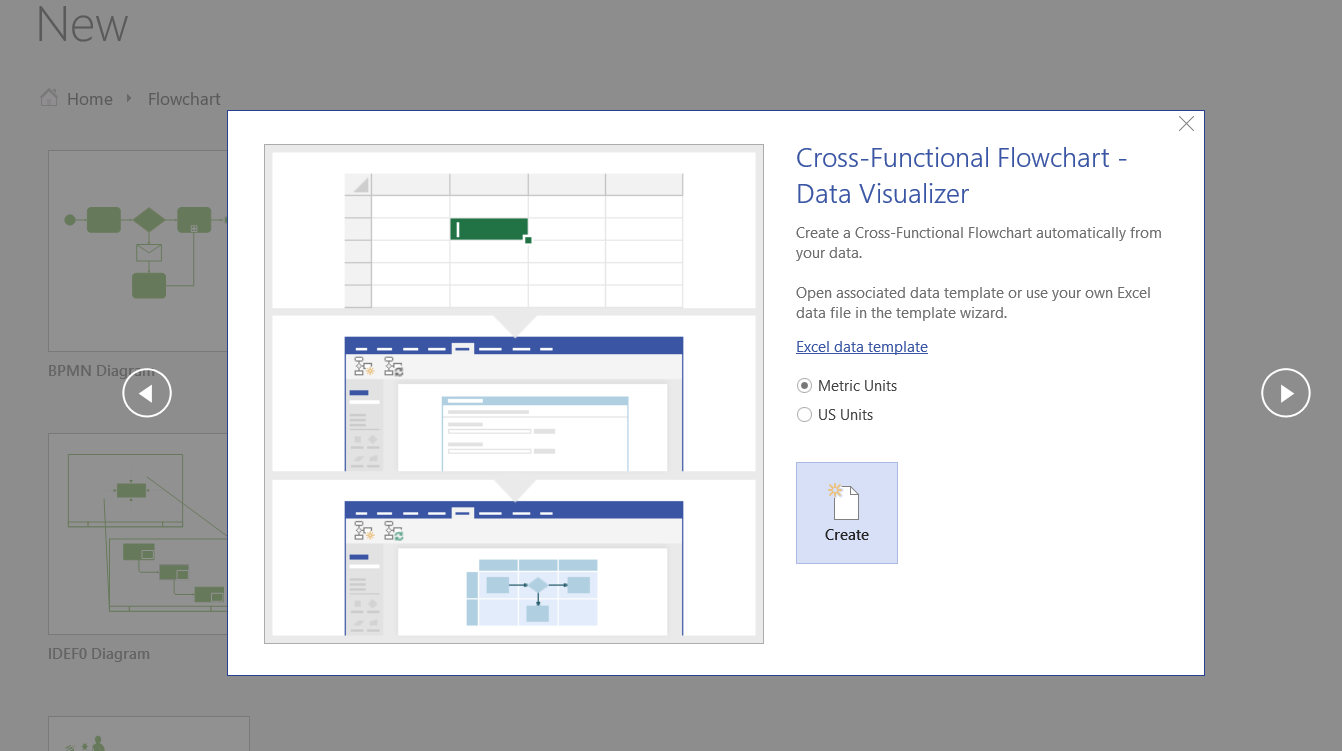
I walked though the steps to create a Cross-Functional flowchart automatically from an Excel table in my last article ( Data Visualizer for #Visio Pro for Office 365 – Part 1 ), but I often prefer to use a relational data source, such as Access or SQL Server, to store and organise my data. Therefore, I describe how Excel‘s Get Data (nee PowerQuery) can be used to merge together the data in a relational data source as a single table suitable for Data Visualizer in Visio Pro for Office 365.


It is easier to explain in a video, but the key elements are Pivot and Merge….

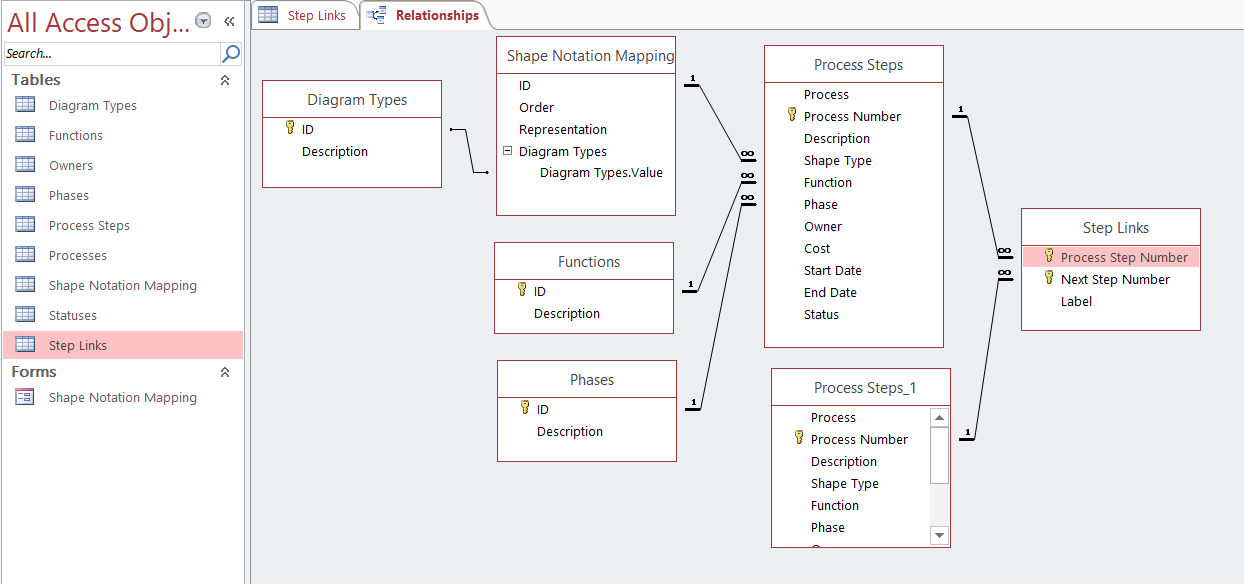
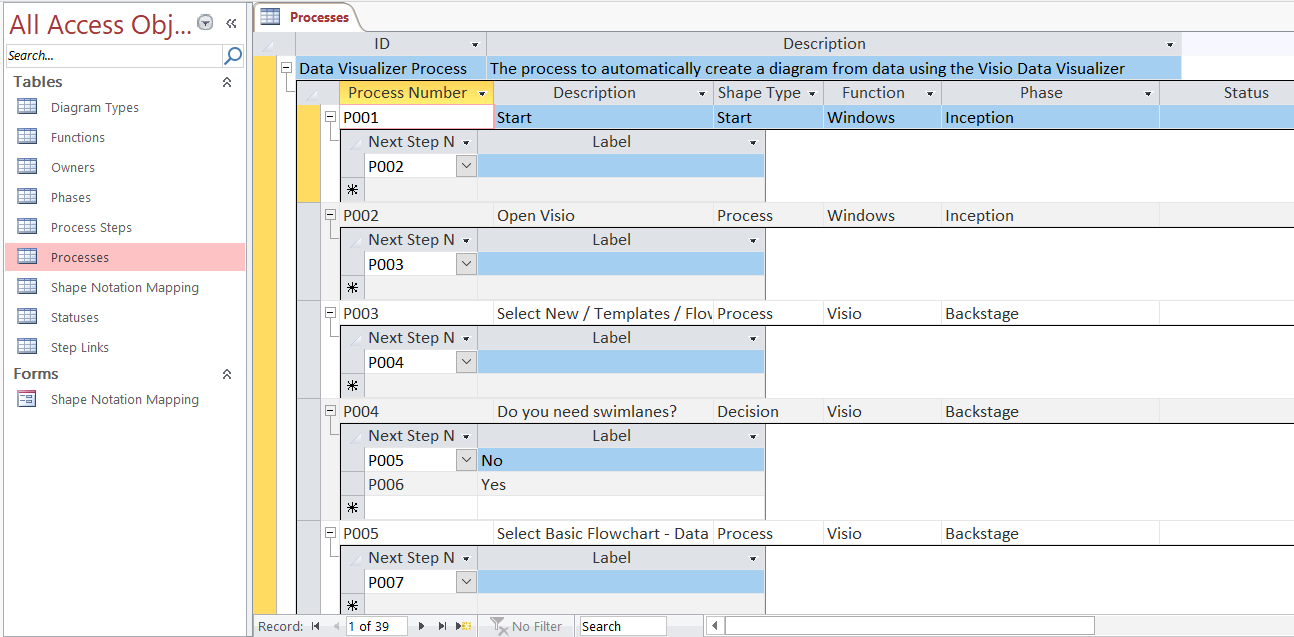
In summary, in Microsoft Access, I normalised the process map table in the Microsoft provided Excel template. The minimum related tables are one for each step in the process, and one to hold the relationship between each step, along with any optional text.
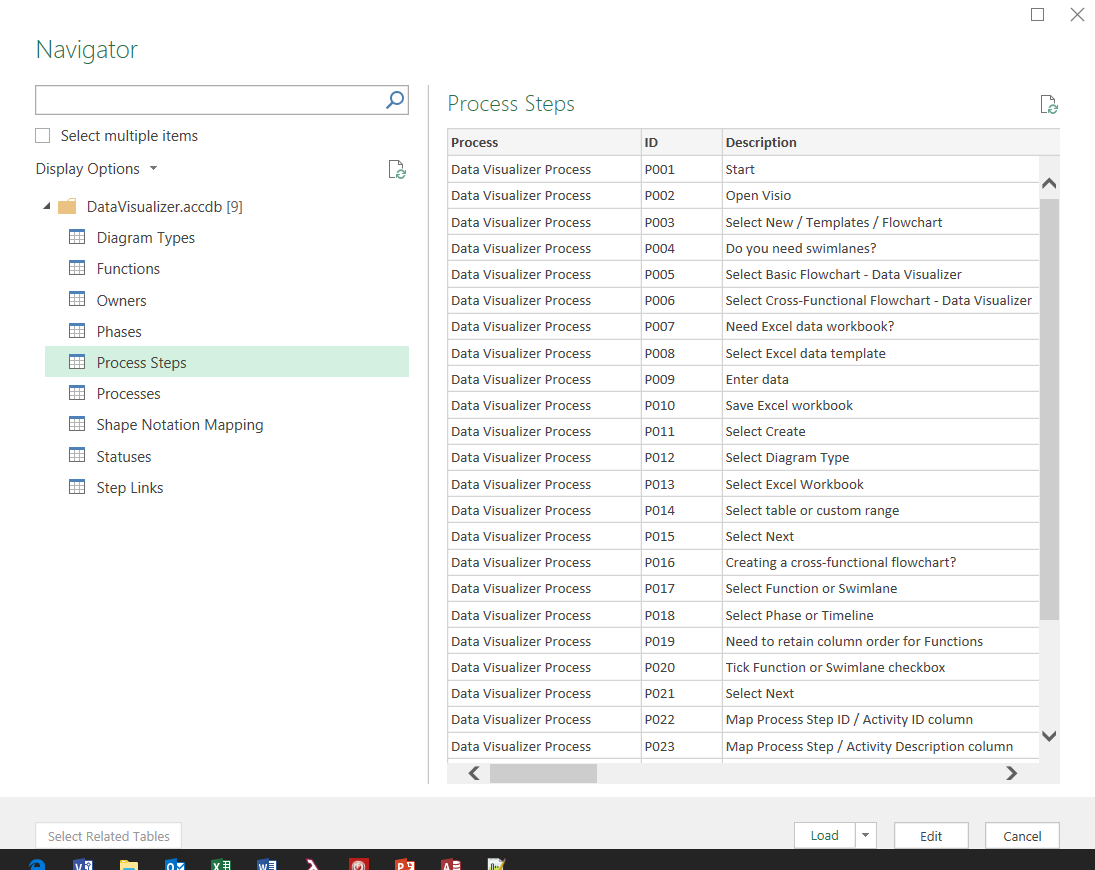
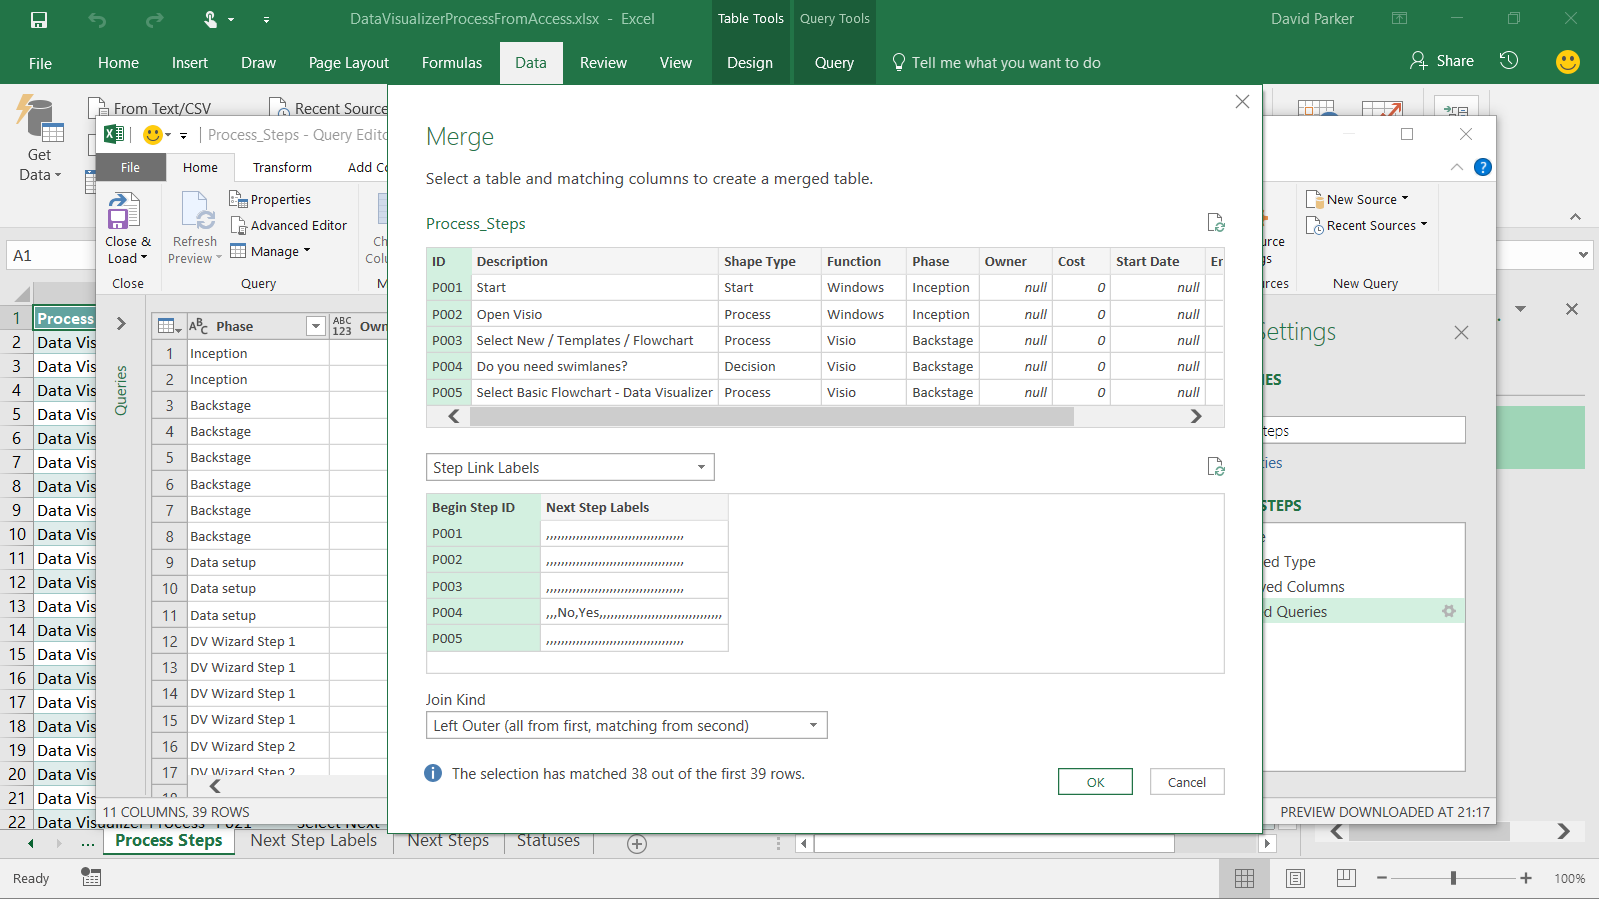
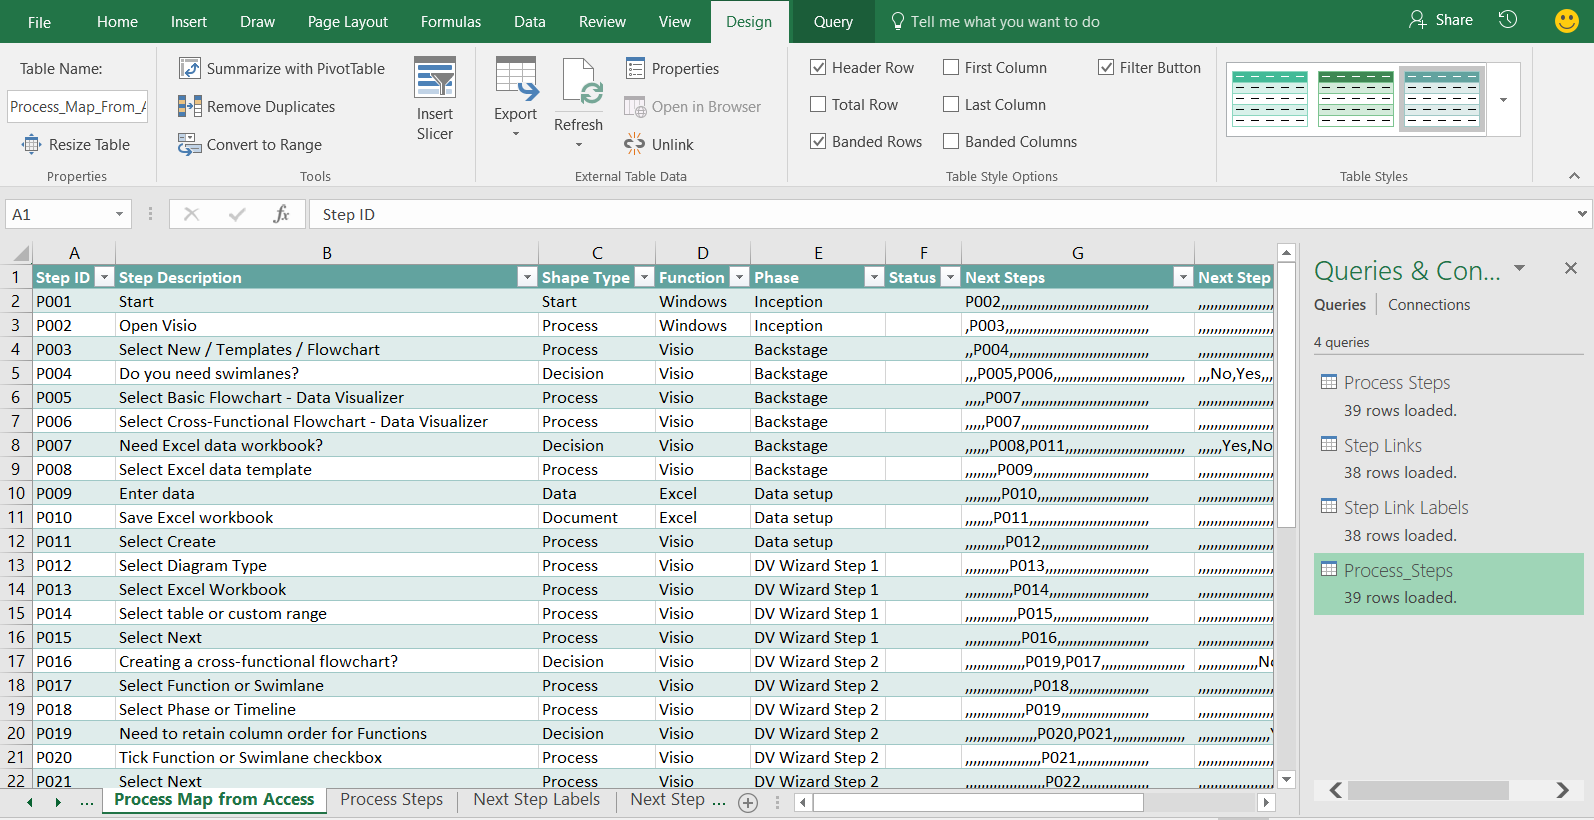
I then used Get Data in Excel to load the process steps table, and the related steps table. I used Transform / Pivot Column and Merge Columns to get the related steps into two flattened queries, both keyed on the source step id, but with one query concatenating the target step ids separated by commas, and the other query concatenating the connector labels separated by commas. These two queries were then merged back with the all of the source steps, to provide a flattened query listing all of the steps along with one column of each target step id, and one with the text to be used on a connector to the next step.