

Back in the early noughties, I was part of a start-up company to to visualise the risks of any dependency system. We used Visio, of course, to map operational components and assets into a hierarchy of dependencies that simply displayed the roll-up of perceived risk. One of the demonstration diagrams that we (mainly Humphrey Tizard) constructed in 2003 was for a global pandemic. How prophetic that seems now!

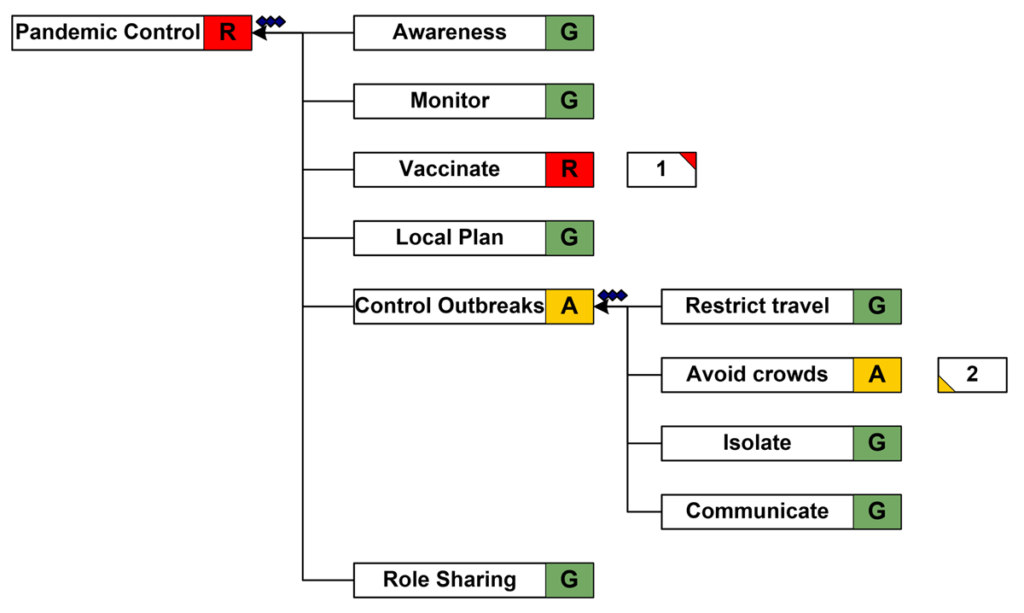
The easy to read RAG status of each element makes it simple to grasp the relationships of risk quickly, and my eyes were immediately drawn to the Red status of Vaccinate. That is exactly where we are at now.

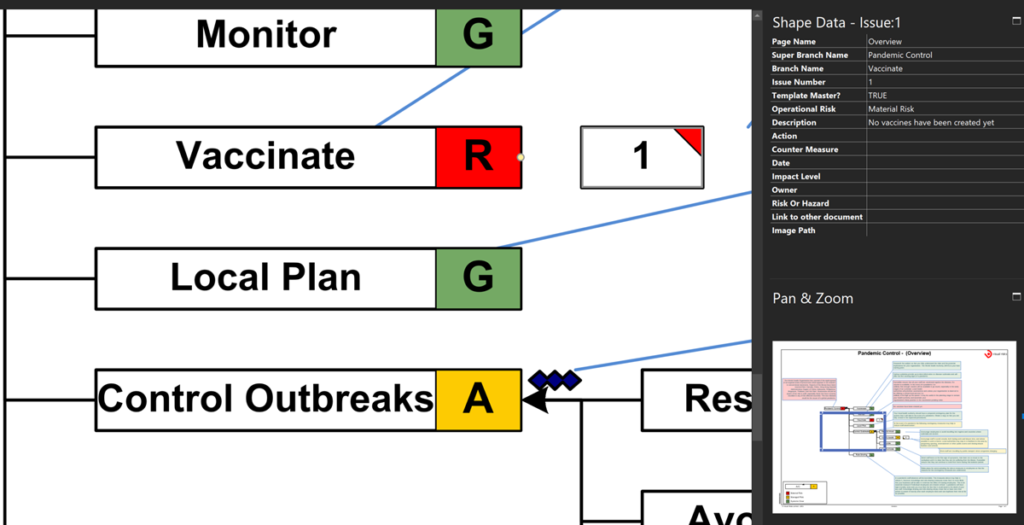
I have often mused on re-vamping this visual risk analysis solution to take advantage of the newer capabilities of Visio desktop and the integration with the web, but, for now, I have simply added in a custom callout shape that displays the contents of the associated Description values in the Shape Data section.

You can view the above diagram in your browser (Pandemic Control), and you can read more about this solution at VRA makes the case for Prudential


Creating Boolean Context Menus in Visio
Over the many, many years that I have been creating Microsoft Visio solutions, I have had to create numerous right-mouse context menus for shapes to control their Shape Data values. Over that time, patterns emerge, so this article is highlighting three different appearances for simple Boolean values, otherwise known as True/False or Yes/No values, and…

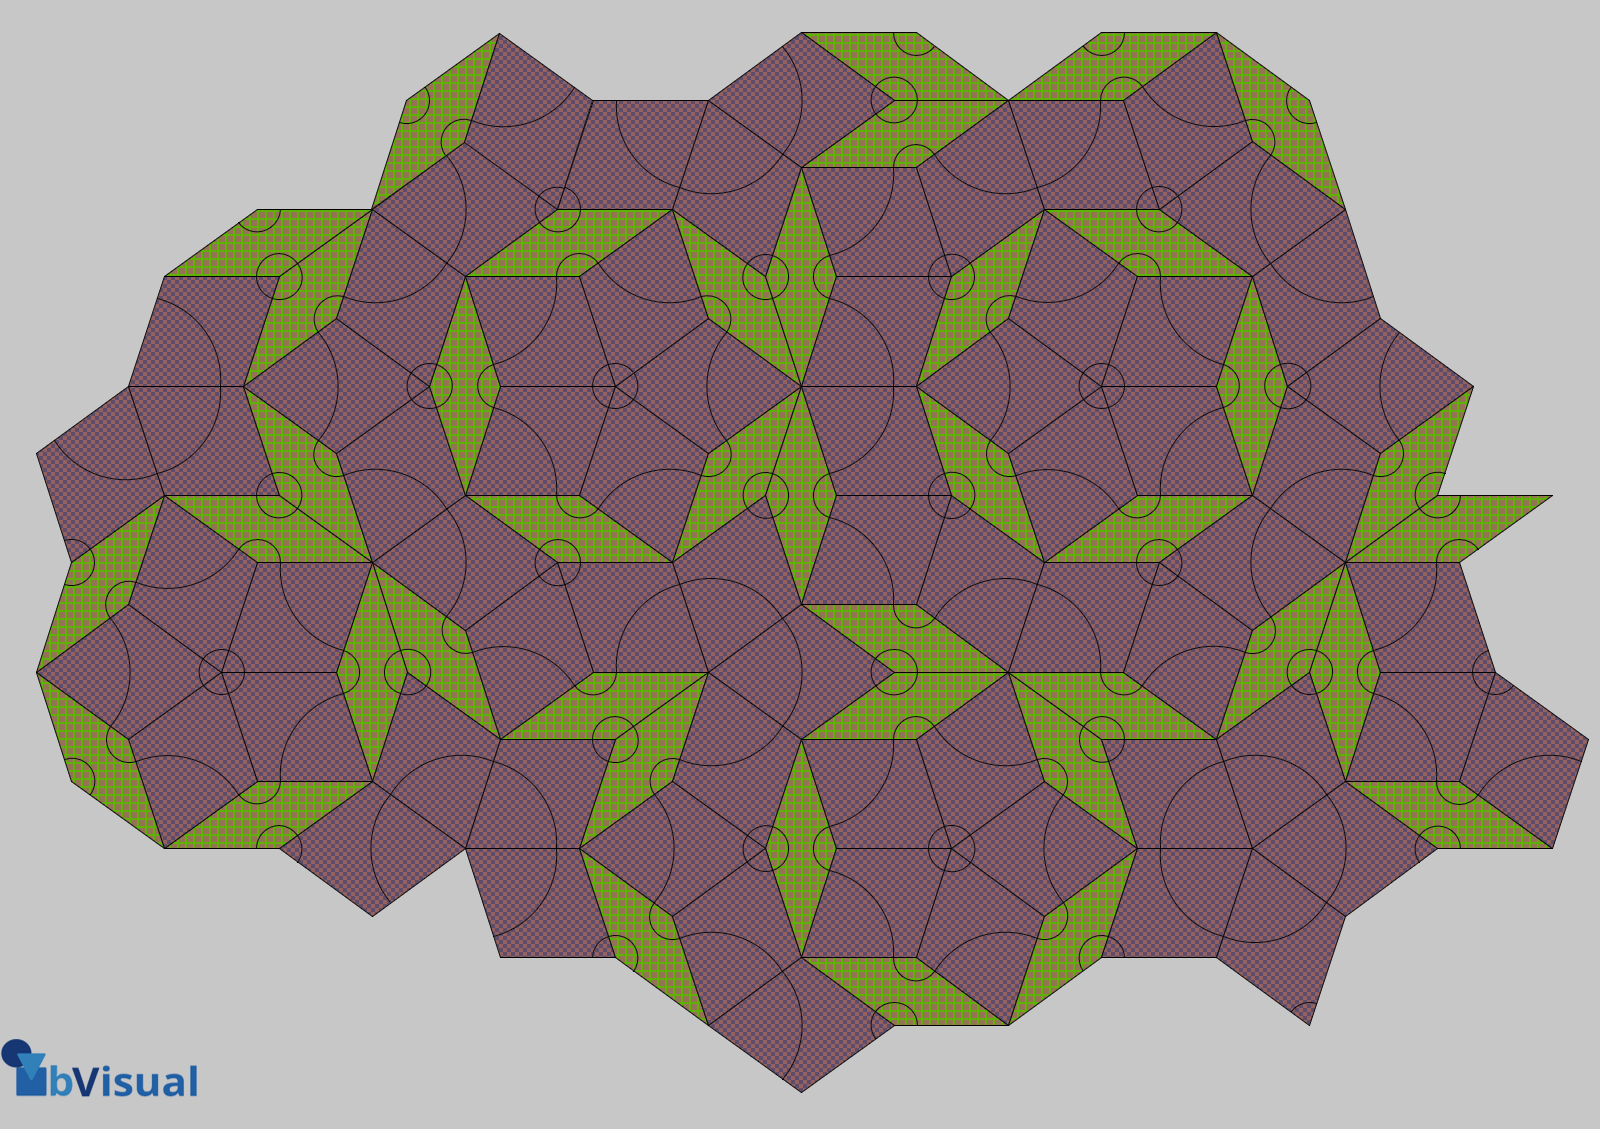
A visual exploration of Penrose Tiling in Visio
Maybe it is because I used to be a building architect, but I have always been fascinated by the relationship between numbers and visualisations. Perhaps the most famous one is the Golden Ratio which has been used as the basis of many building designs and art pieces. It is often recognised to create a harmony…

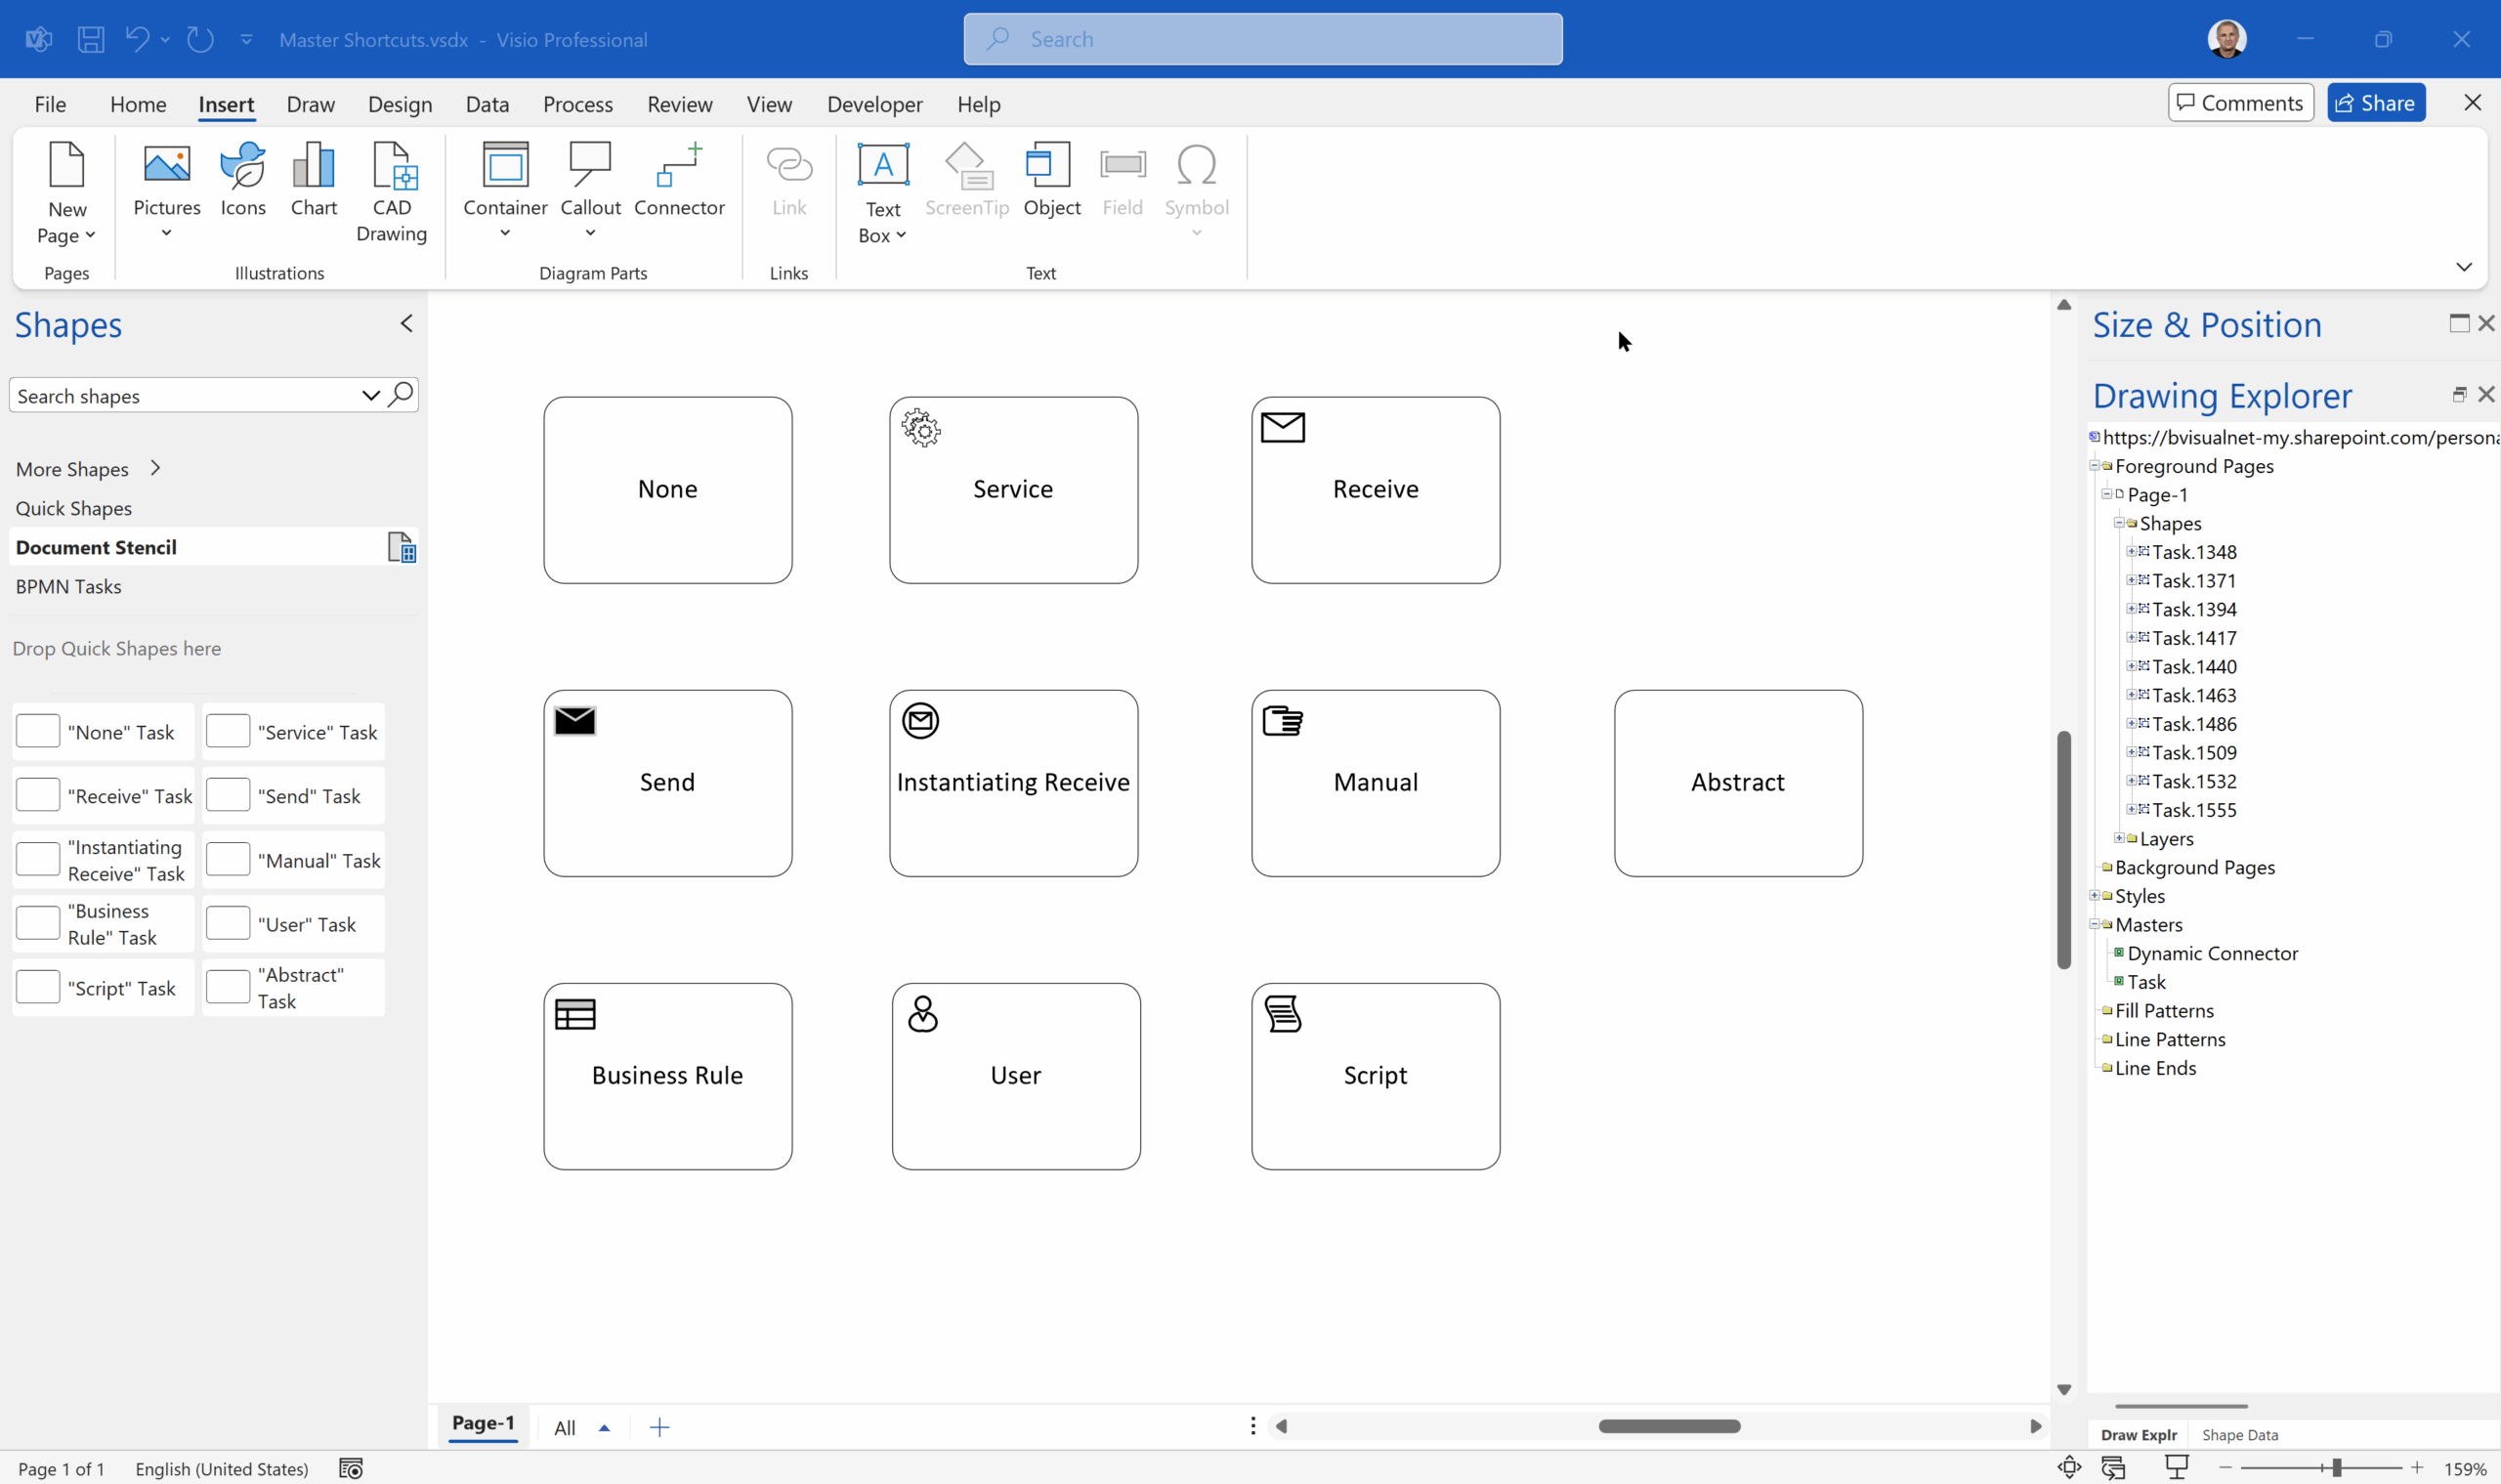
Are Master Shortcuts useful in Visio?
Many Visio users may not even understand the question, but this almost hidden feature has been available for many years. A Master Shortcut looks like a normal Master in a stencil, but it is merely holds a reference to another Master in a Stencil, not necessarily the same one, and has an option to add…

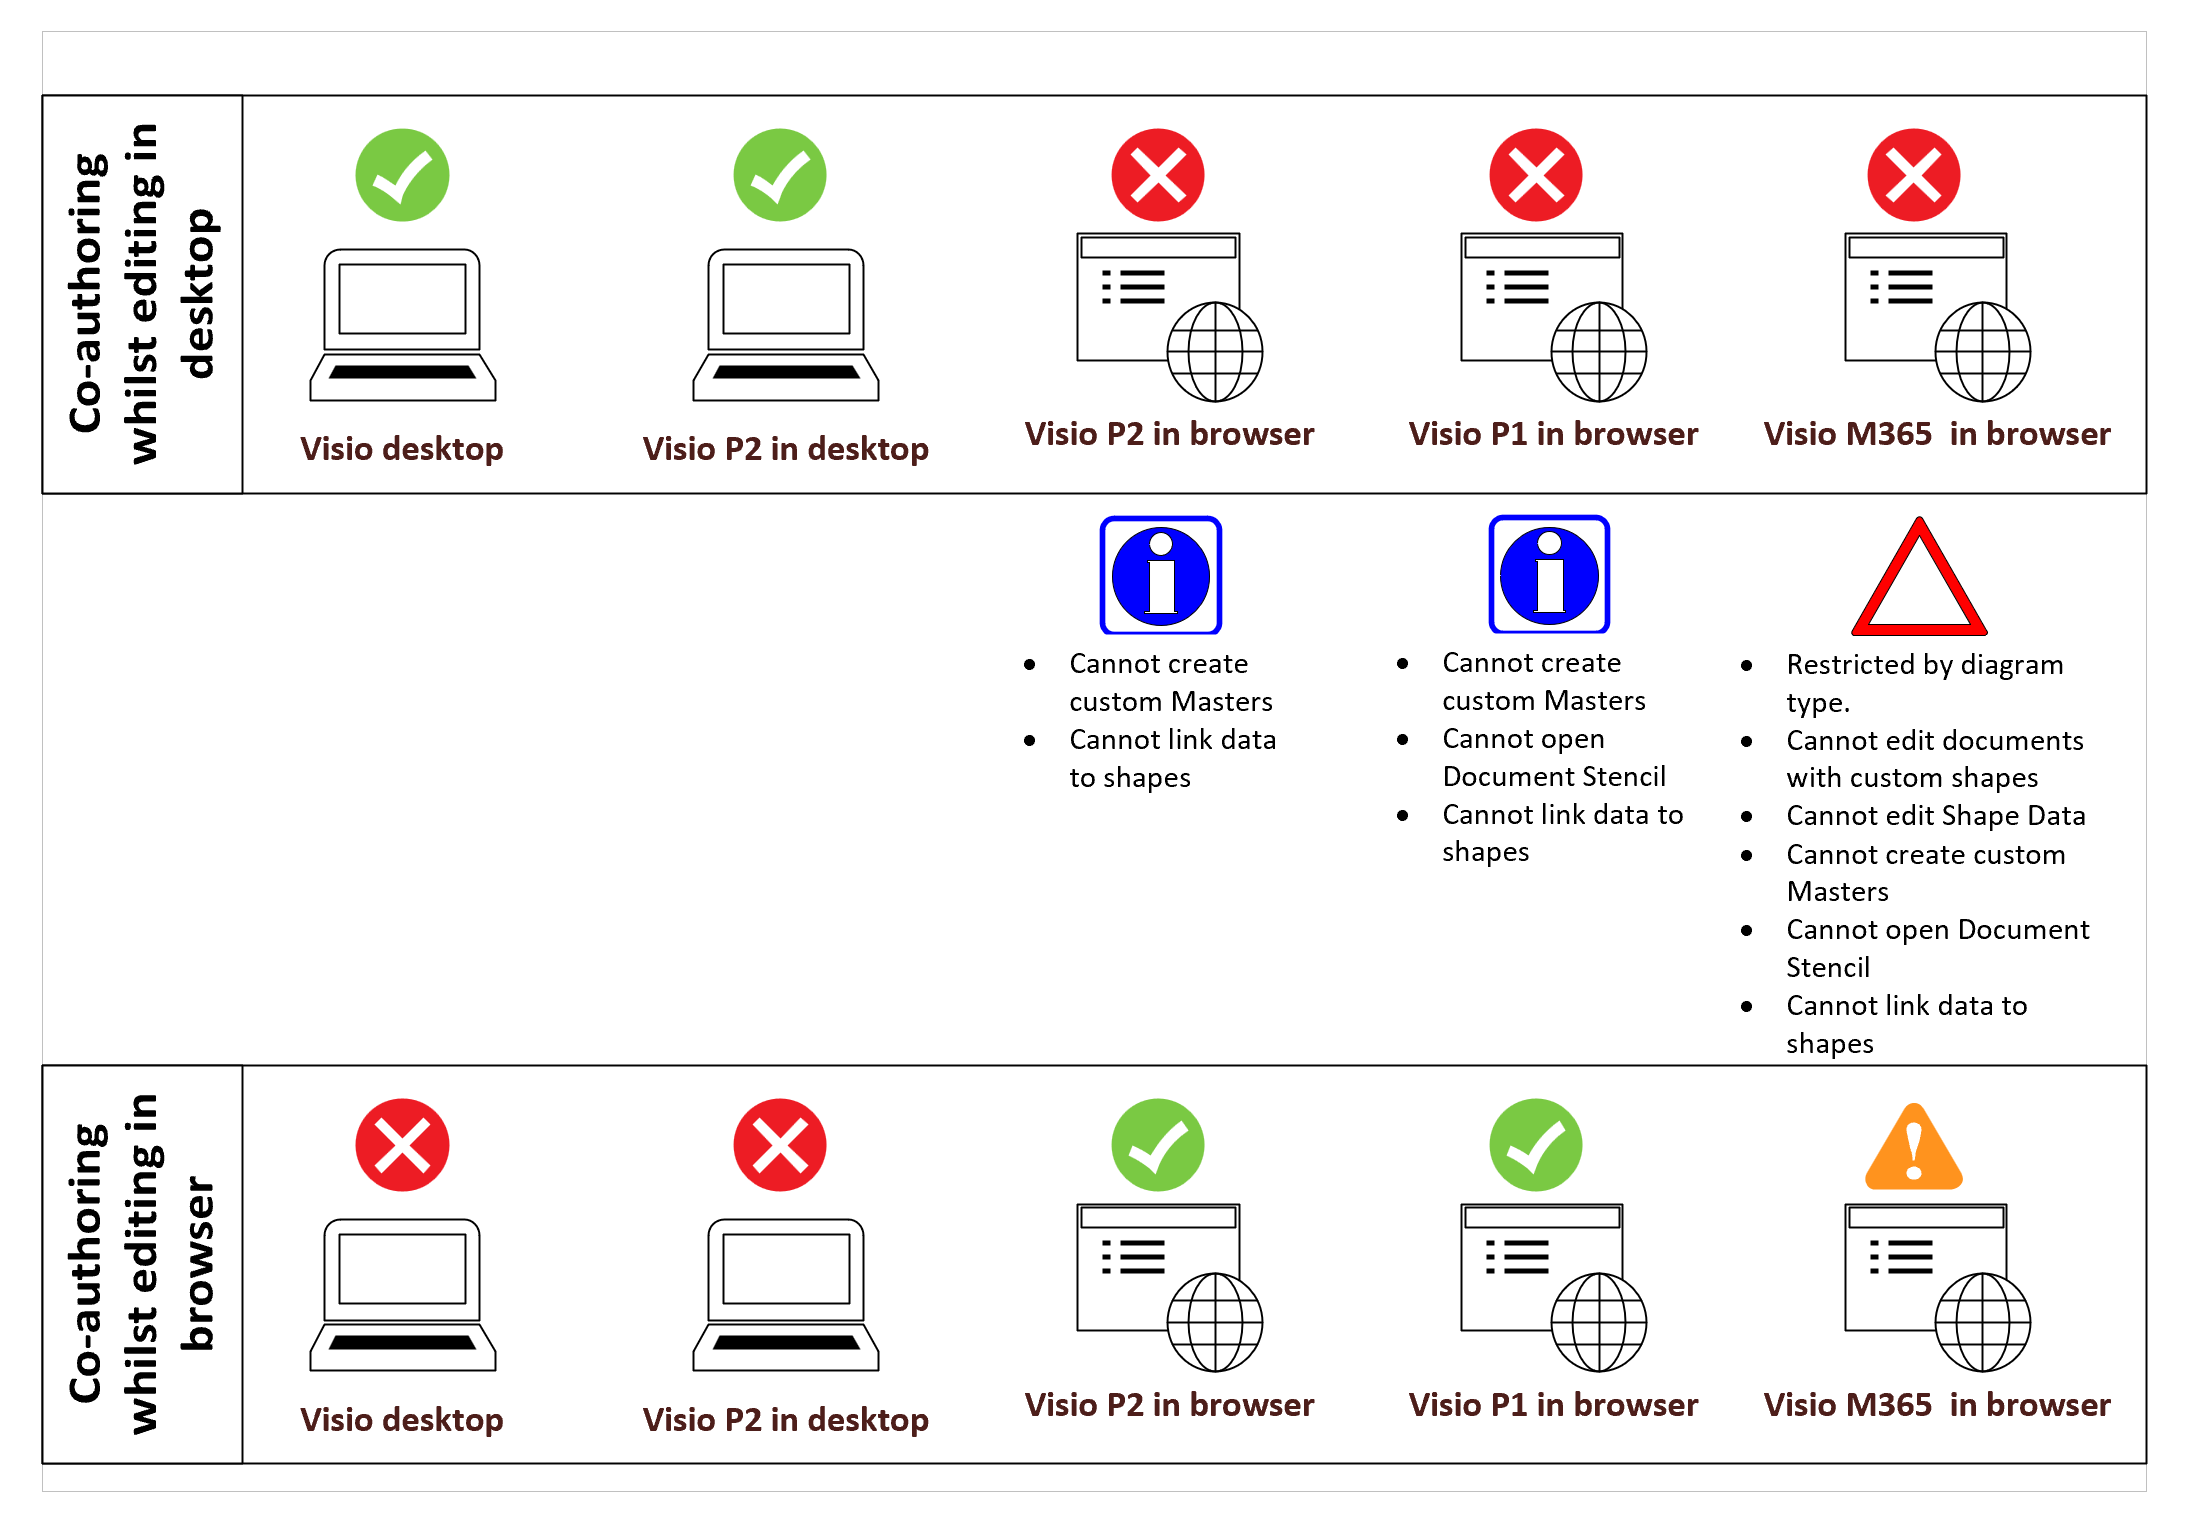
Co-authoring and Commenting with Visio Documents
Microsoft Visio can be used in the web browser and on the desktop, but there are several licensing options available, so which ones can be used concurrently whilst supporting co-authoring and commenting? This article tests the various scenarios but assumes that the Visio documents are stored in OneDrive for Business or SharePoint Online\Teams. The Microsoft…

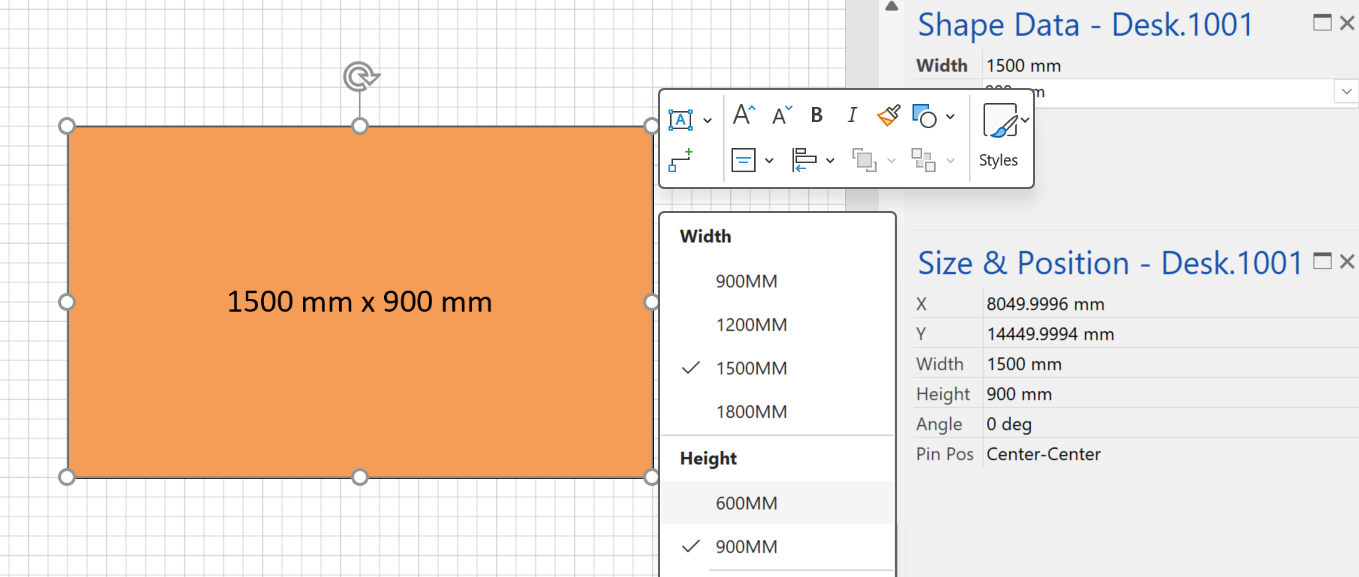
Fixing dimensions of 2D shapes
I am often asked what makes Visio unique and makes it stand out from the crowd, especially in today’s online world. Well, I think there are many reasons, but one of them is the ability to create scaled drawings with parametric components of specific dimensions. This was crucial for my adoption of Visio back in…

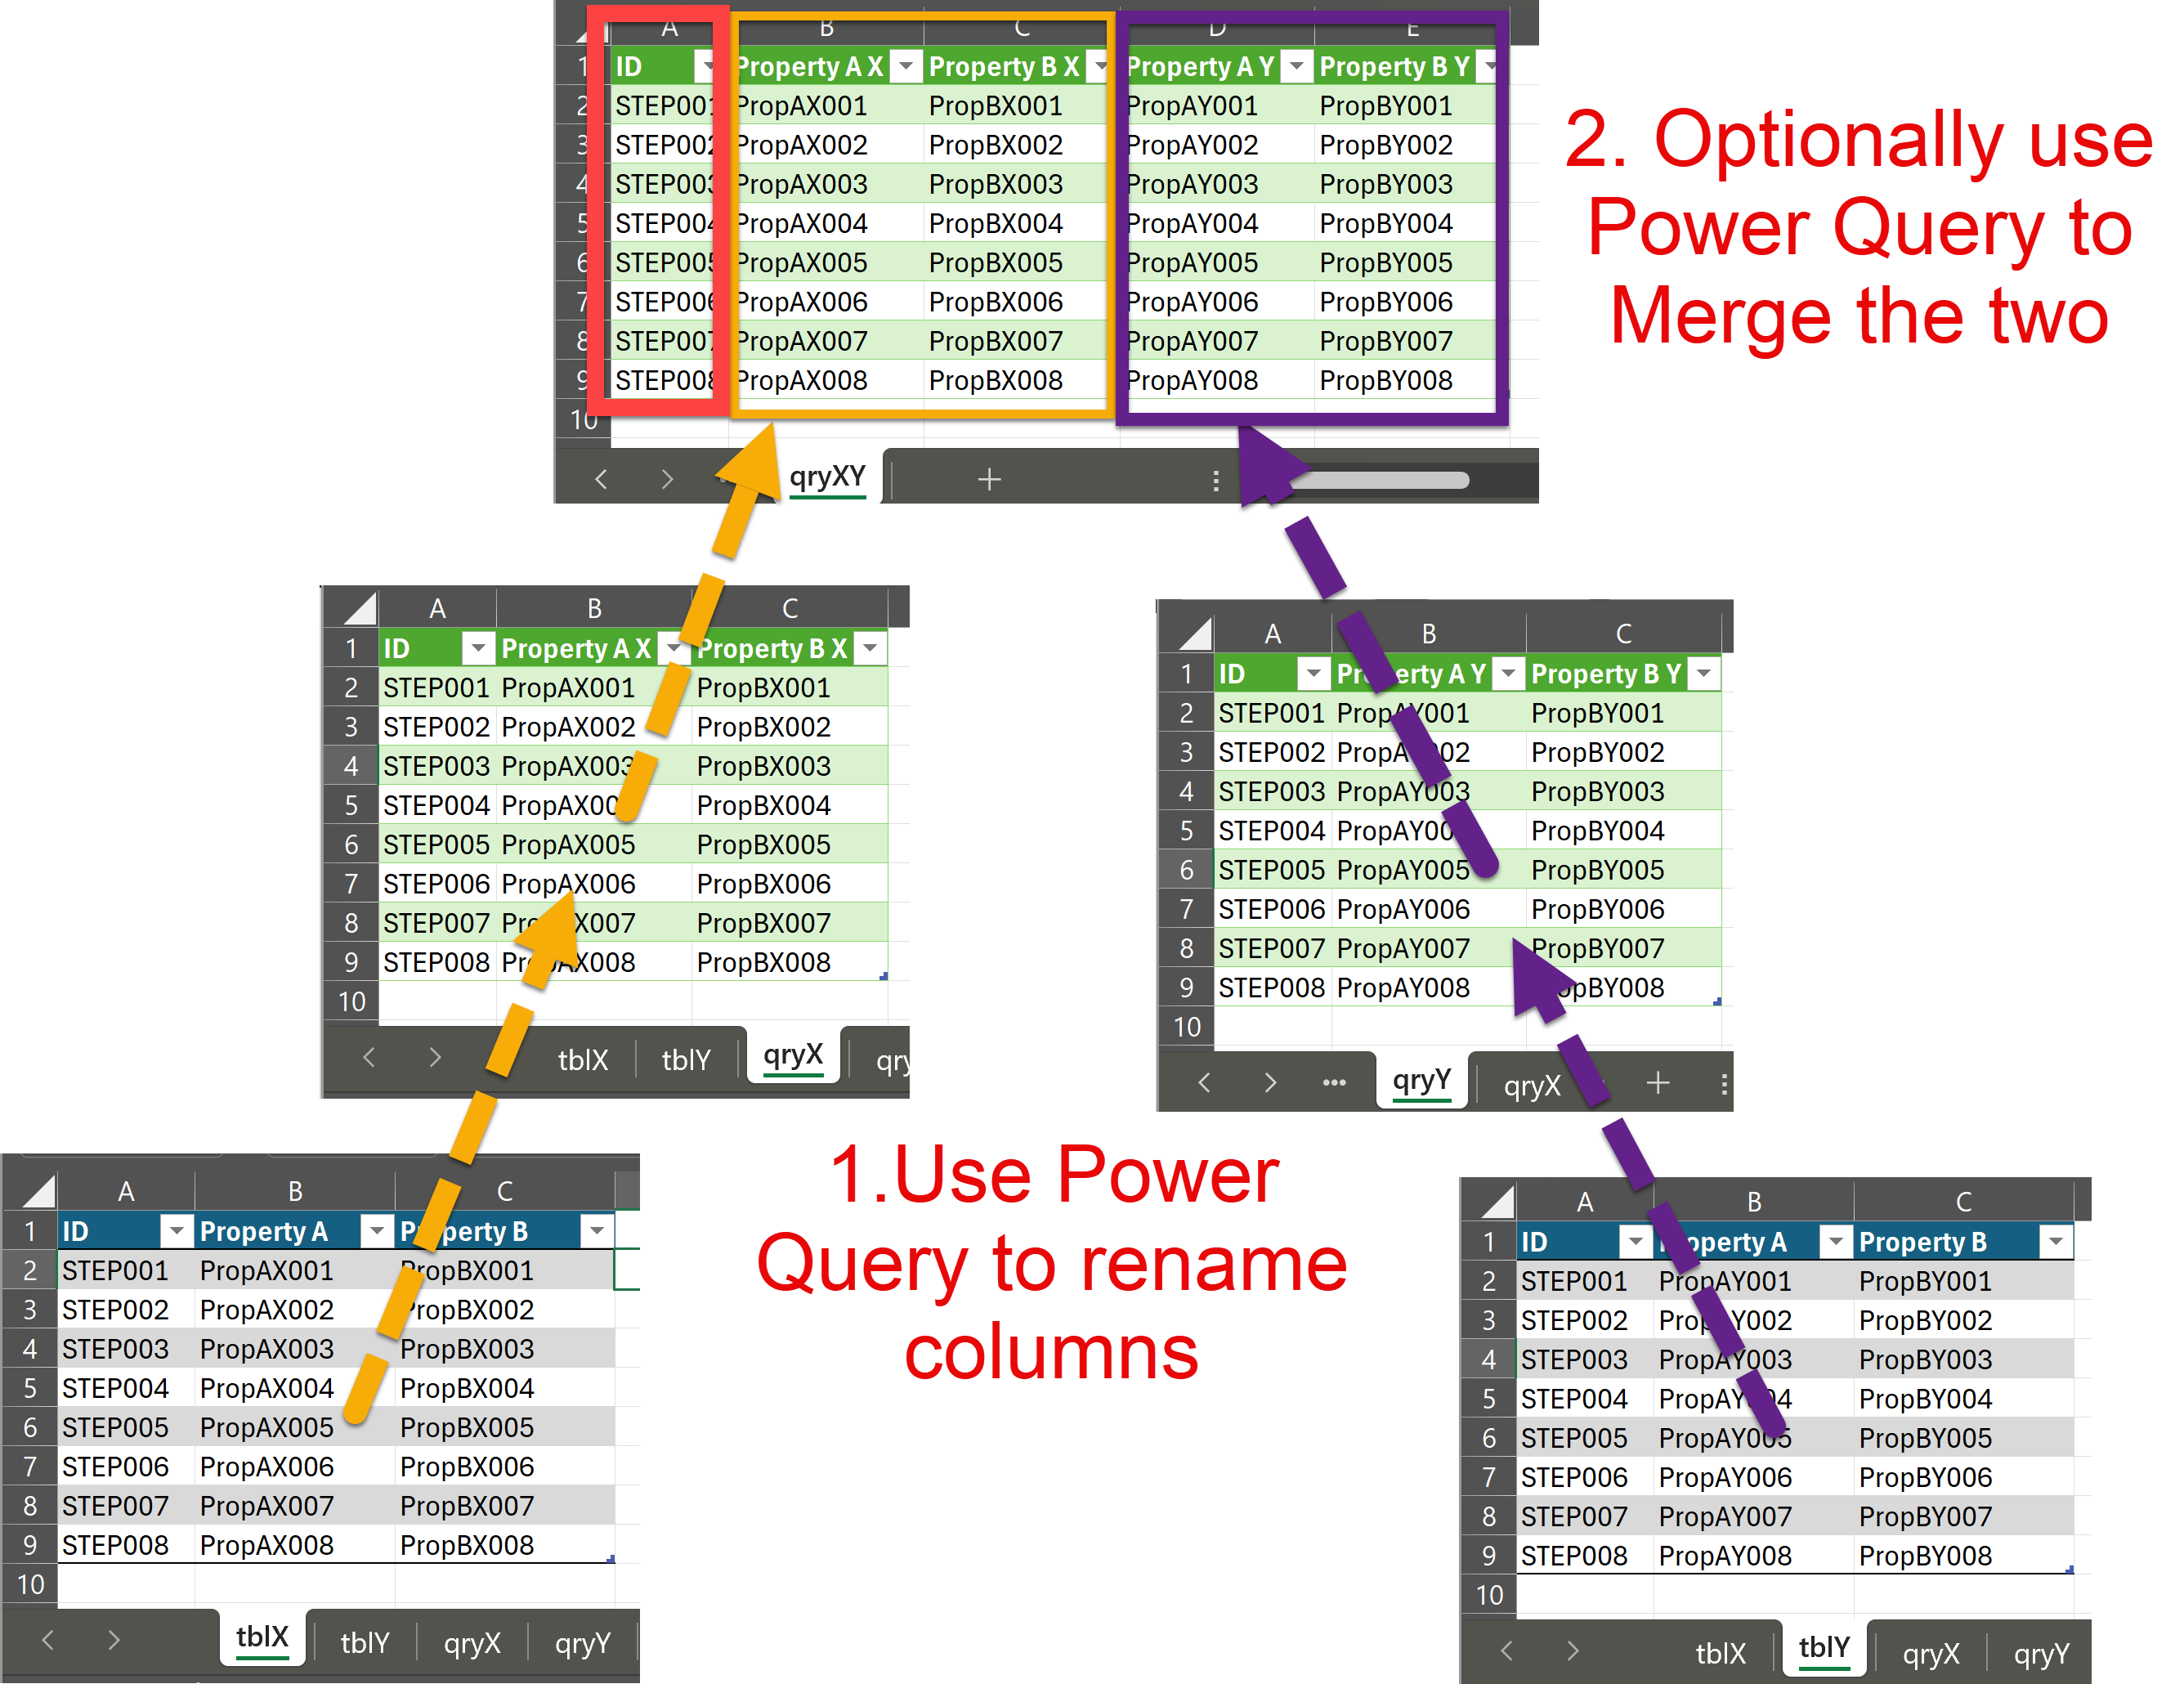
Merging Linked Data from Similar Tables
I was recently asked how to link data from different tables but with similar column names to Visio shapes. In this case, each table has the same unique identifier, but some of the column names are the same. The problem is that the data linking matches the column name with the label of a Shape…