

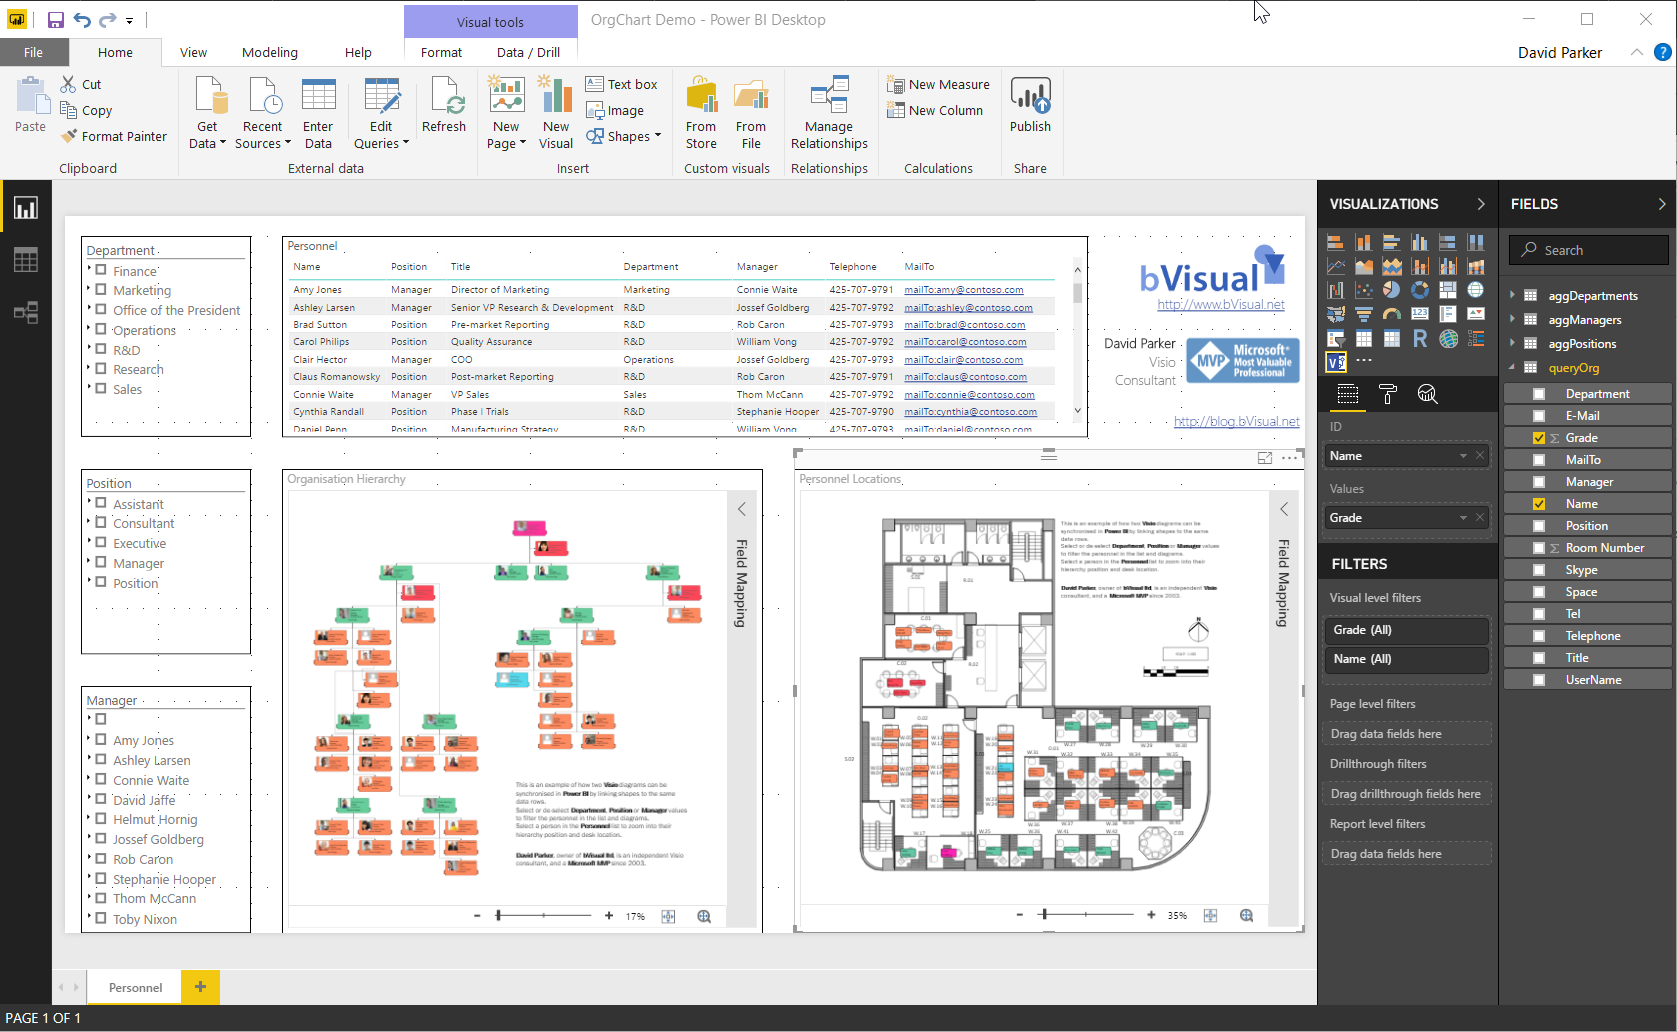
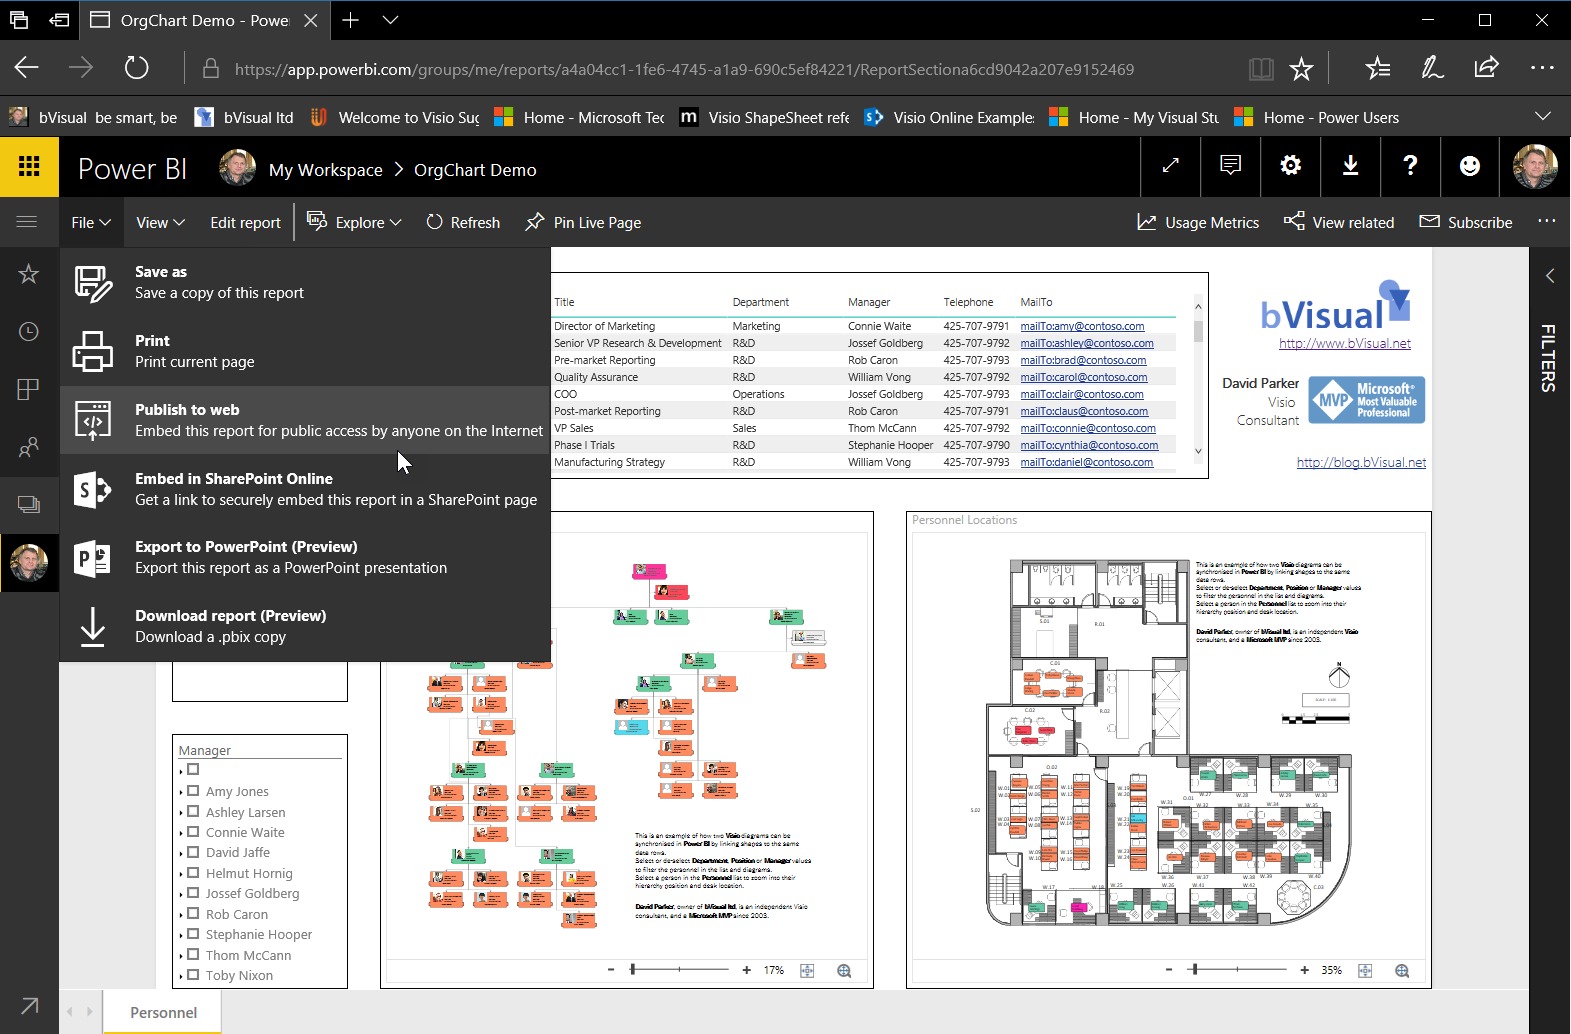
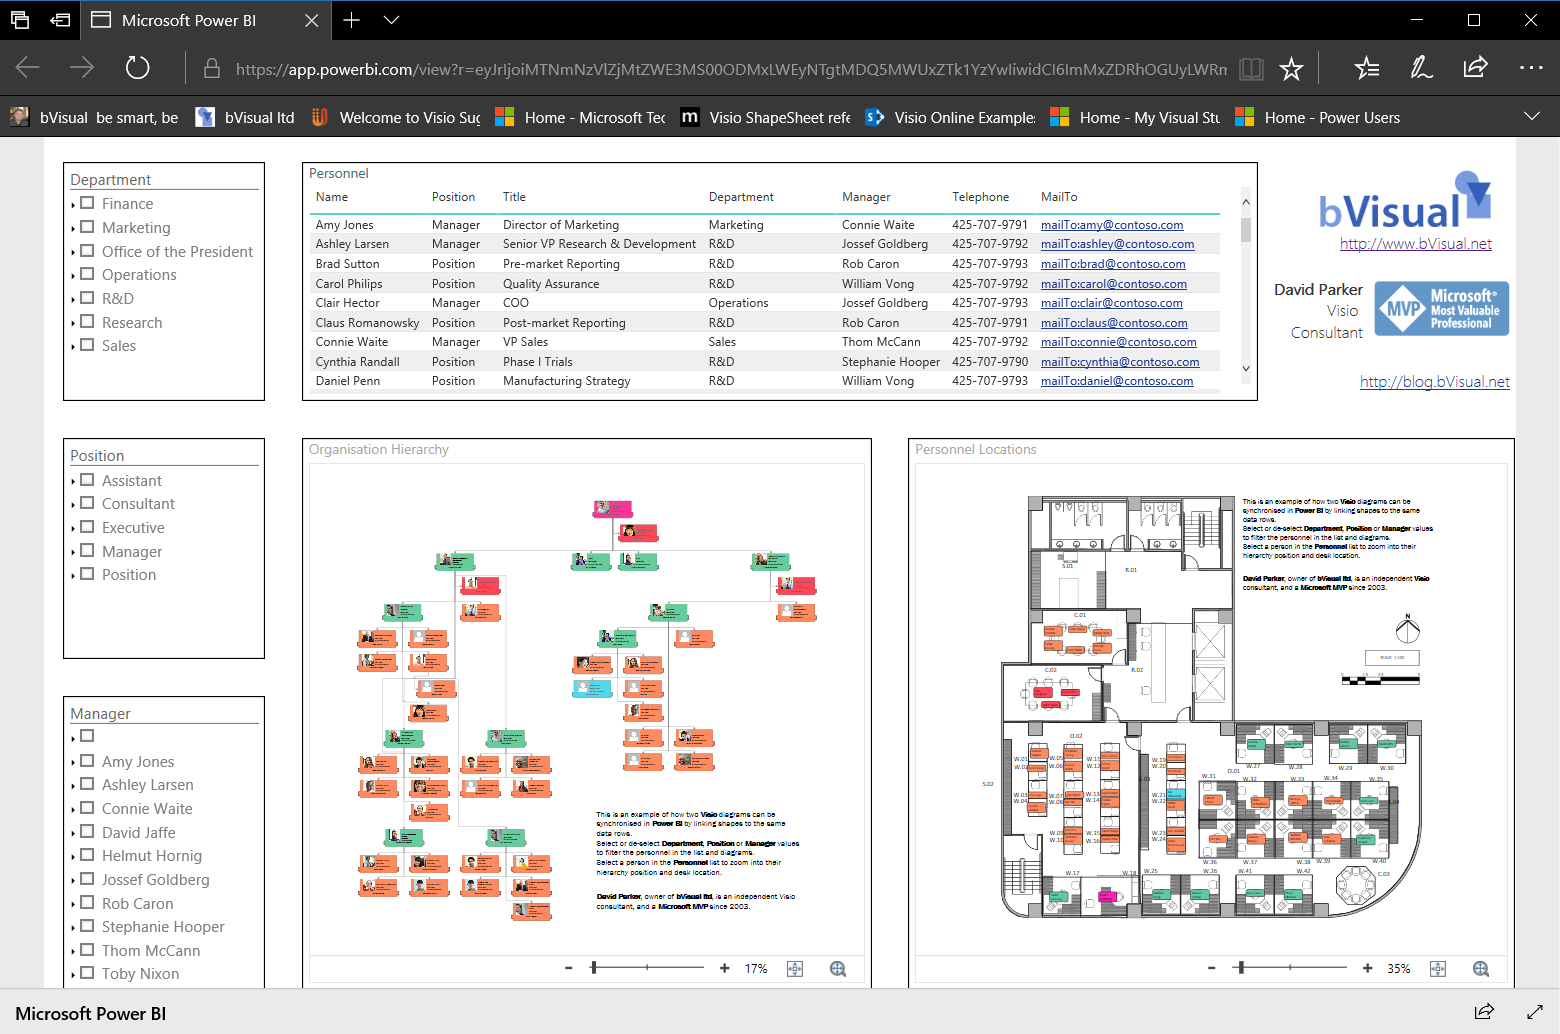
My last article, Aliasing Data Columns for #Visio Organization Chart Wizard , mentioned the slight anomalies in the default Shape Data rows for the Organization Chart shapes and the Resources / Person shape. This prompted me to create an alternative view of the same data that can be linked to the Person shapes on a floor plan, and then to use the preview Visio Custom Visual in Power BI to display both views of personnel synchronised by the same data. This demonstrates how easy it is to create an effective dashboard for locating personnel locations and their position within an organisational hierarchy at the same time!


View the Power BI report online : Org Chart and Personnel Locations in PowerBI
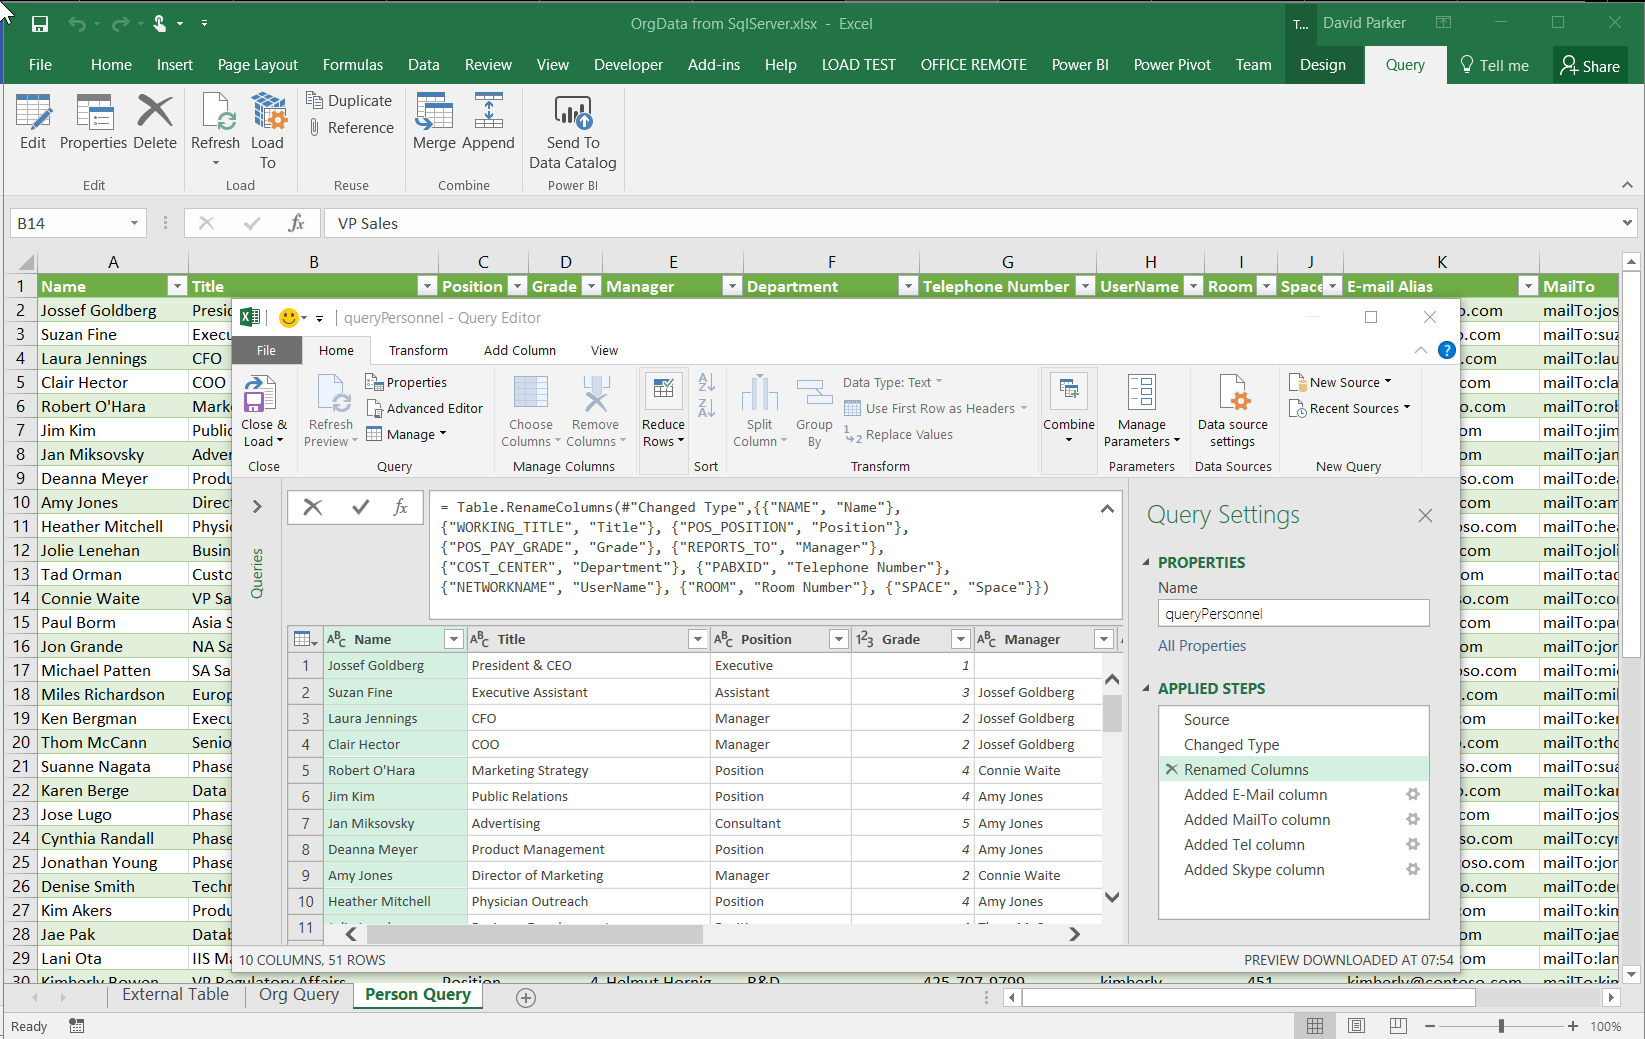
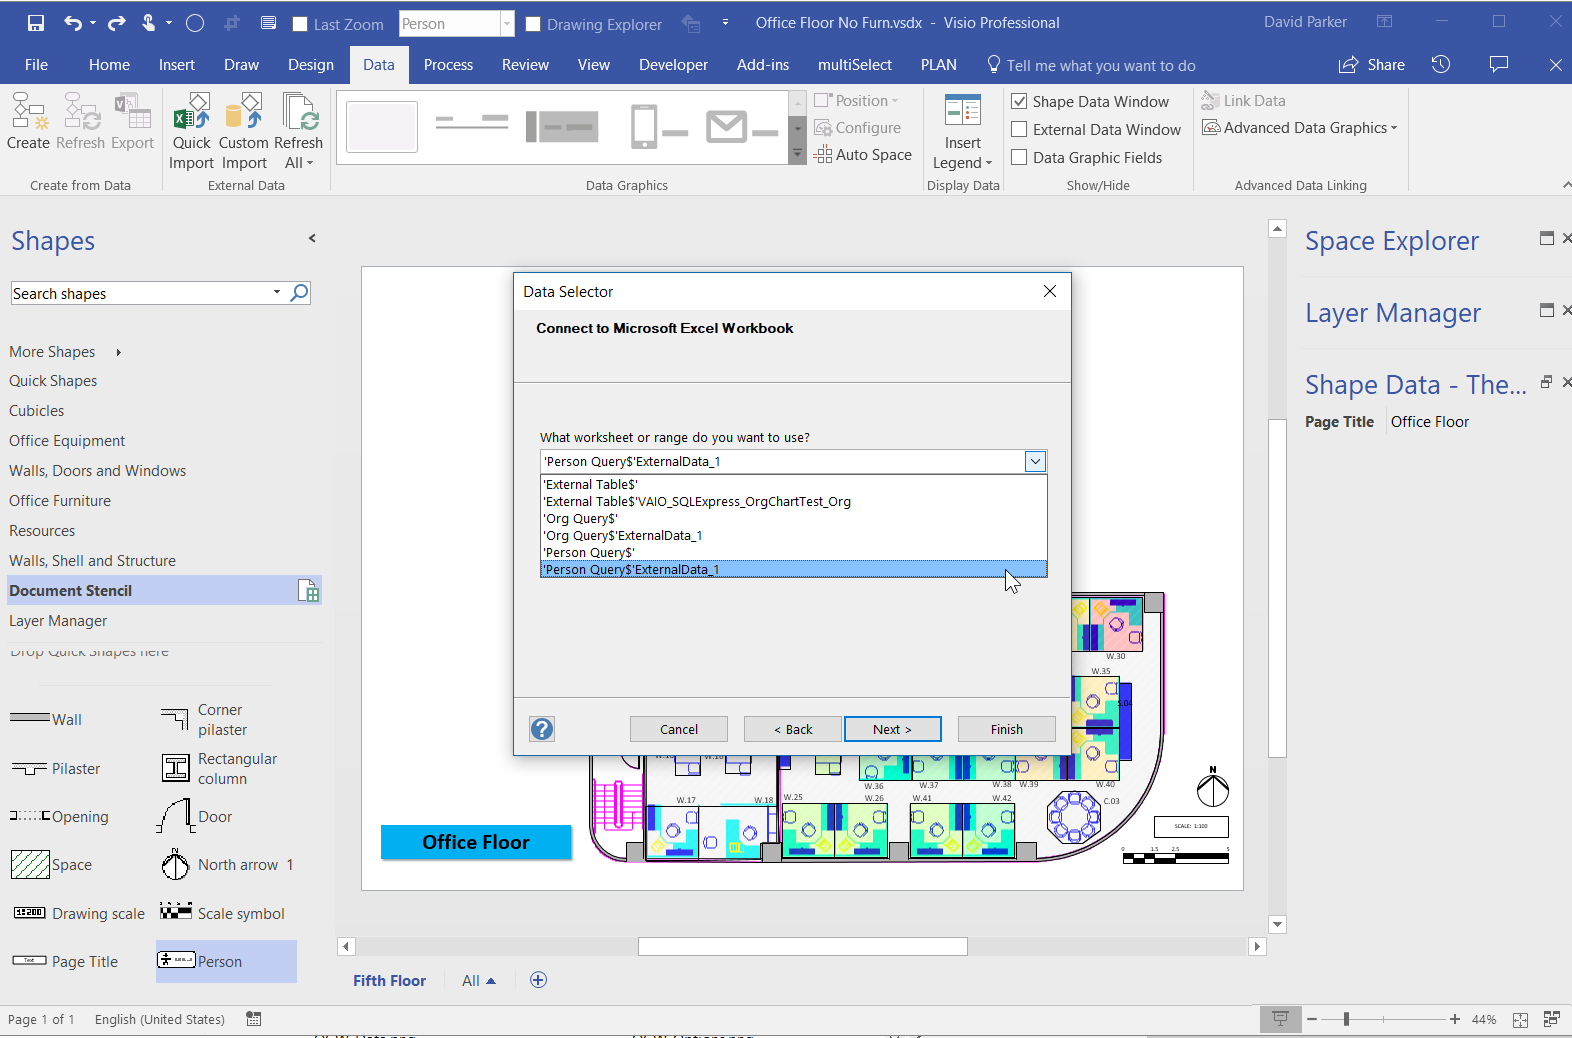
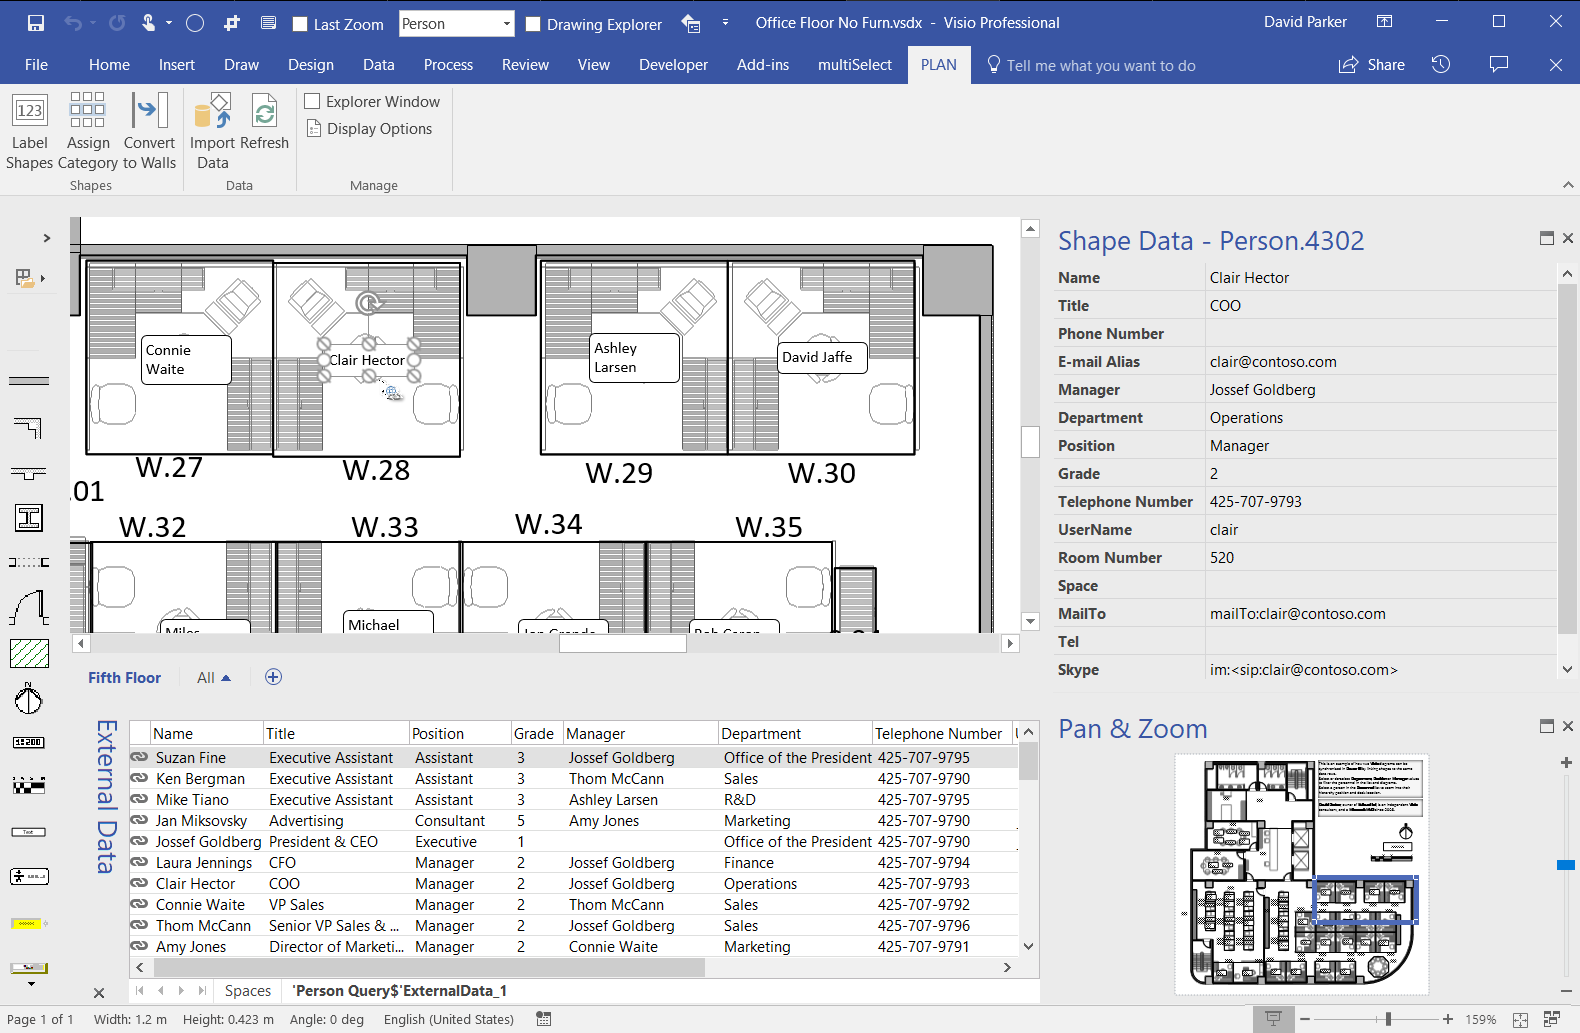
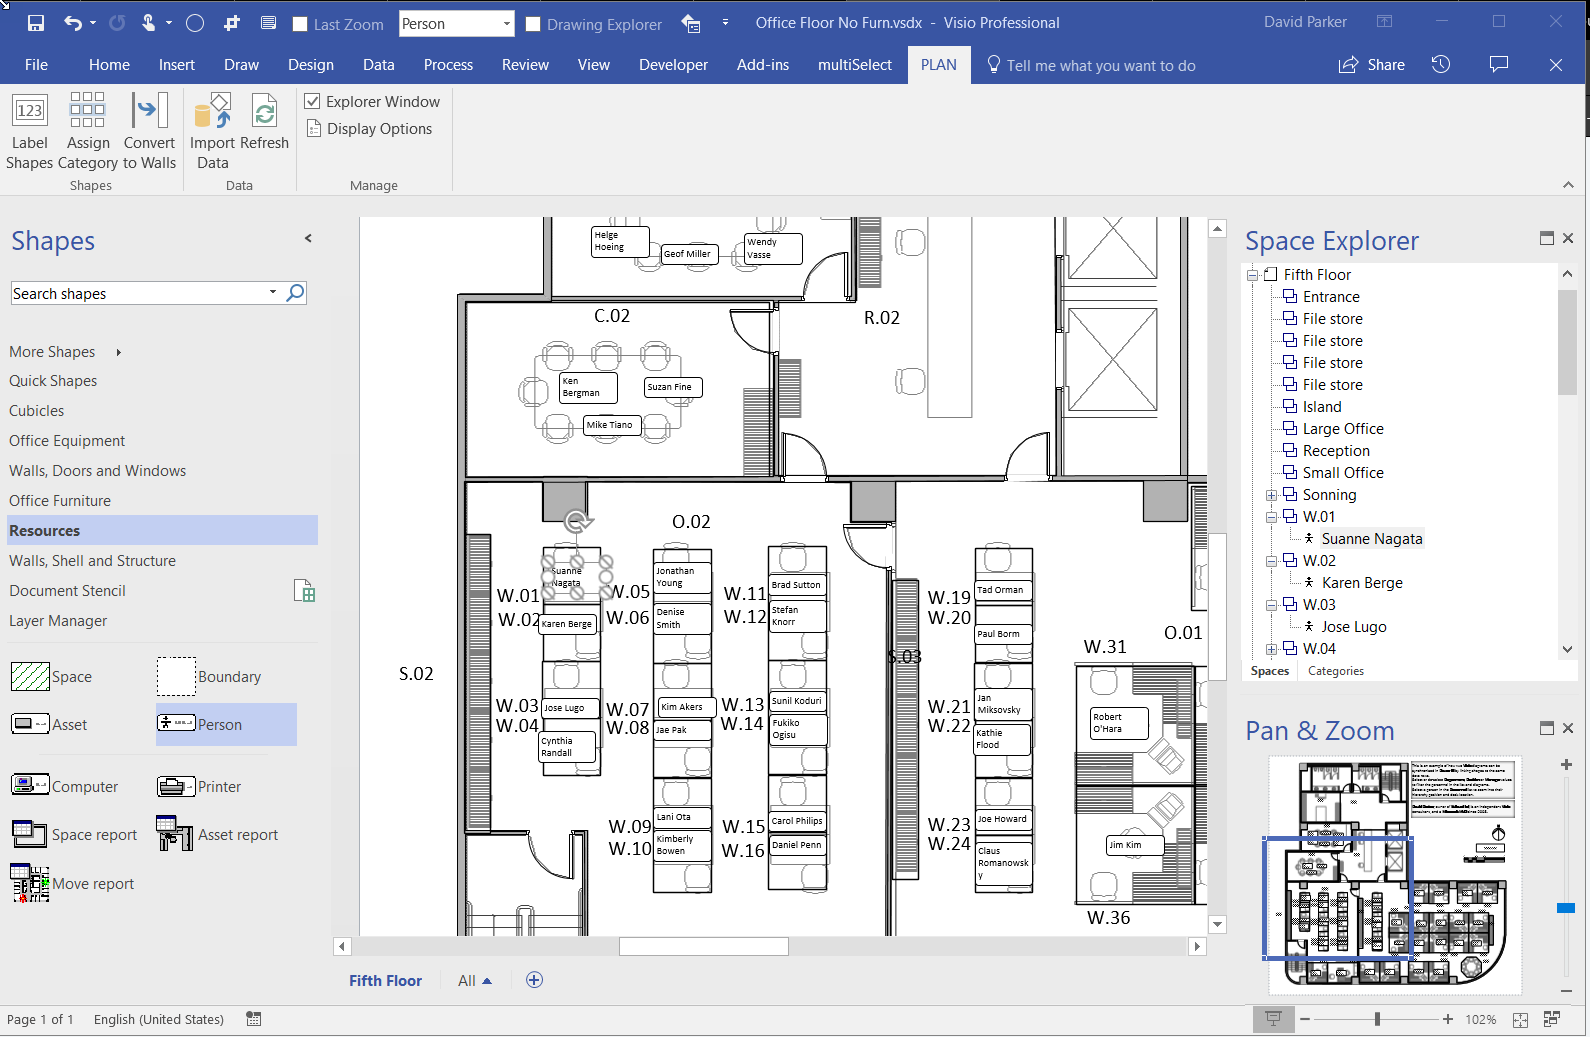
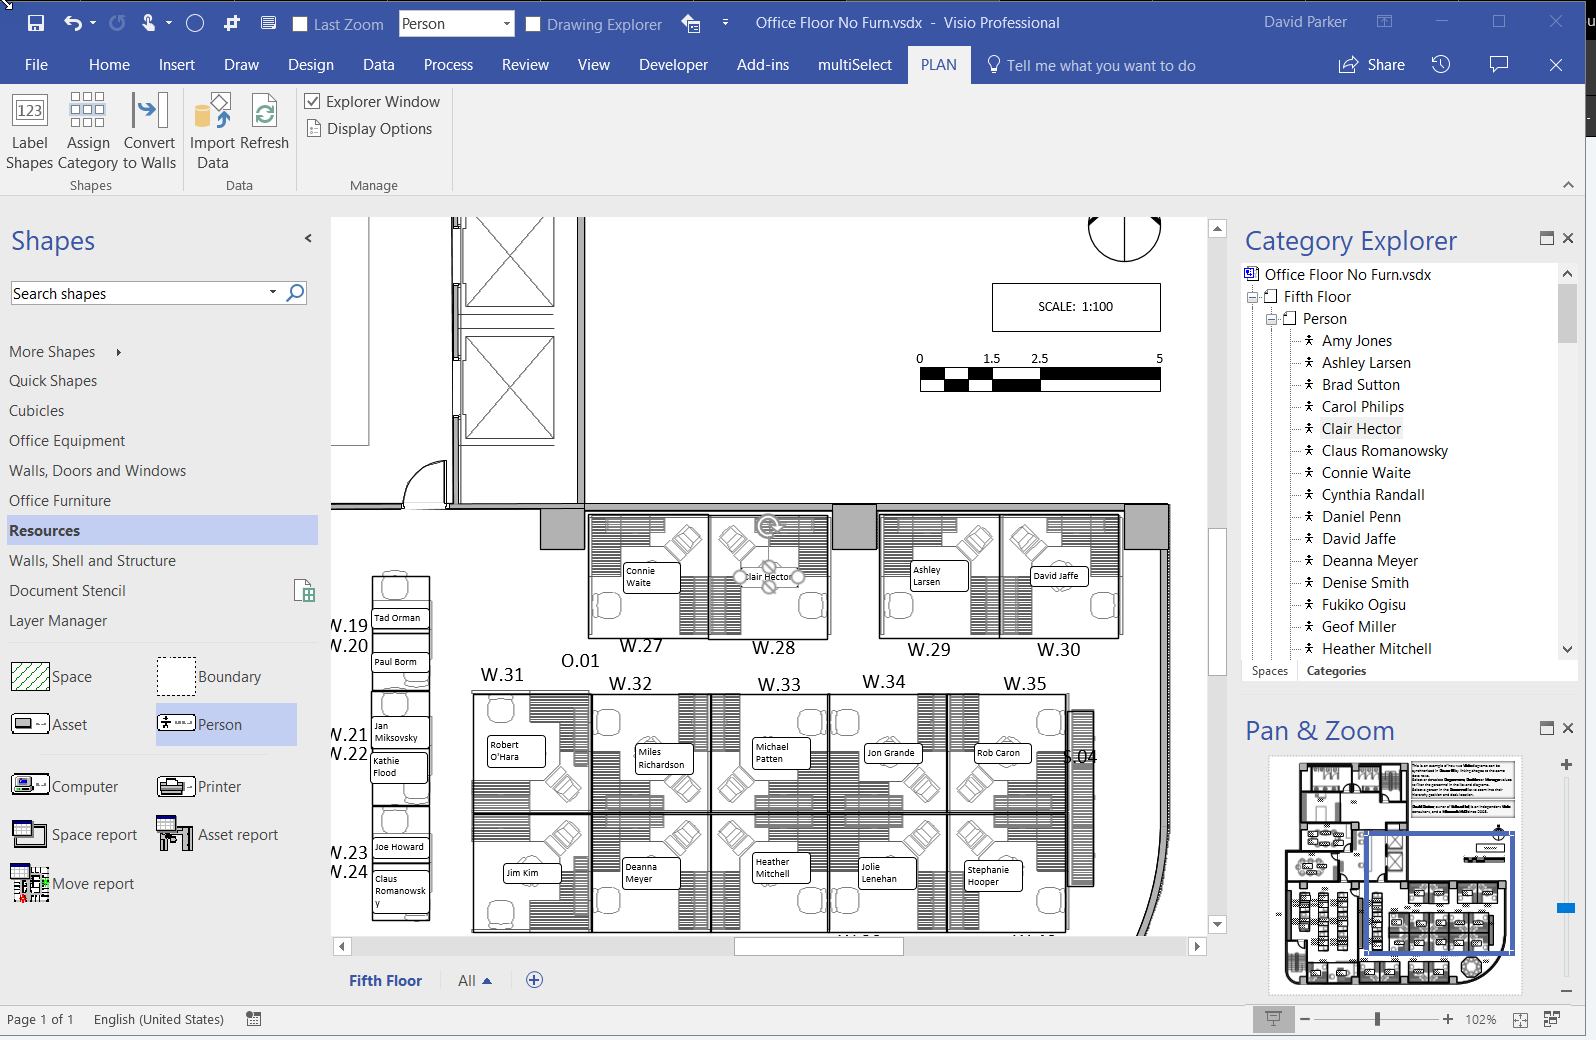
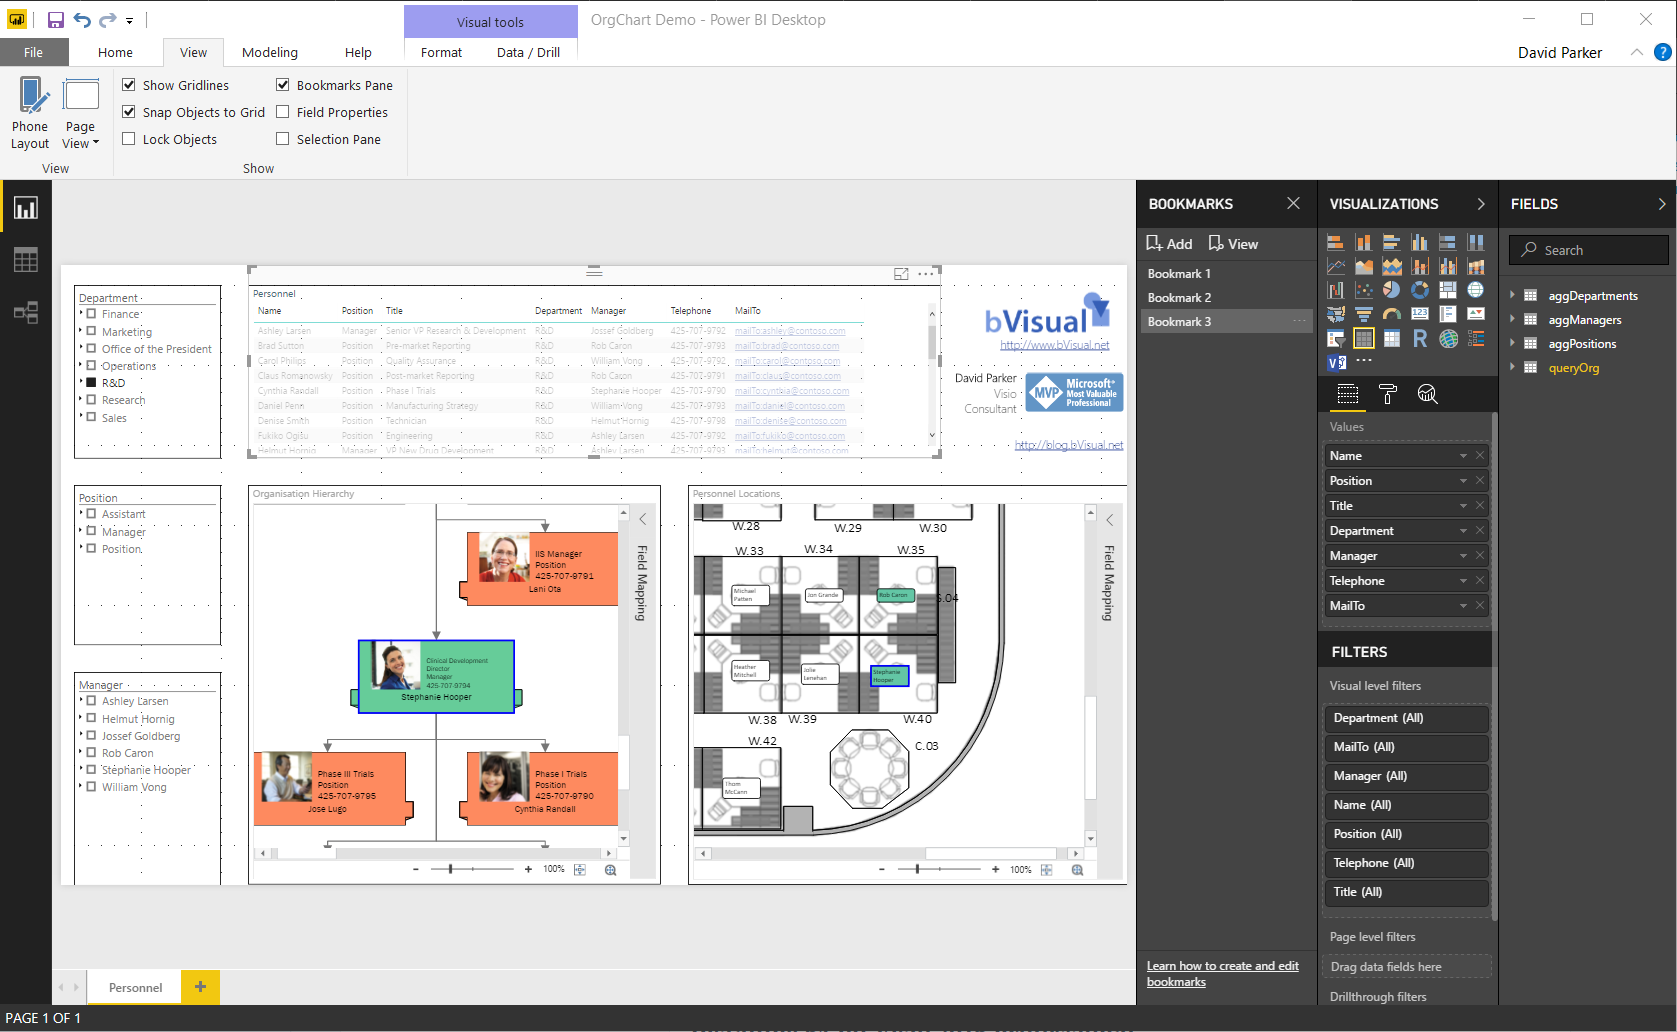
I duplicated the queryOrg in PowerQuery in Excel, as queryPersonnel, and slightly modified the naming of columns to match the Resources / Person master Shape Data row labels, as described in the previous article. I could then add data-linked Person shapes to the floor plan into the Space shapes that I had already added to it. These Space Plan add-on to Visio also includes Space and Category Explorer window which can be used to find a person by their name or by their location.
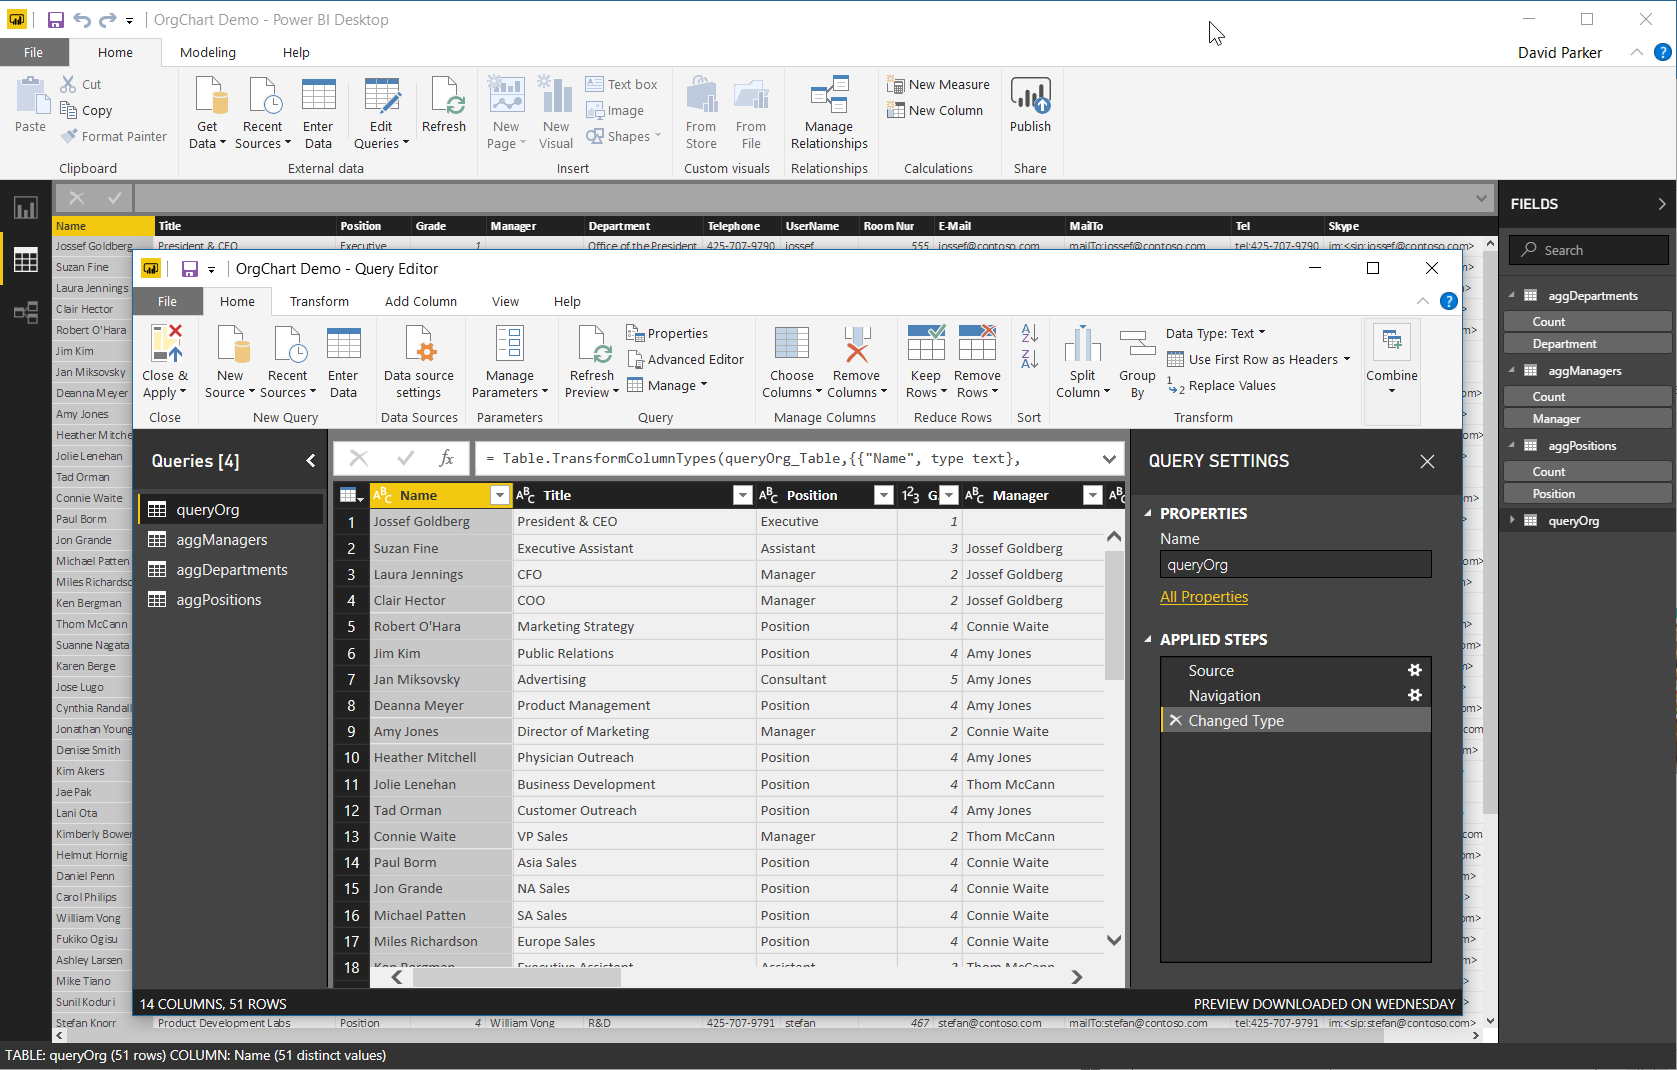
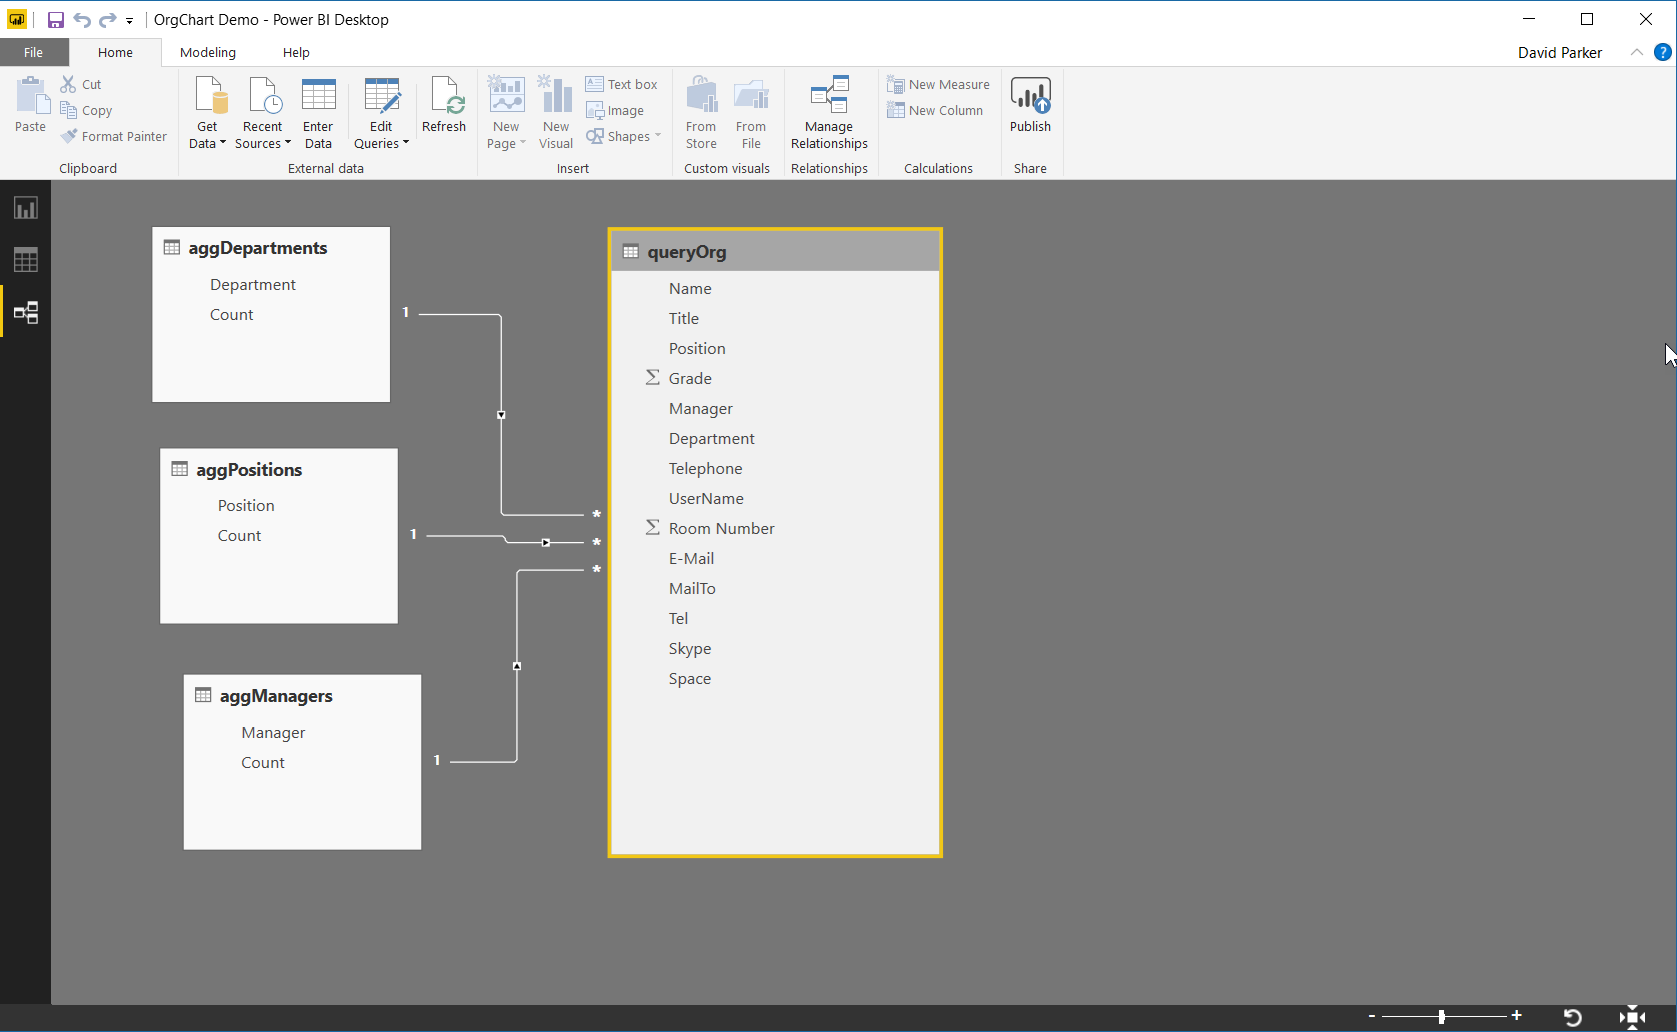
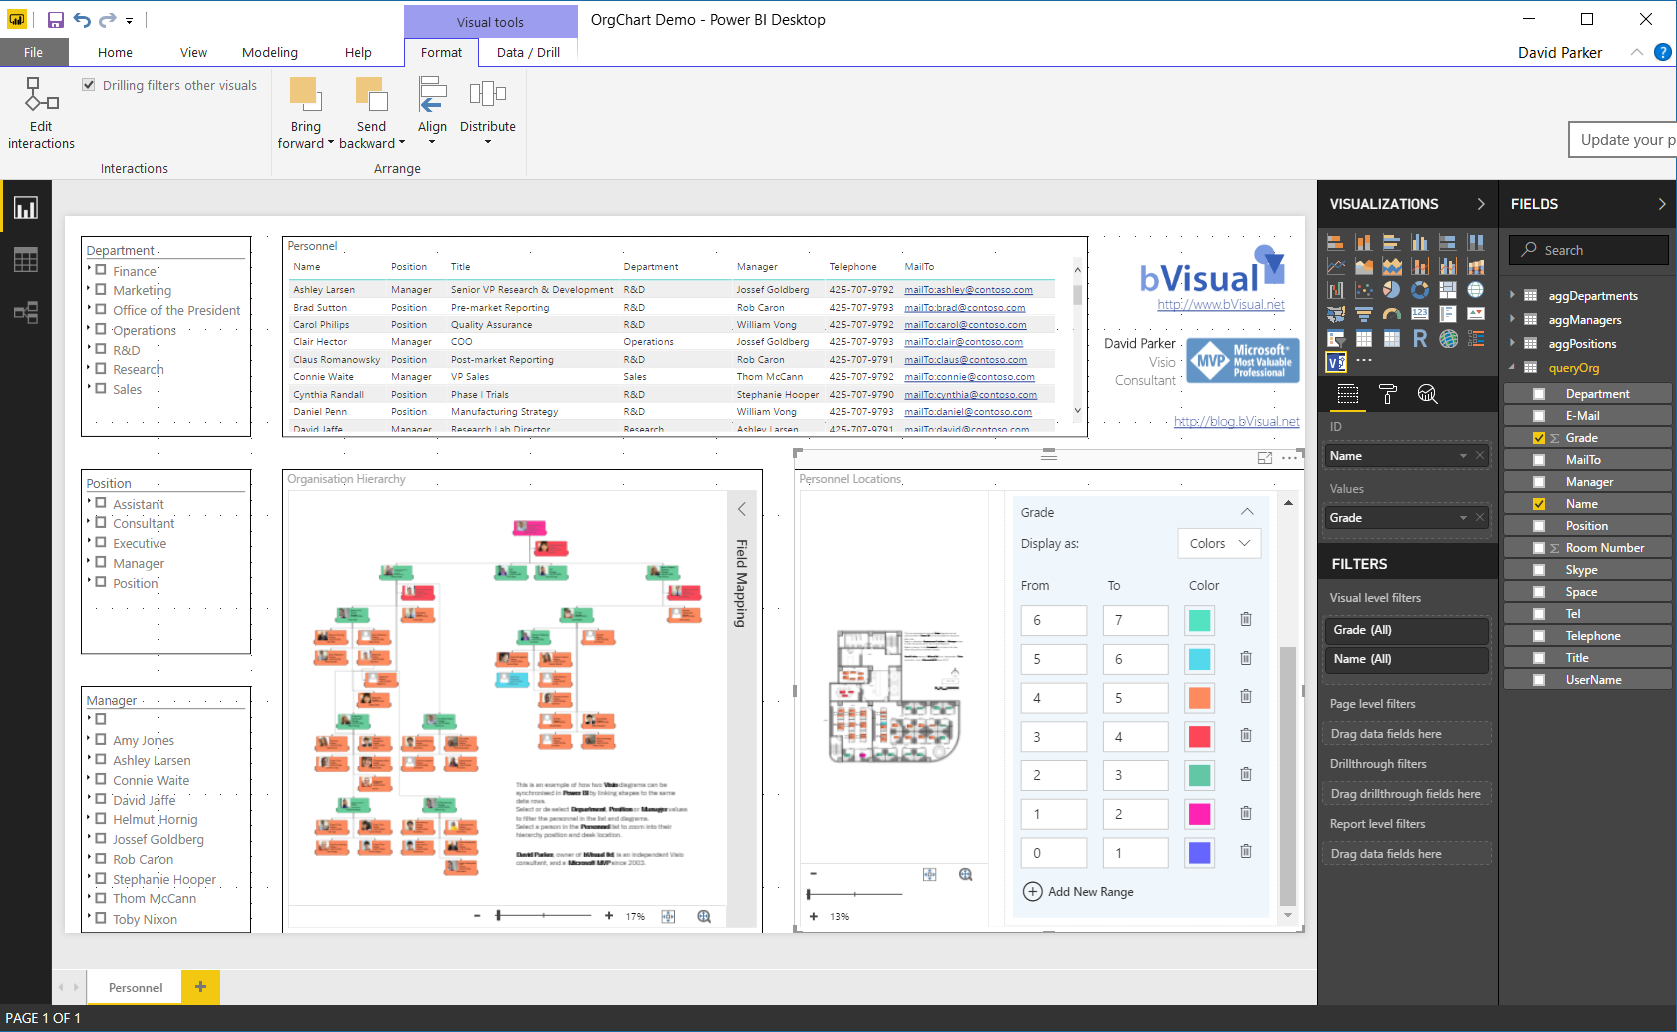
I used Power BI Desktop edition to get the queryOrg query from the Excel workbook, and created three aggregating queries for Department, Position and Manager. These were used to provide hierarchy slicers on the report.
I used the Visio Custom Visual and the Hierarchy Slicer from the Store in Power BI in addition to the standard Table visual.
I had to reduce the shape count on my office floor plan drawing, because the preview of the VisioCustom Visual for Power BI has a shape count limitation ( see Add Visio visualizations to Power BI reports for more information). This meant removing all of the furniture shapes that I has added over the top of the embedded CAD file. I also changed the color of the embedded CAD file layers to shades of grey, because I intended to use colors in Power BI. In fact, I grey-scaled all of the Visio shapes in the office plan and the organisation chart to provide greater contrast to the colors in Power BI. The embedded Visio Online visual in Power BI will automatically suppress and Data Graphics (Text Callouts, Icon Sets, Data Bars or Color by Value), but I removed them in the Visio file too because it must delay the display if Visio Online needs to hide them.


One key learning point for me is that the preparation of a Visio file for consumption by Power BI is different than that for printing or normal online viewing.
Related articles:
Aliasing Data Columns for Visio Organization Chart Wizard
Adding clicks to infographics with Visio visual for PowerBI
Visio custom visual preview for PowerBI available for all!