


I had an enquiry recently about displaying Organisation Charts with text in different languages. This set me thinking, and, if you have Visio Professional, then you can use Link Data to Shapes to add this capability to existing diagrams, but Visio Standard users can just the Org Chart Wizard.
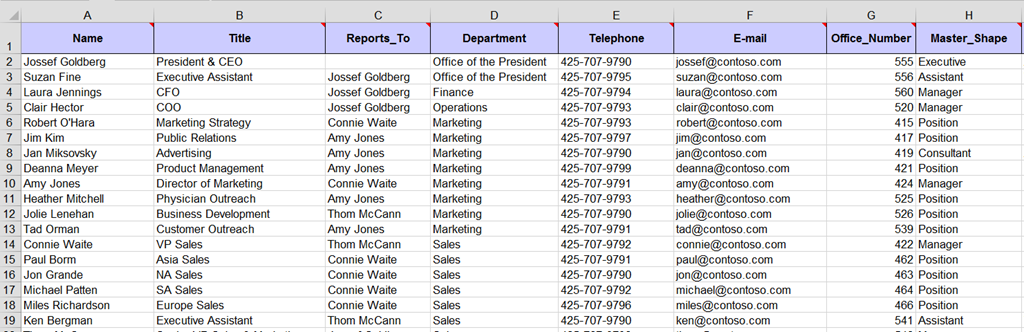
I will use the OrgData.xls file that is provided in the <Program Files>\Microsoft Office\Office 15\Visio Content\<LCID>\ folder to demonstrate this. I have English US (1033) and Norwegian Bokmal (1044) available to me, as shown below:
In Englsih
In Norwegian:
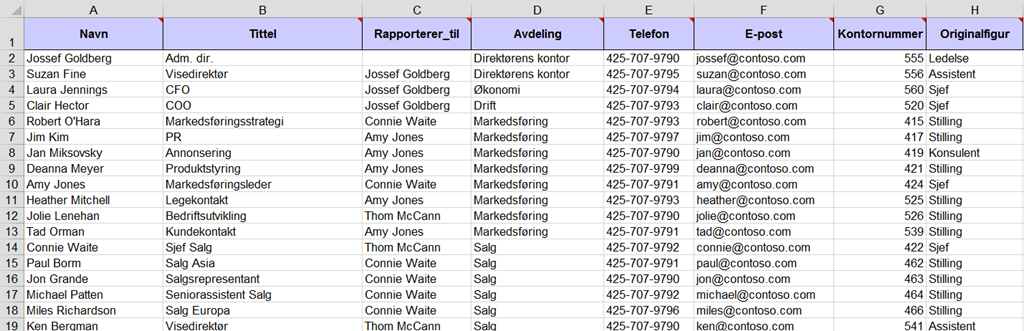
As my Visio installation is in English, I need to use the column headings in the English work book for matching with the Shape Data labels, so I copied the Tittel, Avdeling, and Originalfigur columns from the Norwegian and appended to the English one, before saving the Excel workbook.
Using the Org Chart Wizard
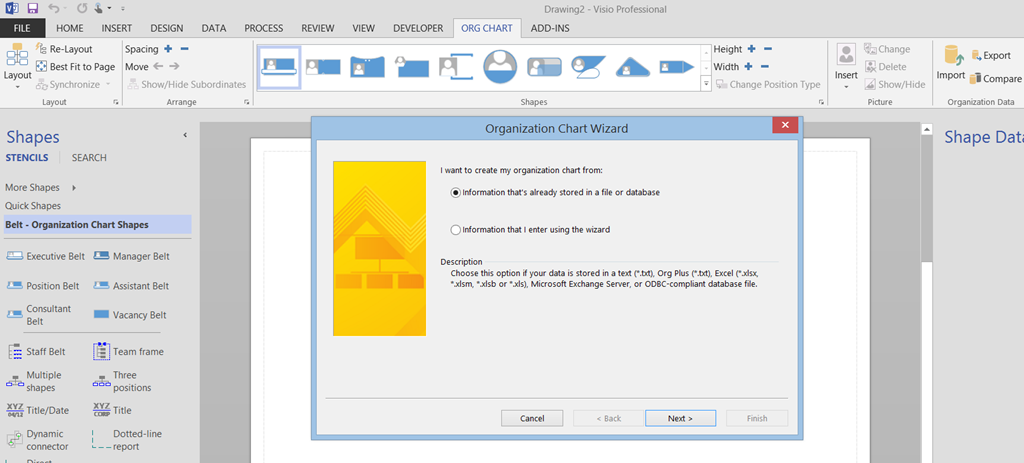
I can then use the Org Chart Import wizard to create a new Org Chart from the Excel table:I c
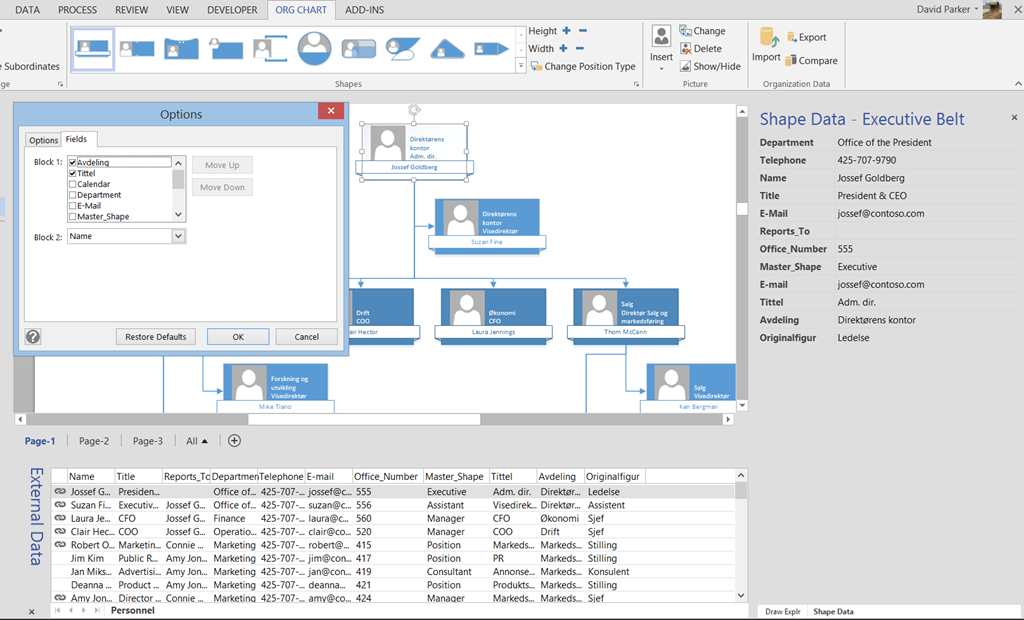
I can use the English column headings to match the Name and Reports_To fields, and choose to display just the Name and Title fields for now, but add all of the other columns as Shape Data fields.


This will create me an organisation chart with shapes that contain all of the text I need.

I can then change which field text is displayed in the blocks by opening the Options dialog from the little button (highlighted with a pink circle). This change will apply to all Org Chart shapes on all pages.

Using Link Data to Shapes
If I had already created an org. chart without the extra language fields, then that is also no problem if I have Visio Professional, because I can use the Link Data to Shapes function to add them.
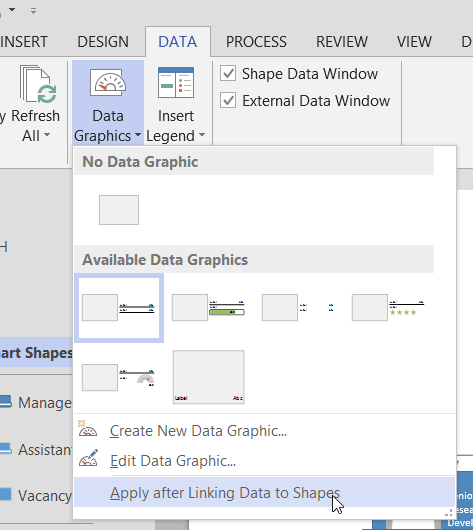
Firstly, I uncheck the Apply after Linking Data to Shapes option from the DATA \ Data Graphics dropdown menu, if I do not want Data Graphics to be automatically added to each shape.
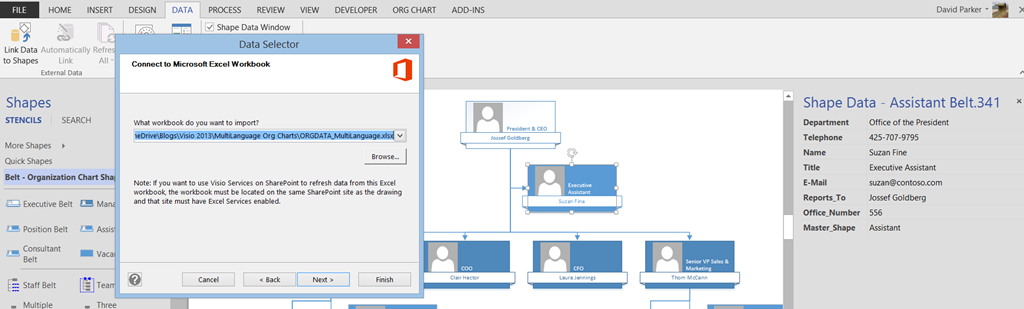
Then I select the Excel workbook that contains my data. In fact, I really only need to have the key column (Name) and the extra columns I want, but I included them all in my example. This means that I will be able to refresh these values on the shapes automatically when I change them in the Excel workbook.
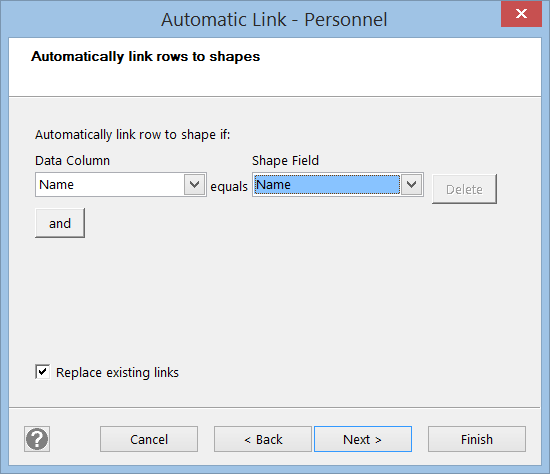
I then need to select the columns that uniquely identify the row in the table.

Then I need to ensure that it applies to all shapes on the page.
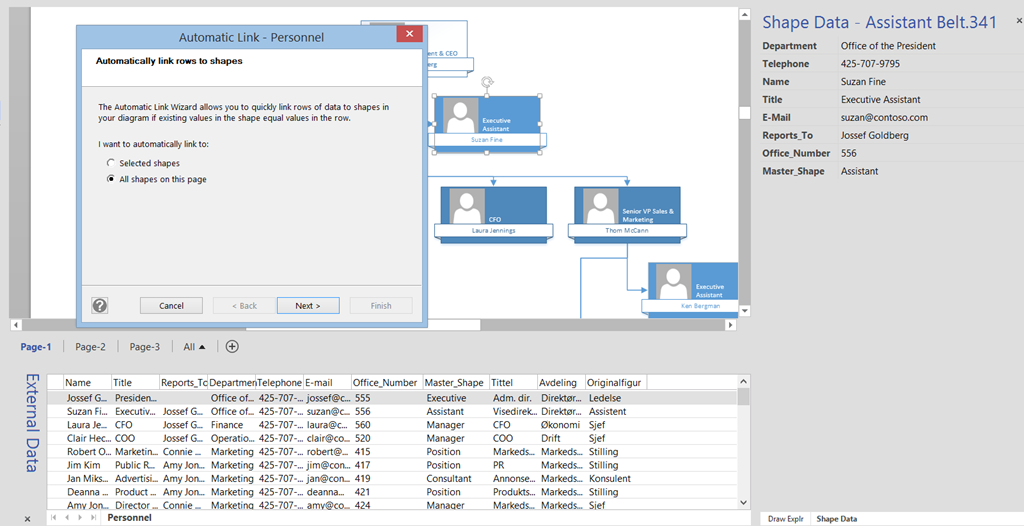
Their needs to be at least one column that can match a shape field value in order for the shapes on the page to be automatically linked.
The only drawback of the Link Data to Shapes method is that it needs to be repeated for each page, but that could easily be automated with a macro.
Once the extra fields exist on the shapes, then I can use the Options dialog, just like before:

Using Data Graphics
Finally, I can use Data Graphics to add interest, as I did with Color By Value for Adveling below. I could just as easily have used the English alternative, Department, and thus used the Insert Legend with that field.
