


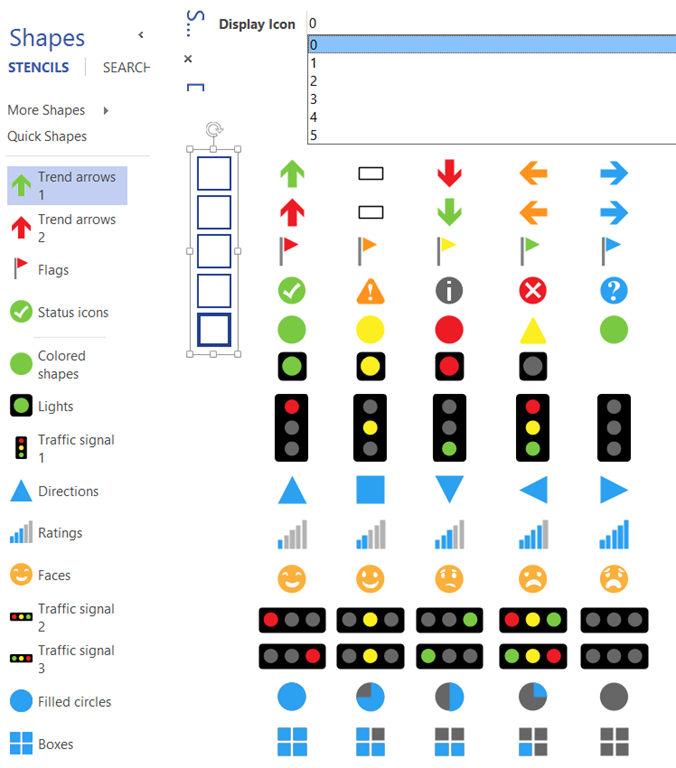
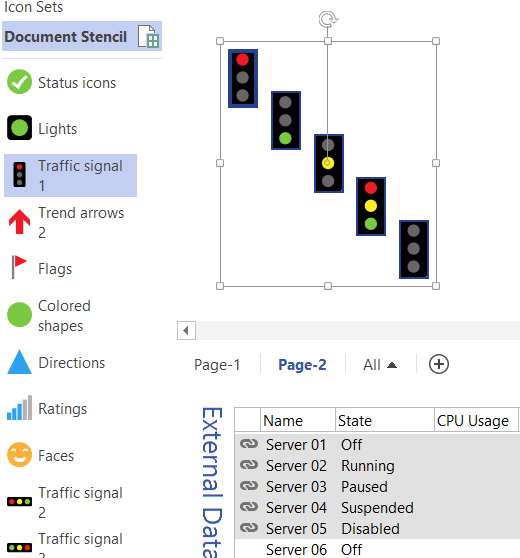
A reader of my blog recently asked whether it is possible to use the icons in out-of-the-box Visio as the main shape, and get it to refresh with data. I pointed out that all of the icon sets are available in a handy stencil under Visio Extras, so all that remains is to make the icon display change according to data values.

If we look closer at the master shapes on this stencil, then we find that they all have a Fixed List data type Shape Data row labelled “Display Icon”, with the exception of the Filled circles master shape which has a Shape Data row labelled “Data Icon” – surely this was a mistake by Microsoft. The Fixed List is allows you to choose between 0 to 5, ”, with the exception of the Lights master shape which has a Shape Data row which has only for 0 to 4. The 0 value in each case, effectively makes the shape invisible, therefore, all but one has 5 different appearances.
Now, when we link data to shapes, Shape Data rows are automatically added to the shape, labelled the same as the field name, and with a name derived from it, starting with a “_VisDM_” prefix, and with spaces and special characters suitably replaced.
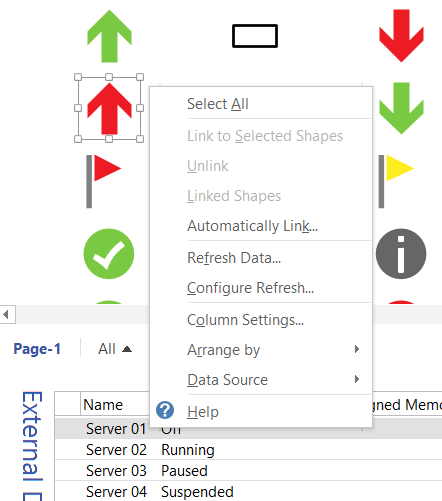
Well, that is what is supposed to happen, but when I tried to link data to one of these shapes, I discovered that The “Link to Selected Shapes” right mouse menu option was disabled.
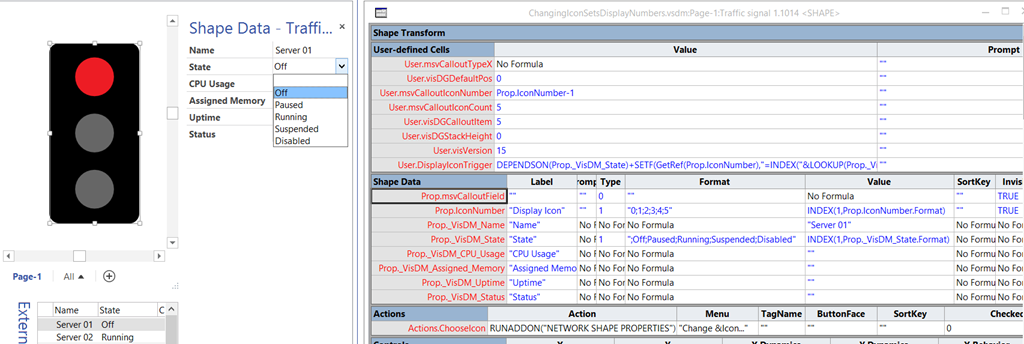
So, I investigated, and found that it was because of a special User-Defined Cell called User.msvCalloutType exists in the ShapeSheet of the shape. In fact, there are a few of them that were added to control its behaviour as a data graphic item.
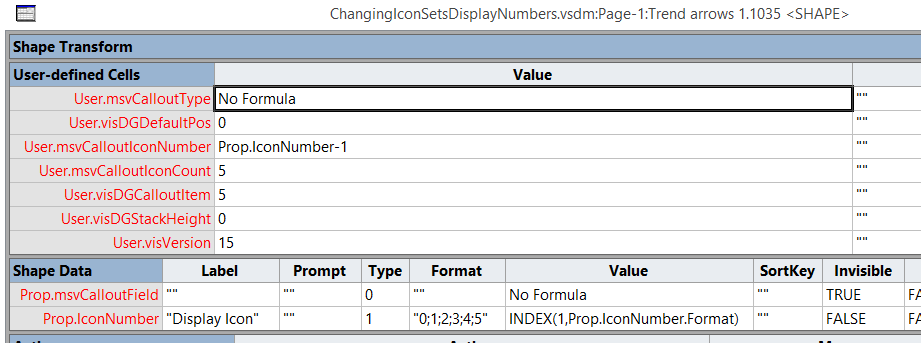
Simply changing the name of User.msvCalloutType to, say, User.msvCalloutTypeX is enough to enable the “Link to Selected Shapes” menu option.

Note that the User-defined Cells values have all turned blue. This is because the whole section is now local, rather than inherited.
Next, when I link a row of data from the External Data window, Visio adds the new Shape Data rows, and they also turn blue because the whole section is now local.
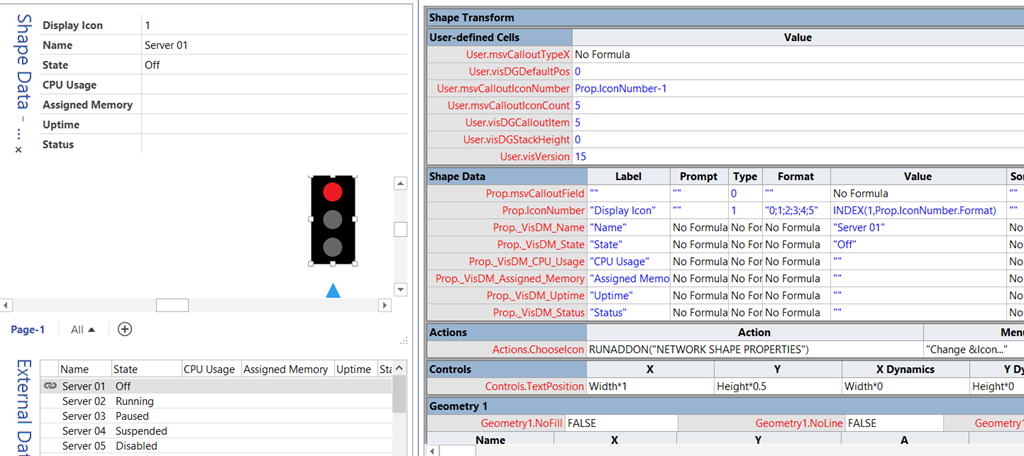
Now, I need to decide which of the possible State values (Off, Running, Paused, Suspended, Disabled) are best represented by the values of the Display Icon Shape Data row, which are displayed from 0 (invisible) to 5 (three grey lights) below:

So, let’s say I think that these graphics are best to represent Empty, Off, Paused, Running, Suspended, Disabled then I do the following:
Edit the Prop._VisDM_State.Type cell to 1 which is (Fixed List)
Edit the Prop._VisDM_State.Format cell to “;Off;Paused;Running;Suspended;Disabled”
Insert a new User-defined cell named DisplayIconTrigger
Edit the User.DisplayIconTrigger.Value cell to =DEPENDSON(Prop._VisDM_State)+SETF(GetRef(Prop.IconNumber),”=INDEX(“&LOOKUP(Prop._VisDM_State,Prop._VisDM_State.Format)&”,Prop.IconNumber.Format)”)
This means that the value of the Display Icon Shape Data row will be set to the same index as the value of the State Shape Data row.
Edit the Prop.IconNumber.Invisible cell to TRUE because it is no longer necessary to see it.
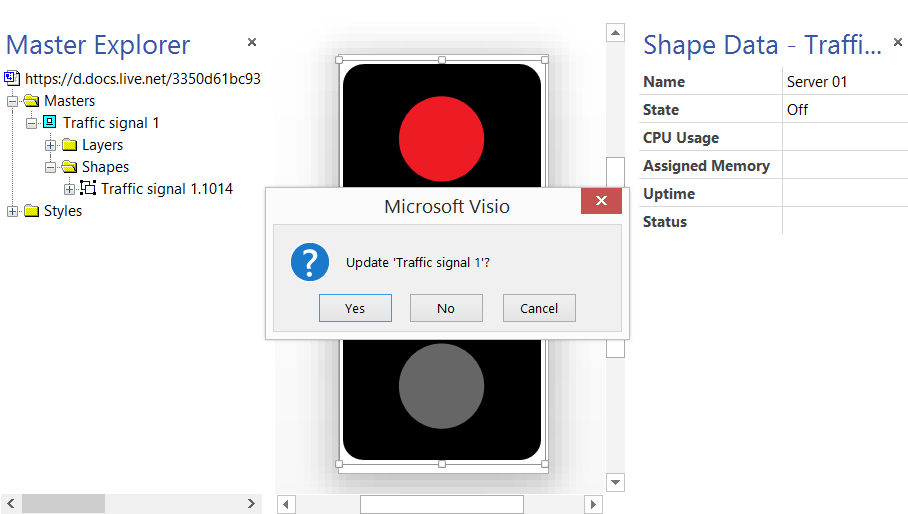
The shape is now ready to placed into a stencil as a master, or, if you want to update the original master in the same document then:
Ensure that this is the only instance of the chosen master (in this case Traffic signal 1), then Cut it (Ctrl+X).
Open the master Traffic signal 1 in the Document stencil for edit
Delete the old shape
Paste the new shape from the clipboard (Ctrl+C).
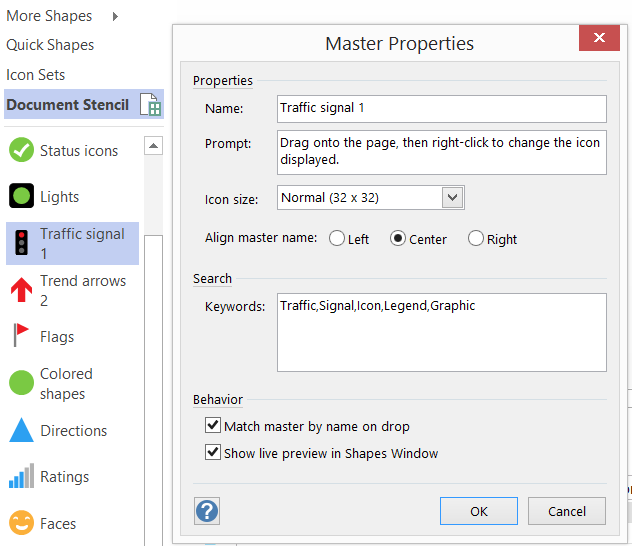
Edit the Master Properties by ticking Match master by name on drop – this ensures that my new version of the master will be used in this document, even if the Traffic signal 1 shape is dragged and dropped from the Icon Sets stencil.
I now have a Traffic signal 1 master that can be linked to data so that the State Shape Data value will change the display accordingly.
It took a long longer to write up than do!