


Microsoft Visio 2007 introduced PivotDiagrams to Visio Professional, and continues unchanged in Visio 2010 (see http://office.microsoft.com/en-us/visio-help/create-a-pivotdiagram-HA010357089.aspx ). These diagrams are a great way to analyse and visualize data by allowing you to breakdown data in a similar manner to PivotTables and PivotCharts in Excel. Any one who has both Microsoft Project and Visio installed will have seen that all of the extra diagram reports are in fact Visio PivotDiagrams. However, I have always found that selecting the nodes you want is difficult. In this article I will explain the problem and provide a solution … a new free add-in called PdSelect.
Update : Added new features 20 Jul 2012
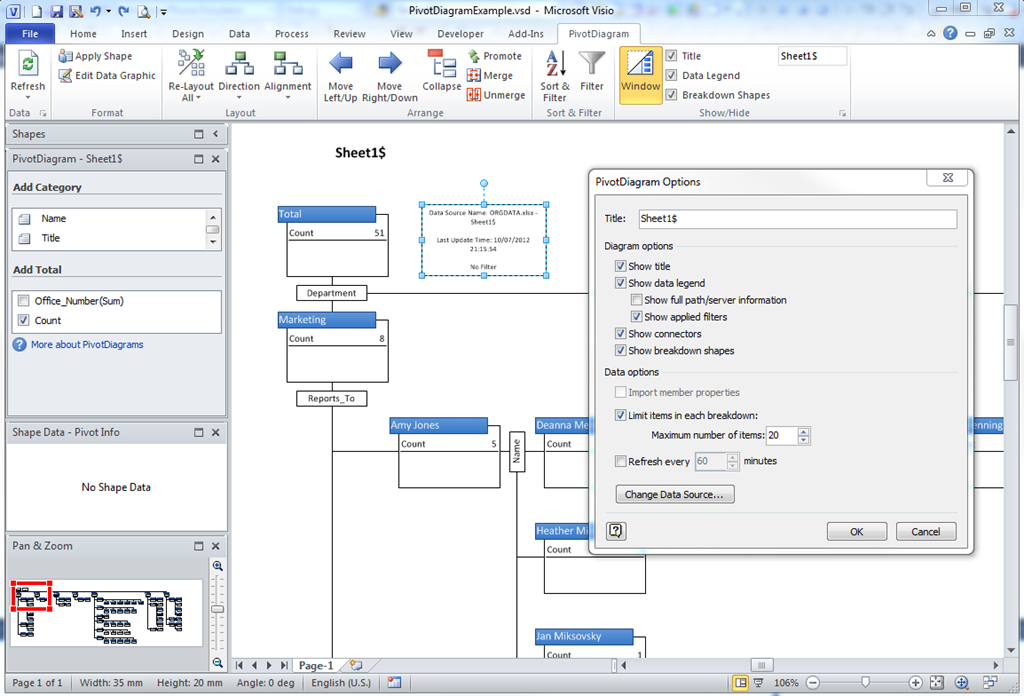
In the following example PivotDiagram, I used the built-in OrgData Excel workbook as the data source. This example workbook is normally used to demonstrate the OrgChart Wizard, but I have used it to provide an alternative breakdown by Department / Reports_To / Name.
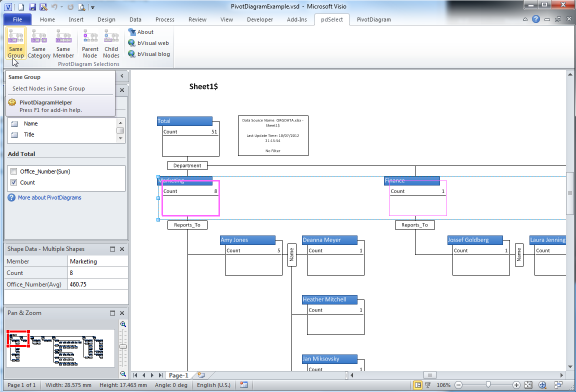
Now, let’s say that I want to use the Apply Shape feature to all of the Department level node shapes, then I would need to select them all then select Apply Shape from the PivotDiagram / Format tab group. I want to select all nodes that represent the Department category, but you can see from the Pan & Zoom window that are many of those spread horizontally across the page, but I am just zoomed in to the top left corner. Of course, I can zoom out and attempt to create a selection rectangle, or I can try using CTRL+Click to add to my selection as I pan horizontally. Both of these methods are laborious and prone to error. However, with the pdSelect add-in installed, a new tab appears whenever I select a PivotDiagram node, and provides me with five extra selection methods, and one to return back to the previous selection.
In addition, you can Pan or Pan and Zoom to your selection…
These are the PivotDiagram Selections provided by pdSelect:
| Method | Description |
| Same Group | Selects all nodes with the same parent node as the one selected |
| Same Category | Selects all nodes of the same Category as the one selected |
| Same Member | Selects all nodes with the same Member value as the one selected |
| Parent Node | Selects the parent node of the one selected and then deselects the original node |
| Child Nodes | Selects the child nodes of the one selected and then deselects the original node |
| Previous | Returns back to the previous selection |
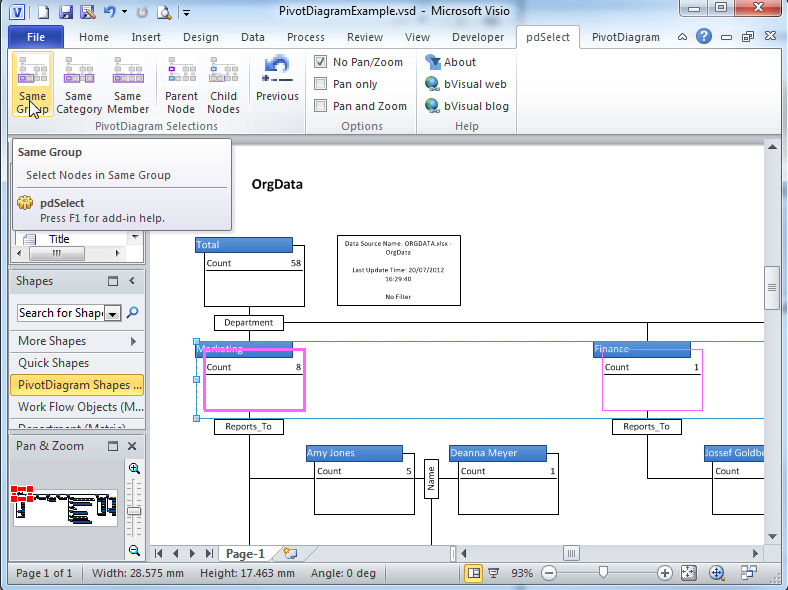
In the above example, I could have used either the Same Group or Same Category buttons because the all of the Department nodes have the same parent node (Total), so they are all in the same group.
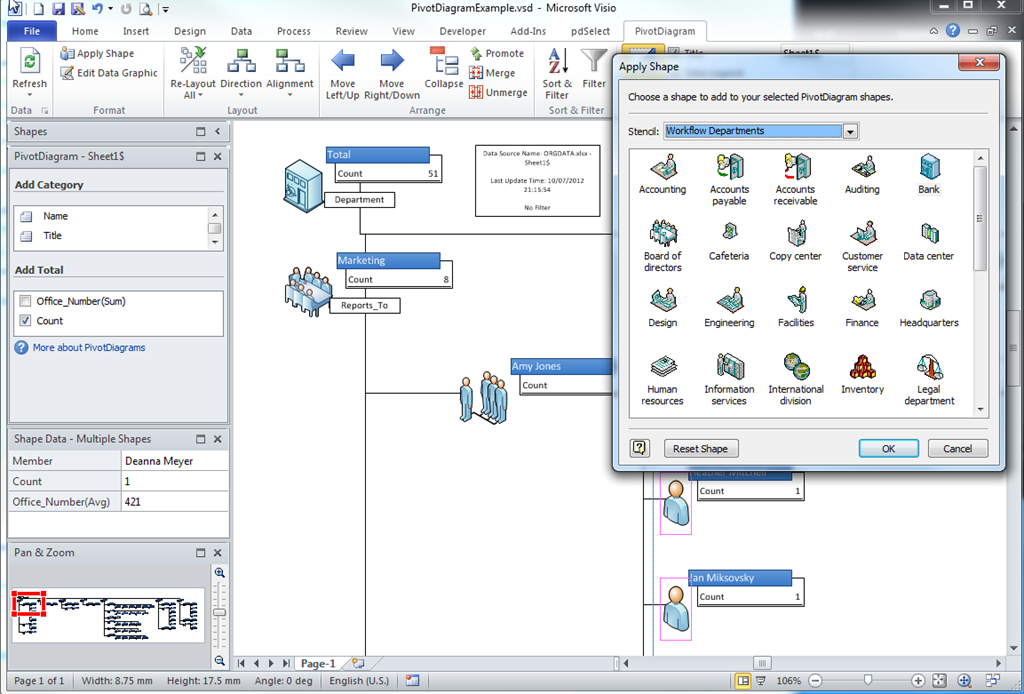
So, now I can easily use the Apply Shape feature (or any other formatting action) to add an icon that represents the level in the diagram.
Another example could be to find (and optionally format) nodes that have the same member value. In the data that I used, and because of the way I pivoted the data, Jossef Goldberg appears more than once, and at different levels since many people report to him. I can now find find these nodes by just selecting one of them, and then clicking Same Member on the pdSelect ribbon.

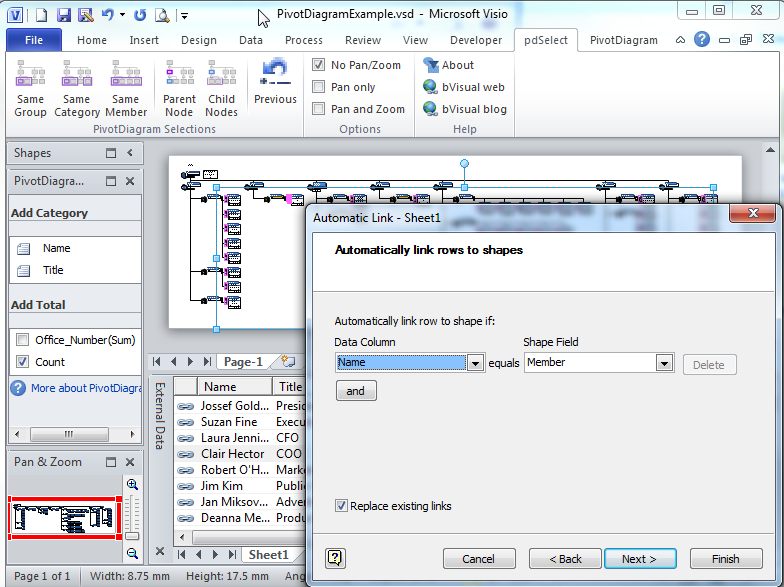
One technique that I often use is to use PivotDiagram to provide the hierarchy that I want, and break the data down to the lowest level, which s the row in the original worksheet. Then I use Link Data to Shapes with the original worksheet and automatically link each row to the lowest level in the PivotDiagram. Well, this is now much easier because I can just select one of the Name nodes in the PivotDiagram, and then click Same Category on the pdSelect ribbon tab, and I then have all the shapes that need to be linked using the Automatic Link wizard (available from the right mouse menu in the External Data window).
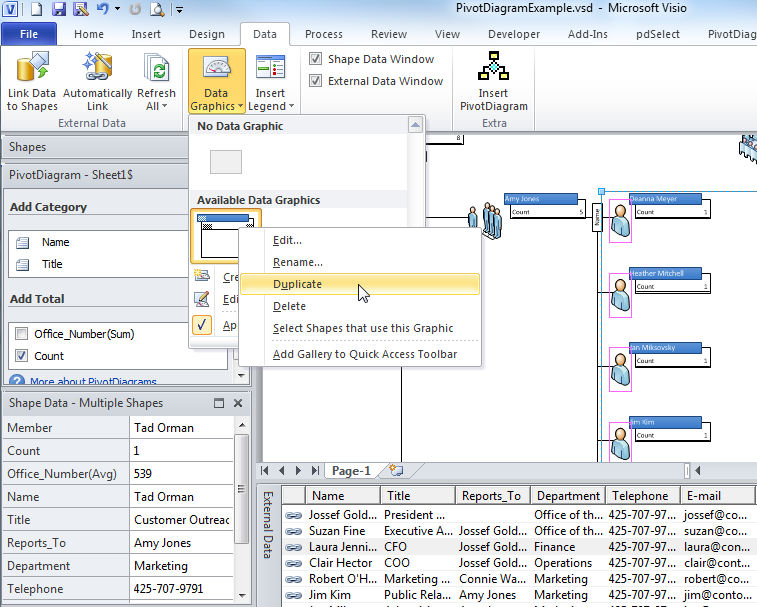
I then Duplicate the default Data Graphic of the PivotDiagram, apply the copy to the selected shapes:
I then edit the Data Graphic to display the extra Shape Data rows that are now available on each low level shape.
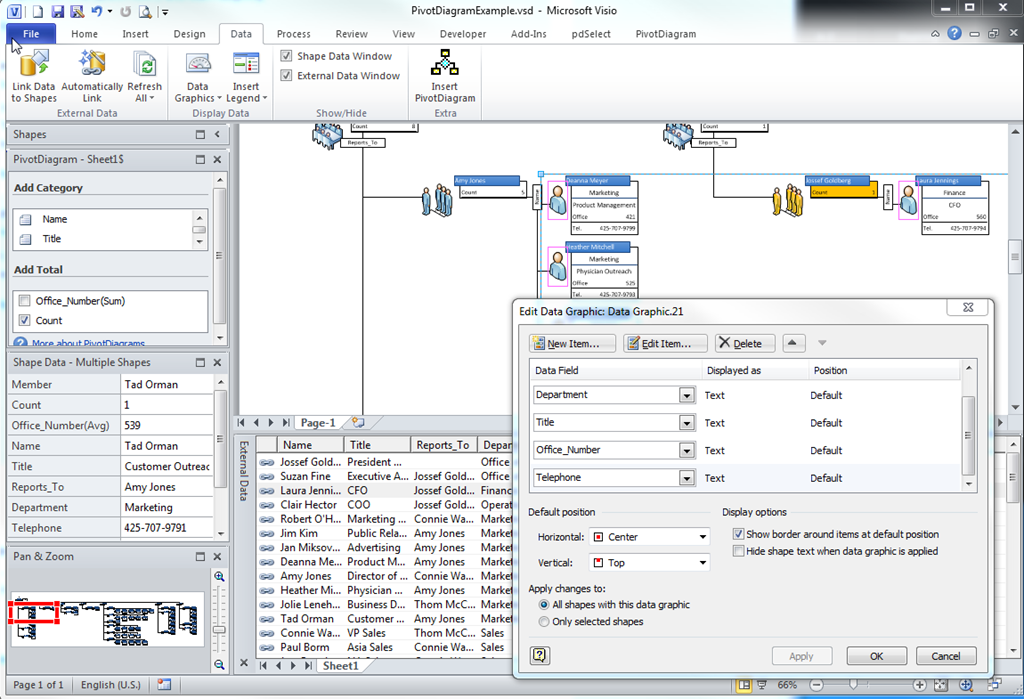
Oh, and in case you noticed the extra Insert PivotDiagram button on my Data ribbon tab above … I just used Customize the Ribbon to add this button because it does not appear anywhere else in the UI, and I think that it is useful to be able to add a PivotDiagram to existing diagrams, not just ones that have been created using the PivotDiagram template.
You can download pdSelect from http://www.bvisual.net/Products/pdSelect.aspx
Enjoy!
Update : See http://blog.bvisual.net/2012/07/20/multiple-selection-methods-for-visio-diagrams/ for non-PivotDiagram selection tool!
Version changes
1.0.1 – 20 Jul 2012 – Setup now works with Visio 2013. Added Pan and Zoom options. Now works on all initial selected nodes, not just the primary item.