


On 02 Aug 2023, Stanley M. Max made a presentation at Towson University (located in Towson Maryland) before the TUgis 2023 conference. (TUgis stands for Towson University GIS.) Stanley spoke about a Visio mapping project that he worked on with David J. Parker. Stanley originated the idea for this mapping project and initiated the process. However, the programming involved in the project was beyond Stanley’s skillset, so he looked on the web for a Visio expert to do that portion. He found David Parker’s information, and Stanley asked David if he would be willing to take over the programming to complete what needed to be done to bring the project to fruition. David kindly agreed with the request.
What follows is a slightly edited abstract of the talk:
Microsoft Visio is a powerful diagramming program used to produce visuals like organization charts, flowcharts, and floorplans. It has many advanced features enabling power users to carry out sophisticated quantitative analysis and generate state-of-the-art graphics. At the same time, newcomers to the program can get started fairly quickly and easily using basic, easy-to-learn procedures. Since Visio forms part of the Microsoft Office family, the program shares characteristics familiar to computer users of all levels. Visio can be used for mapping projects — which provides the central focus of this TUgis project. For a task primarily involving mapping, then, certainly, ArcGIS provides the superior package. However, the versatility that Visio offers — since so much more can be done with it than just mapping — makes Visio an extraordinarily helpful tool for education.

In our project we used Microsoft Visio to produce a map of all 27 member states of the European Union (EU) following the United Kingdom’s withdrawal from the bloc in 2020. We have associated this map with a legend containing the names of these 27 countries. When you click on a country’s name, the country is highlighted on the map and a table pops up containing these key demographic items for the country:
- Population, which Stanley input.
- Area in km², which again Stanley input.
- Percent of the total EU population, calculated by a formula embedded in Visio. David Parker programmed Visio to make this calculation.
- Percent of the total EU area, also calculated by Visio. Again, David carried out the Visio programming.
- Population density, again calculated and again via David’s programming skills, to show the number of people per square kilometre.
This project combines computer mapping, contemporary European politics, and demography. It serves as a case study of Visio’s usefulness in an educational setting.
Related articles

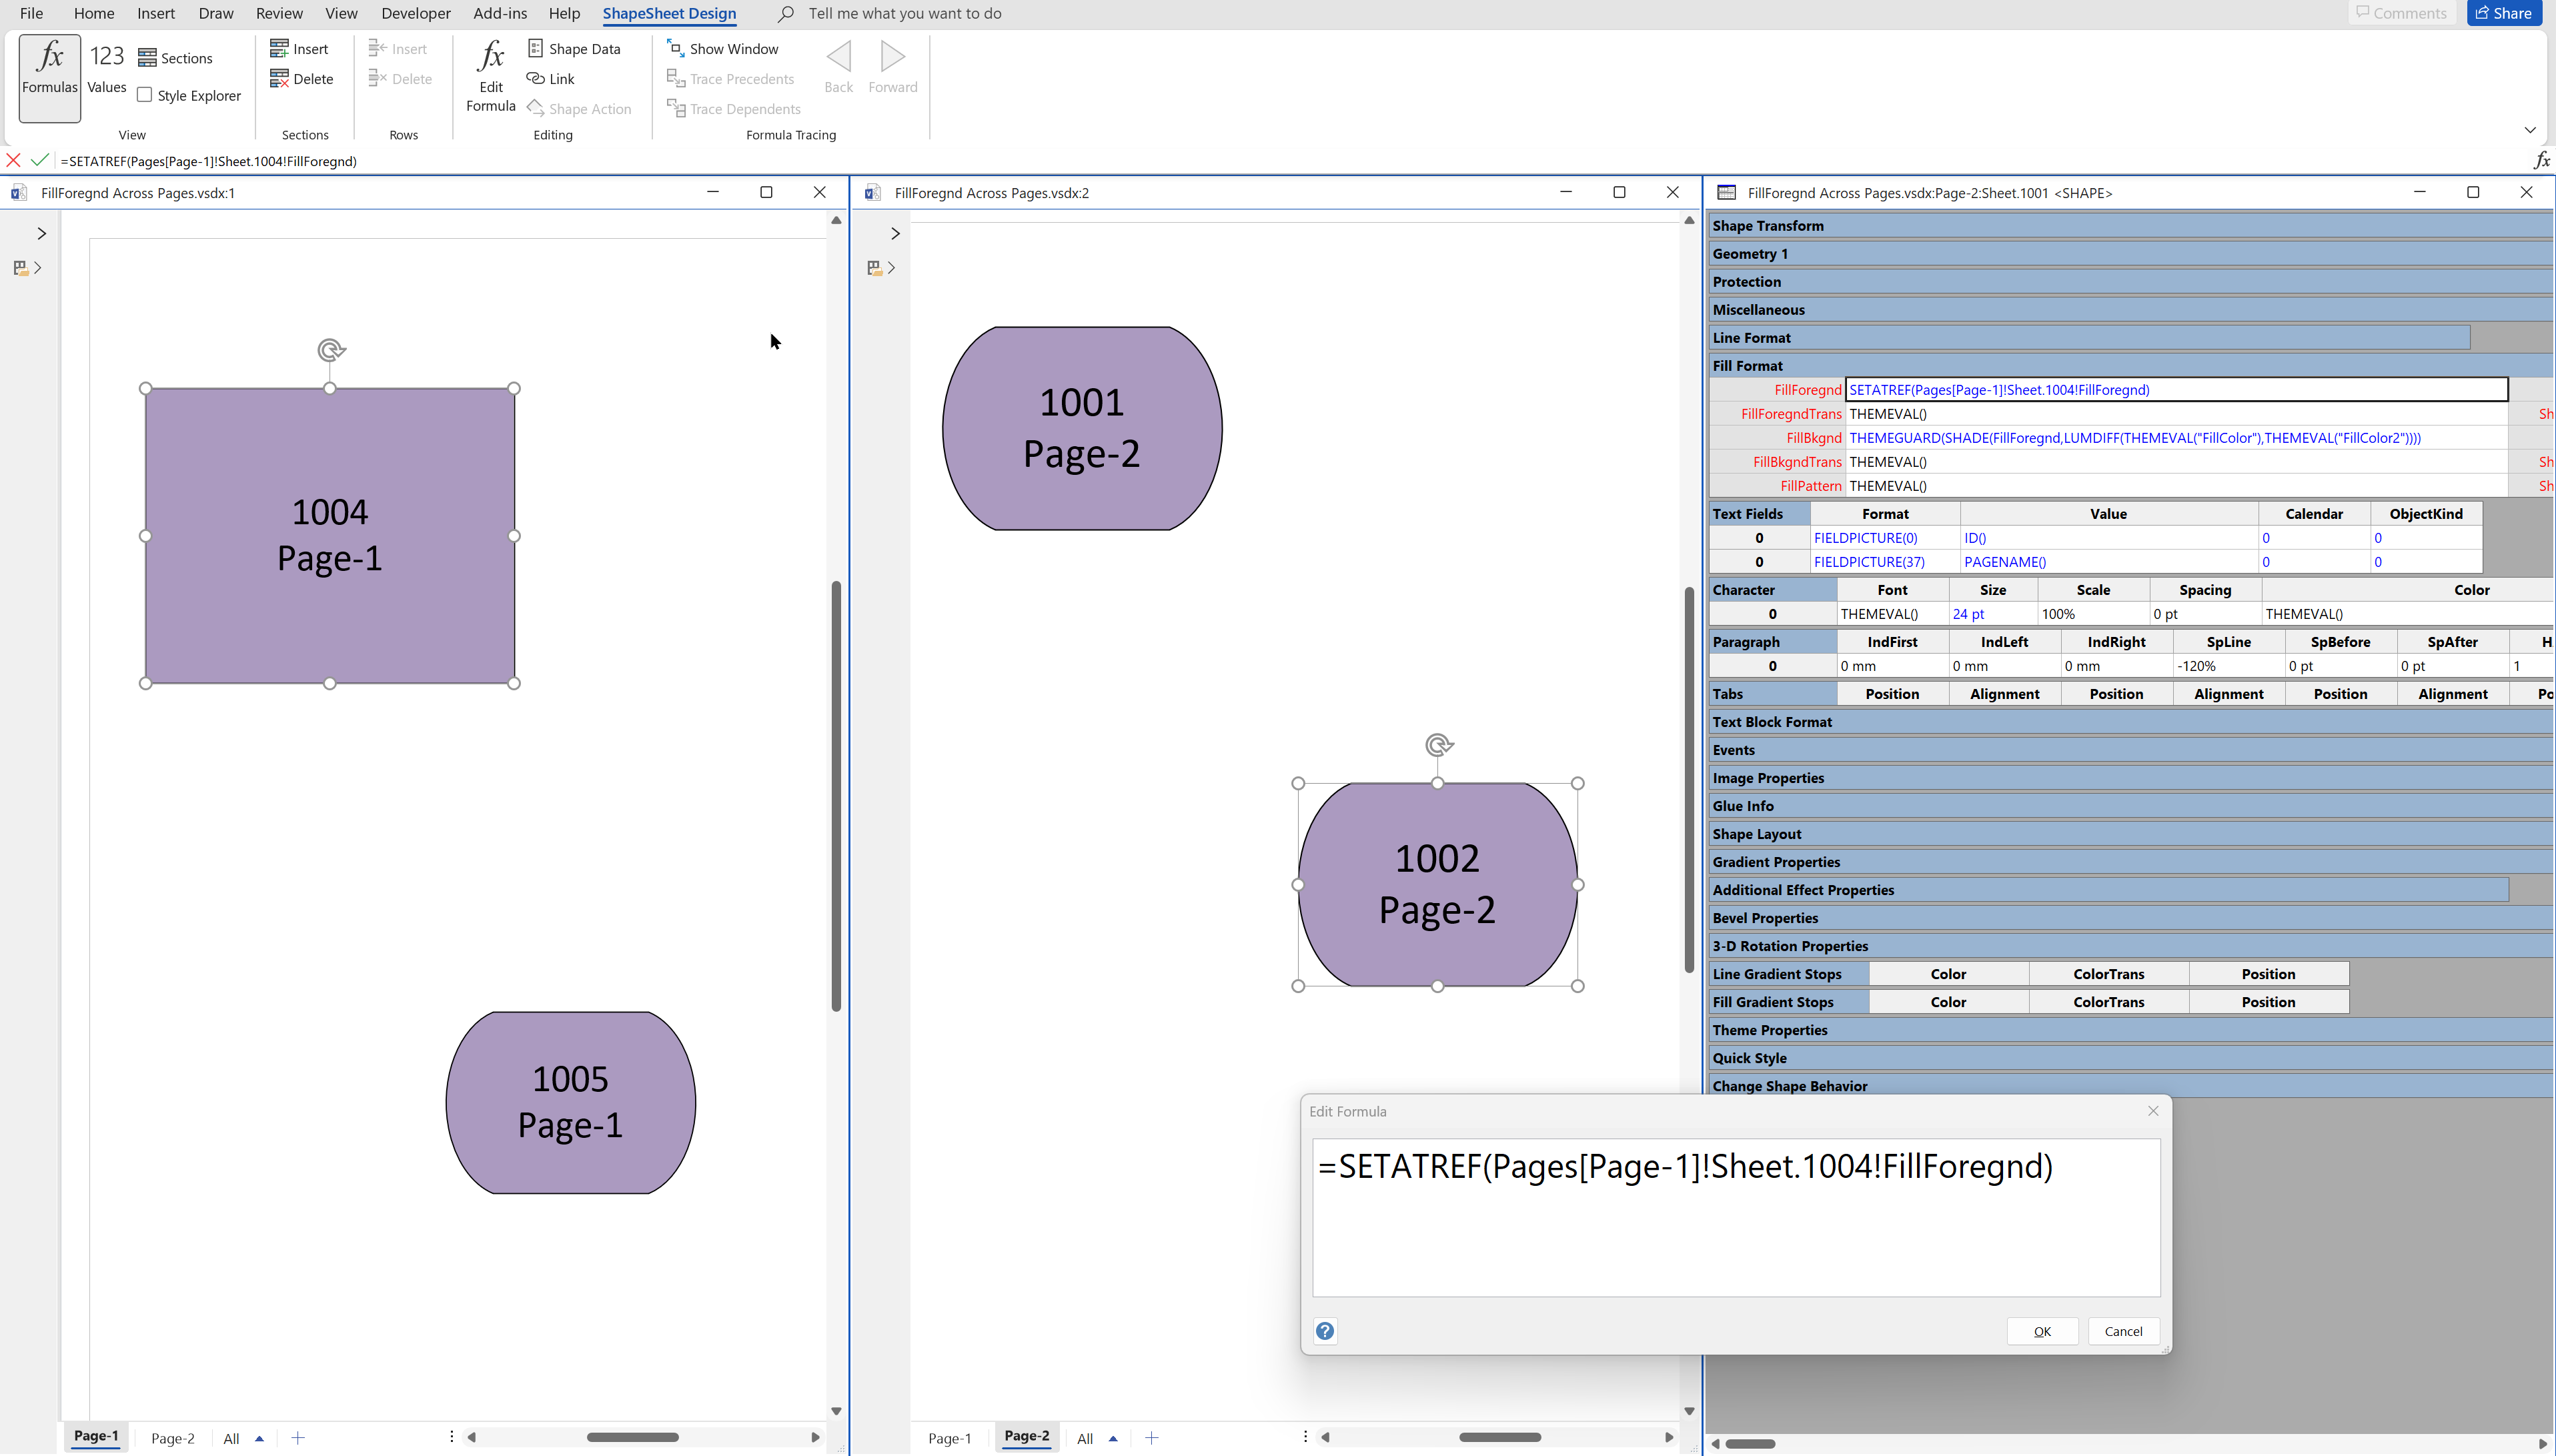
Synchronizing Visio Shape Fill Color (or almost any cell) across pages
I was recently asked how the color of one shape can be changed and for other shapes to be automatically updated to the same color … even if they are on different pages! Well, it is possible with Microsoft Visio’s awesome ShapeSheet formulas. In fact, this capability is not limited to the FillForegnd cell ……

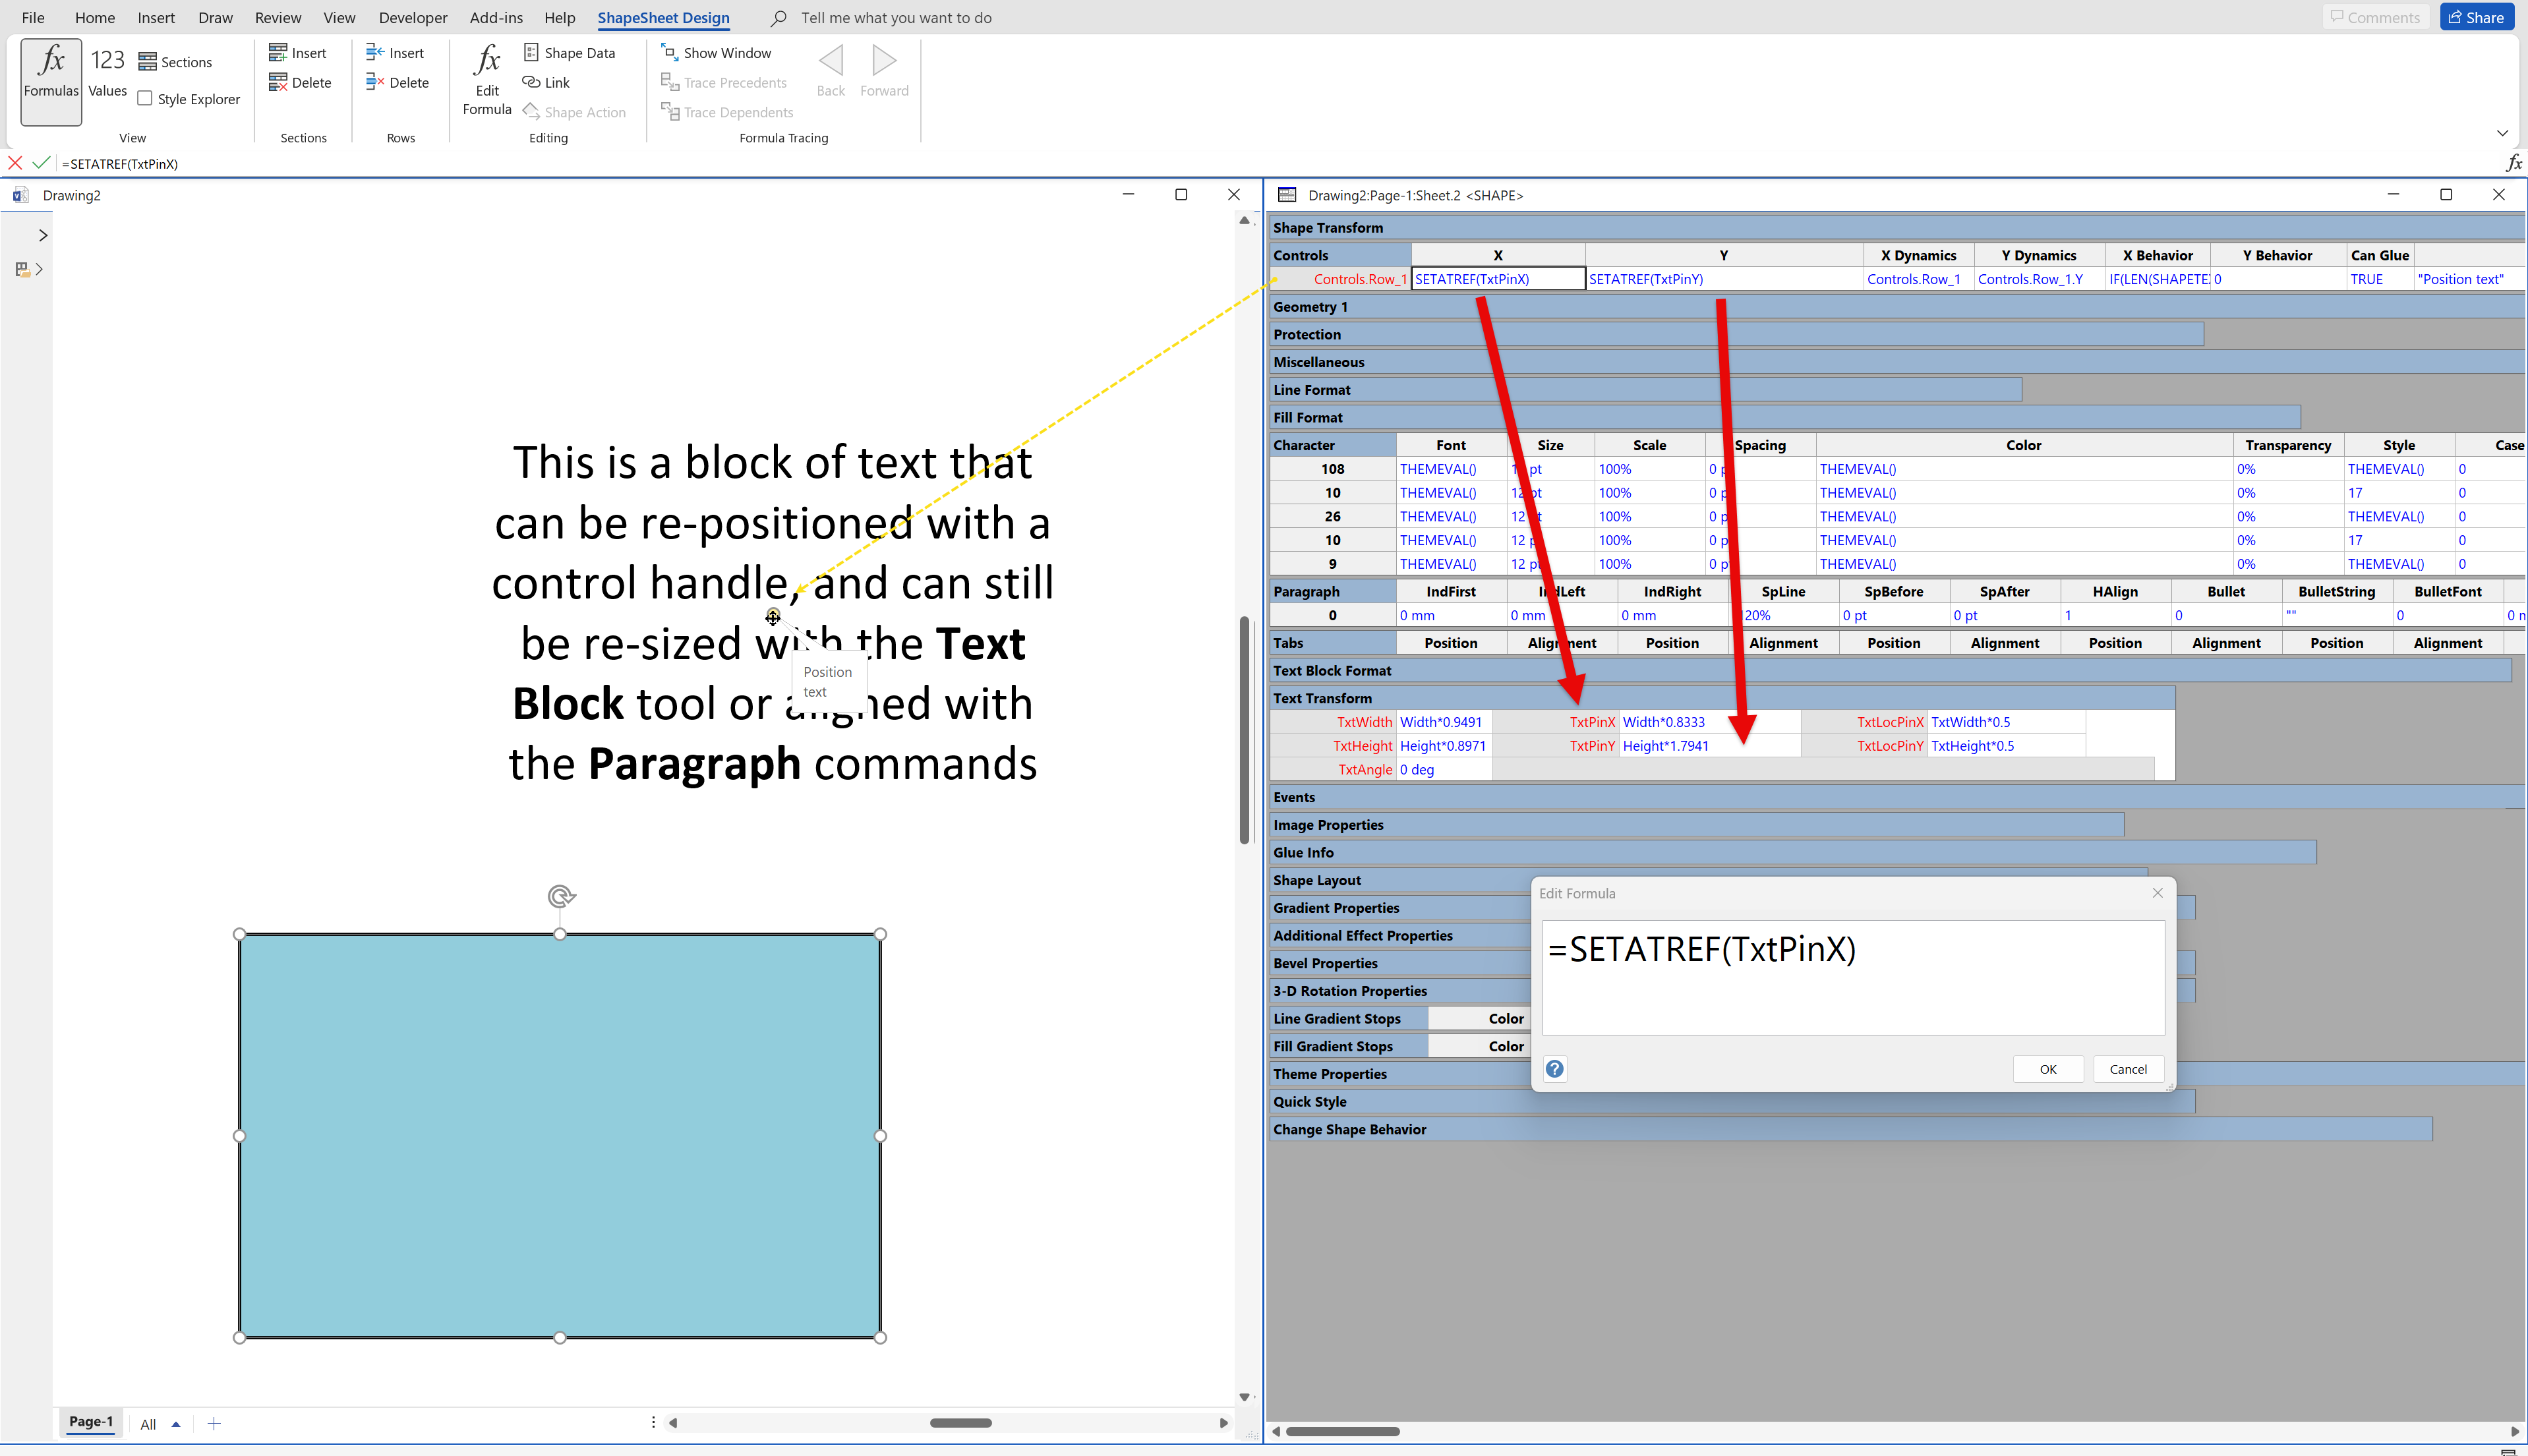
Positioning Visio Shape Text Block with a Control Handle
I was recently asked how a control handle can be added to a Visio shape so that it can be used to re-position the text block. Fortunately, it is extremely easy to setup, and requires just two formulas to be updated in the ShapeSheet. This is a great use of the SETATREF(…) function. (more…)

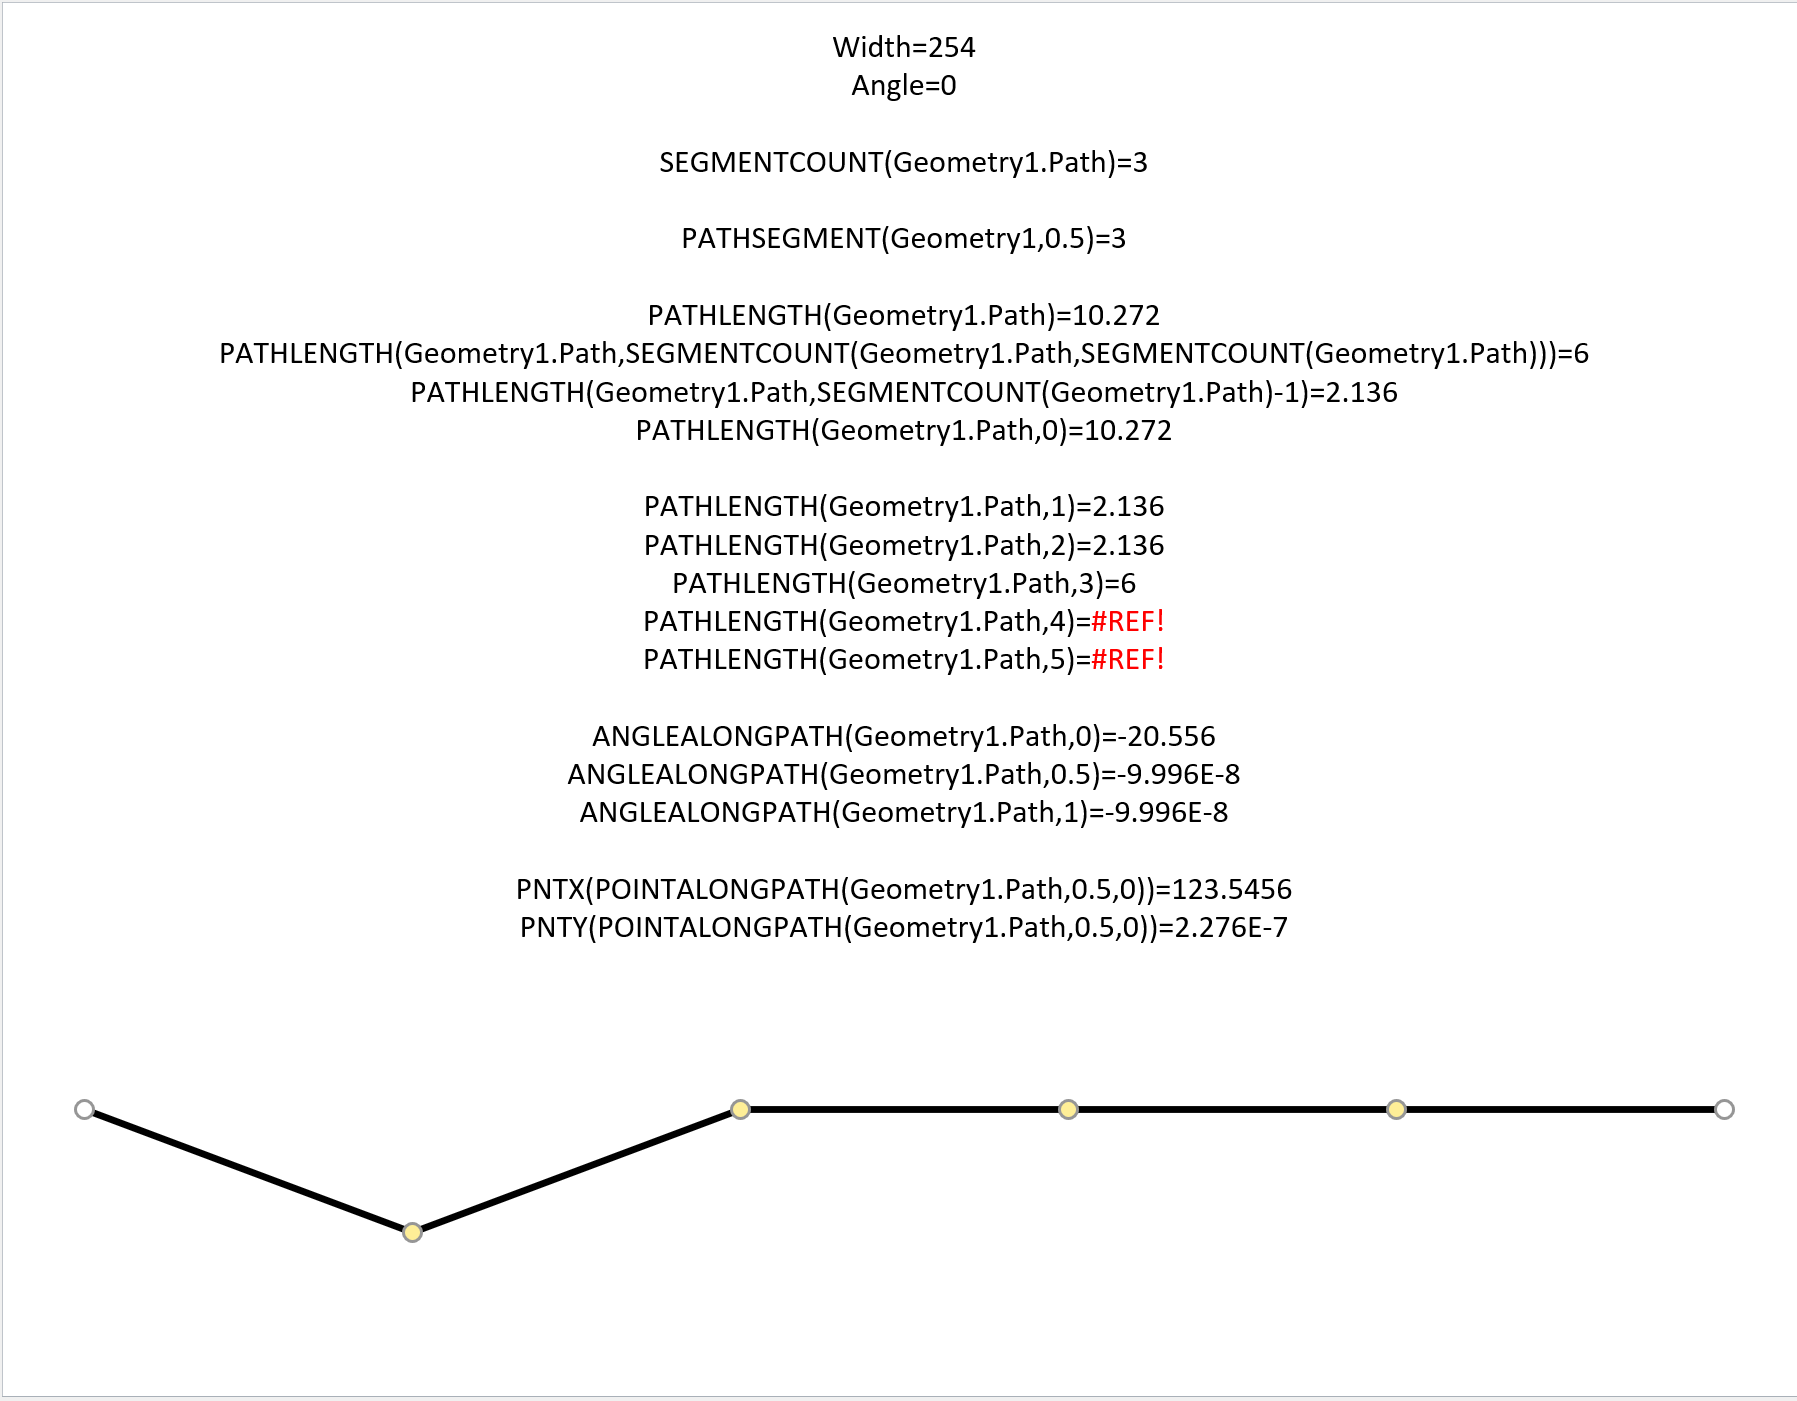
Understanding Segments of Visio Geometry
I recently had to revise my understanding of the POINTALONGPATH(…) function in Visio because I was getting a #REF! error in some cases. My particular scenario requires a line with a number of vertices that are initially all in a straight line but can be moved by dragging controls around that each vertex is bound…

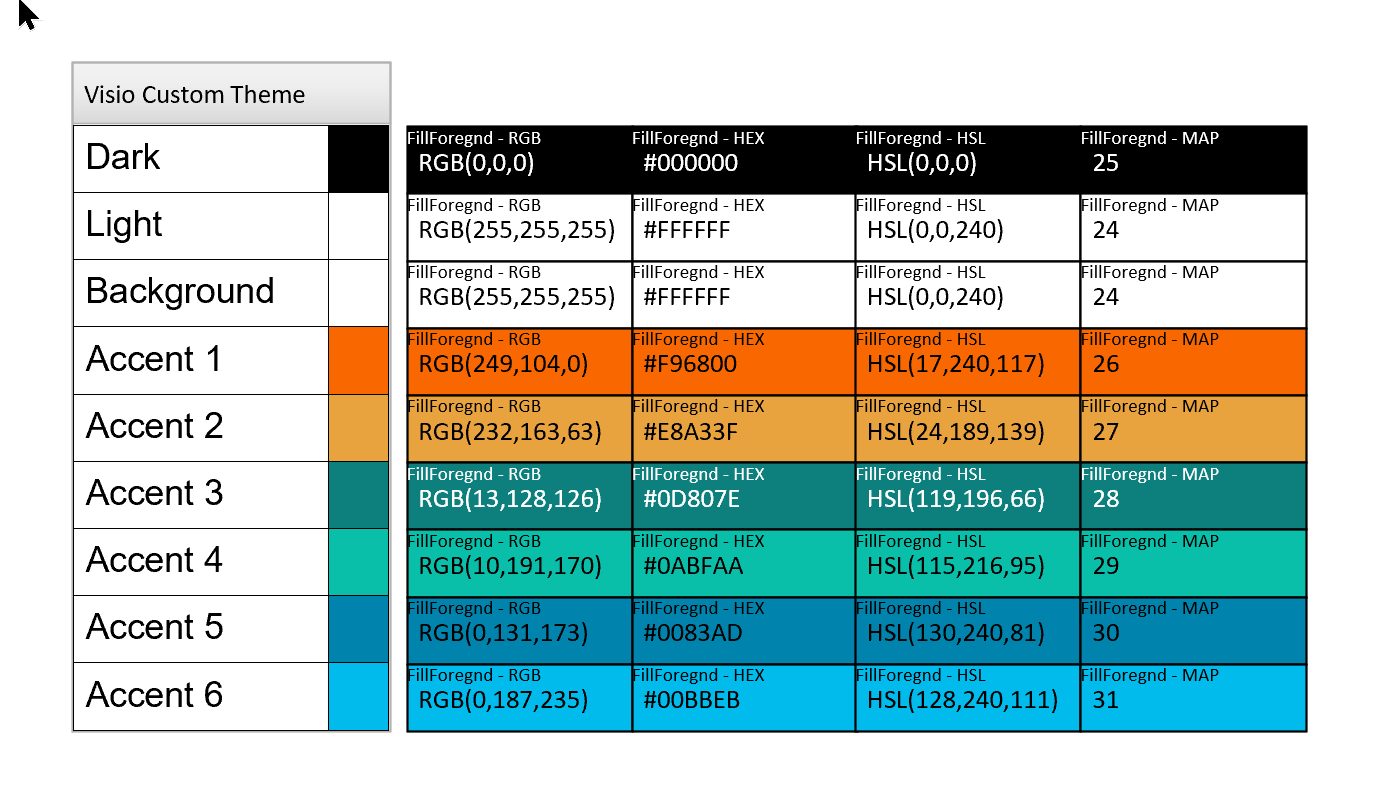
Custom Color Themes in Visio?
I was recently looking into custom color themes for corporate branding in desktop Microsoft Visio and became re-aware how different Visio still is from the rest of the Microsoft Office applications. A Visio page or document does not need to have any theme applied, but the documents of the other Office applications always have a…

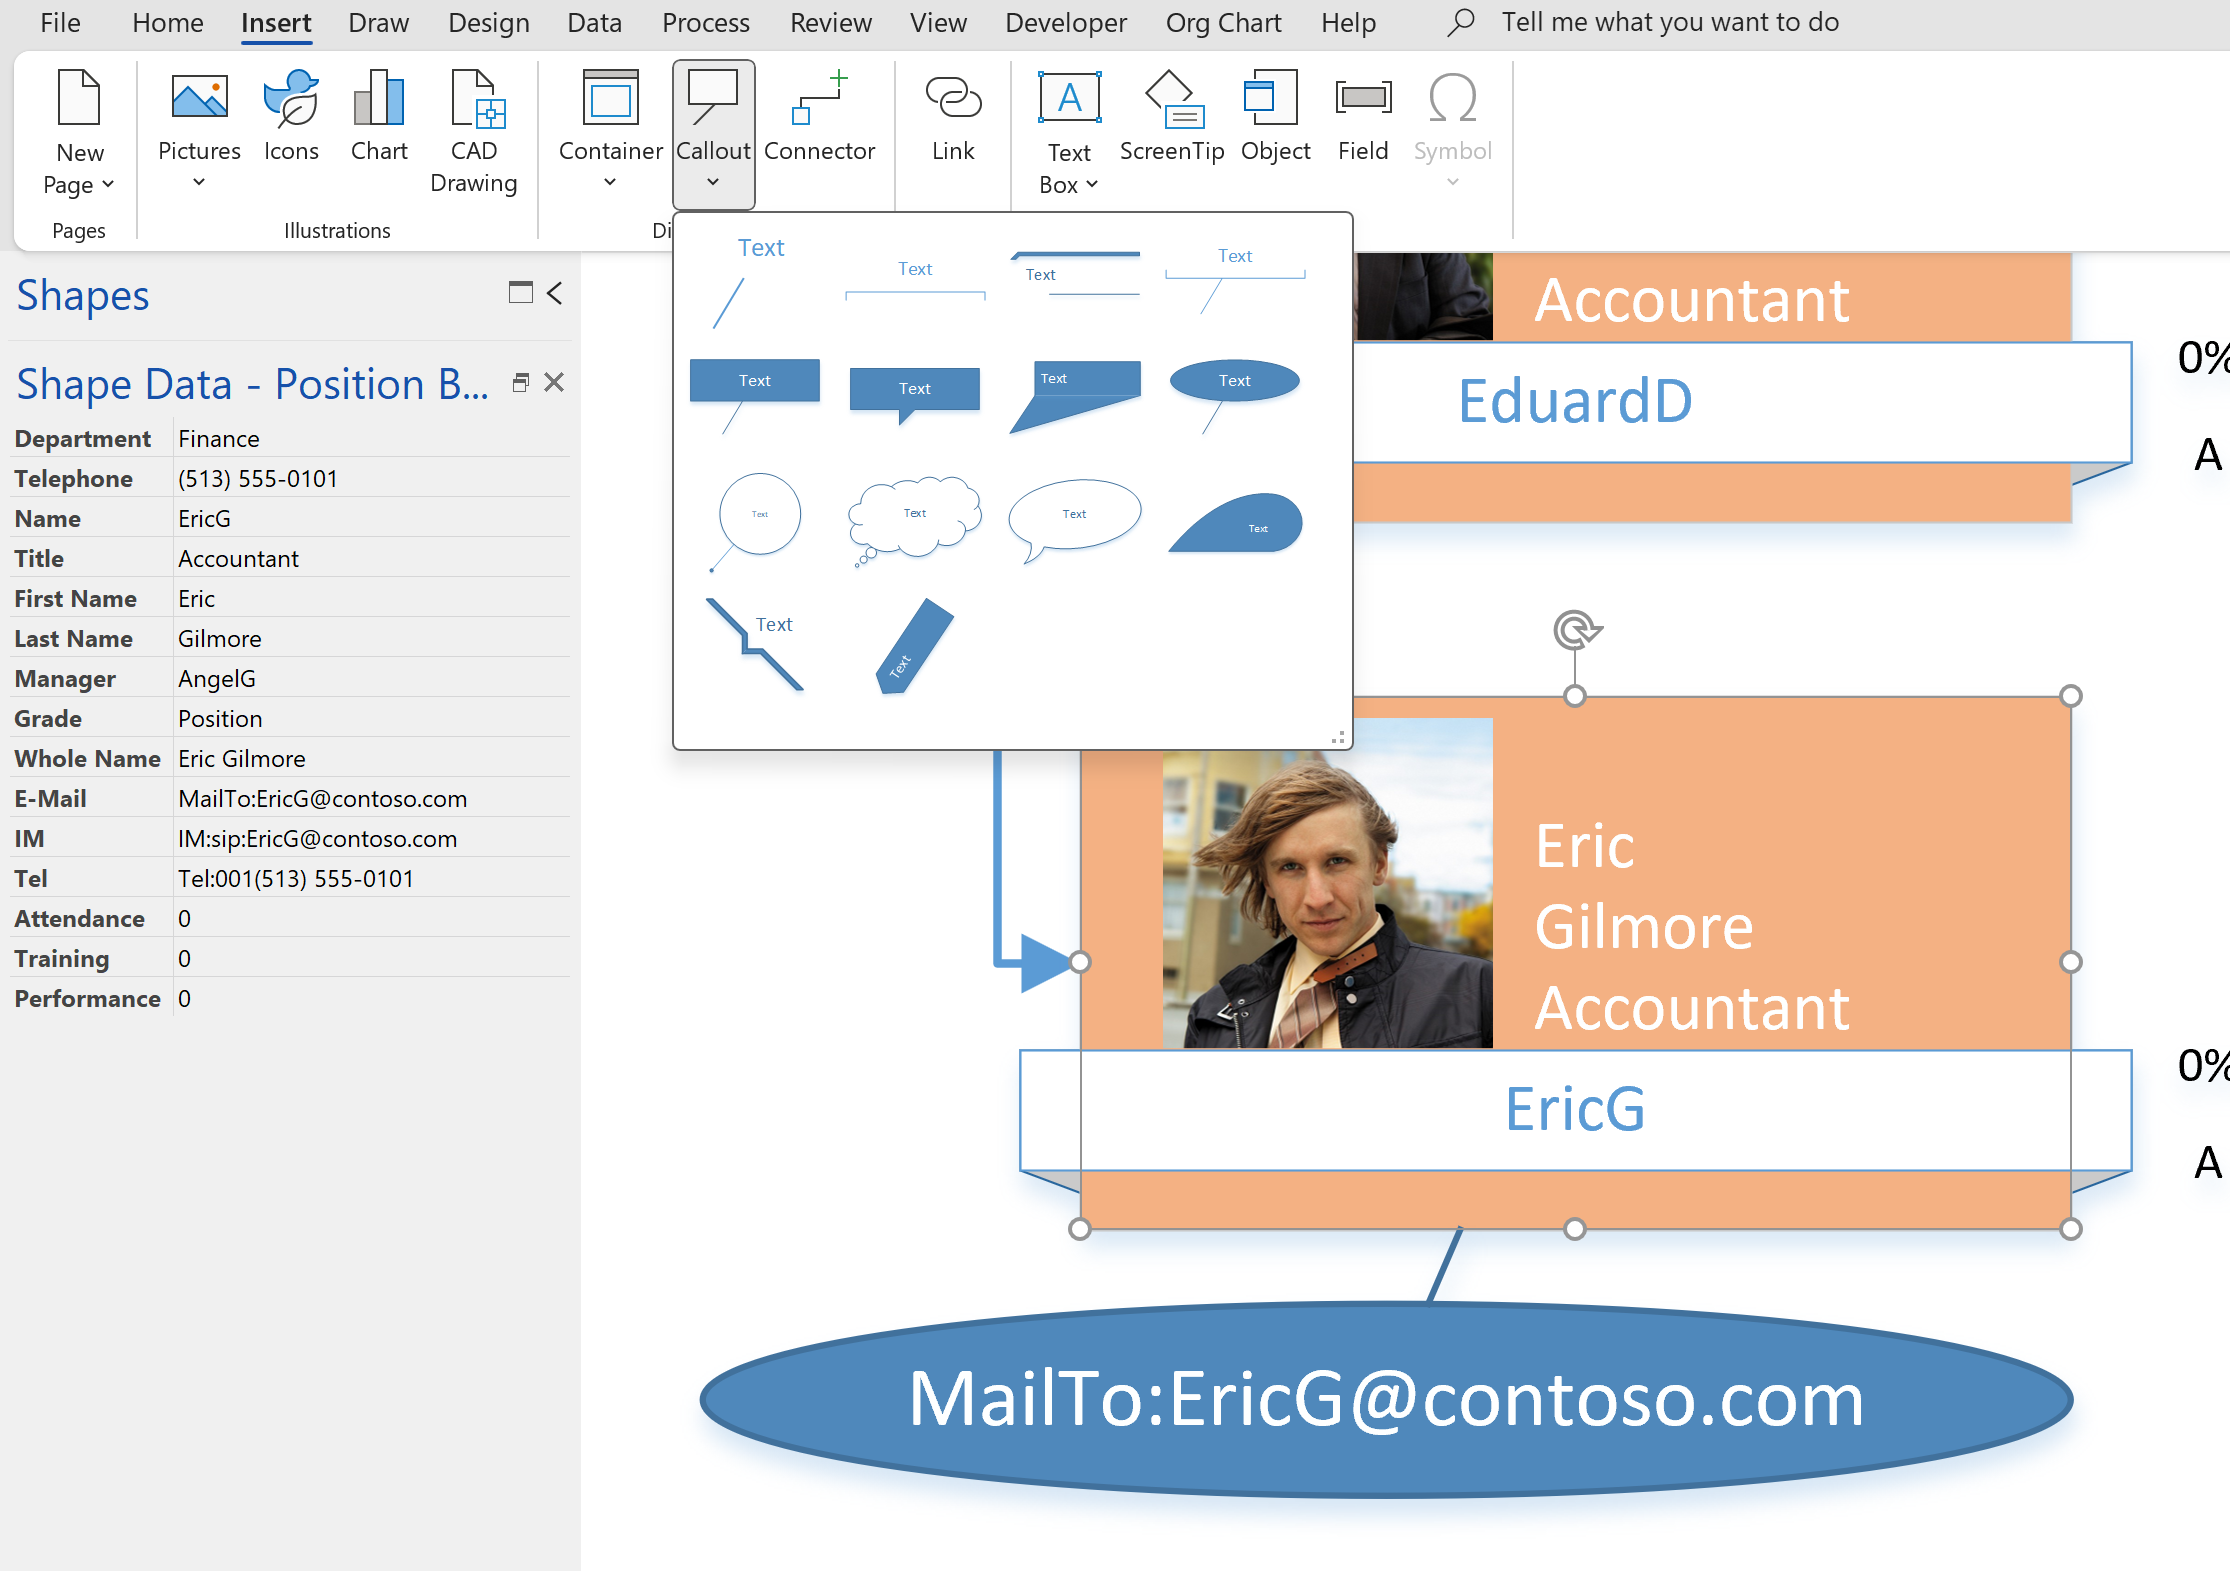
When is a Visio Callout not a Callout?
I have been a Visio user/developer since the mid-1990’s and seen the word “callout” used as part of the name of many master shapes in Visio. The images below show five ways that the term “callout” has been applied to the name of Visio master shapes. Generally, each evolution has been an advance on the…

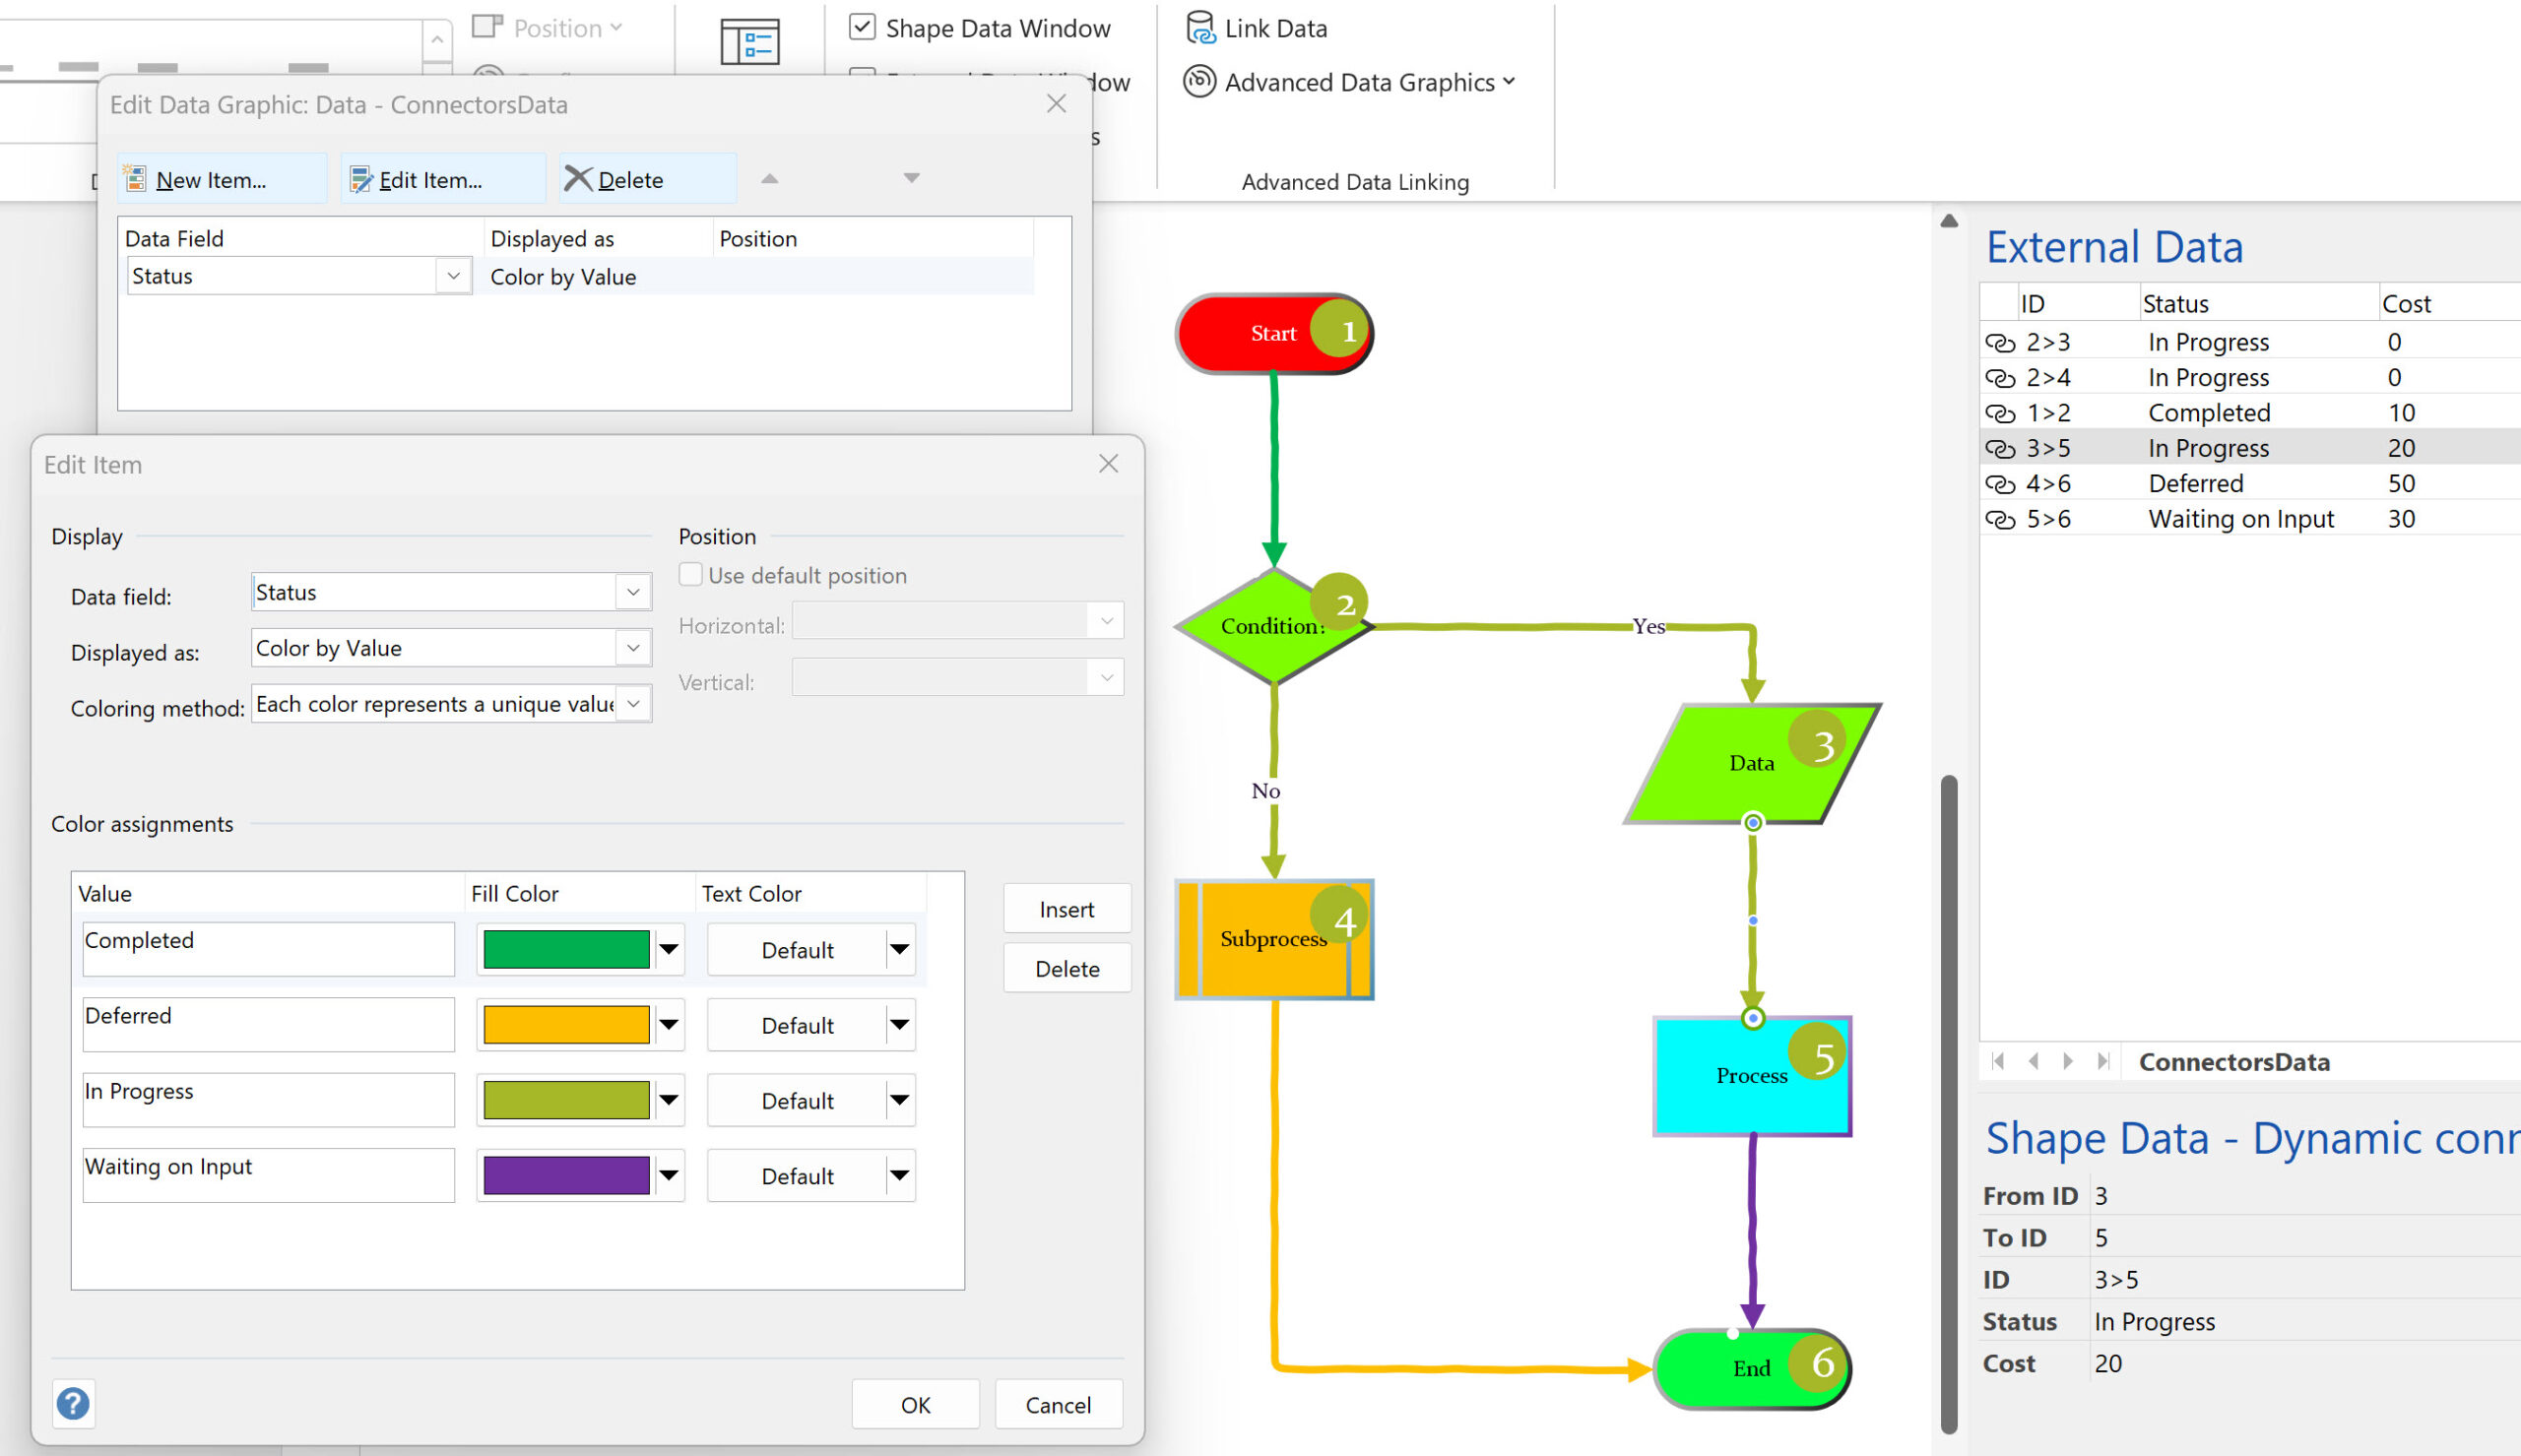
Using Visio Color by Value on Connectors
Data Graphics in Visio Plan 2 and Visio Professional is great, but it only enables us to use them with 2D shapes in Visio, i.e. not on connectors. So, what if you want to change the line colour of the connectors between the 2D shapes because of the data flowing between them? Well, it is…