

In my last article, I described how Visio can be used to input Nodes & Edges into a SQL Server graph tables (see Using #Visio and #PowerBI with #GraphDatabase in #SQLServer). In this article, I show how PowerBI can be used to create an Excel table that can then be used to automatically create a Visio diagram. This diagram can then be enhanced for reports and presentations, or used to check the validity of nodes and relationships. The shapes can then be used to update or delete edges and nodes in the database.

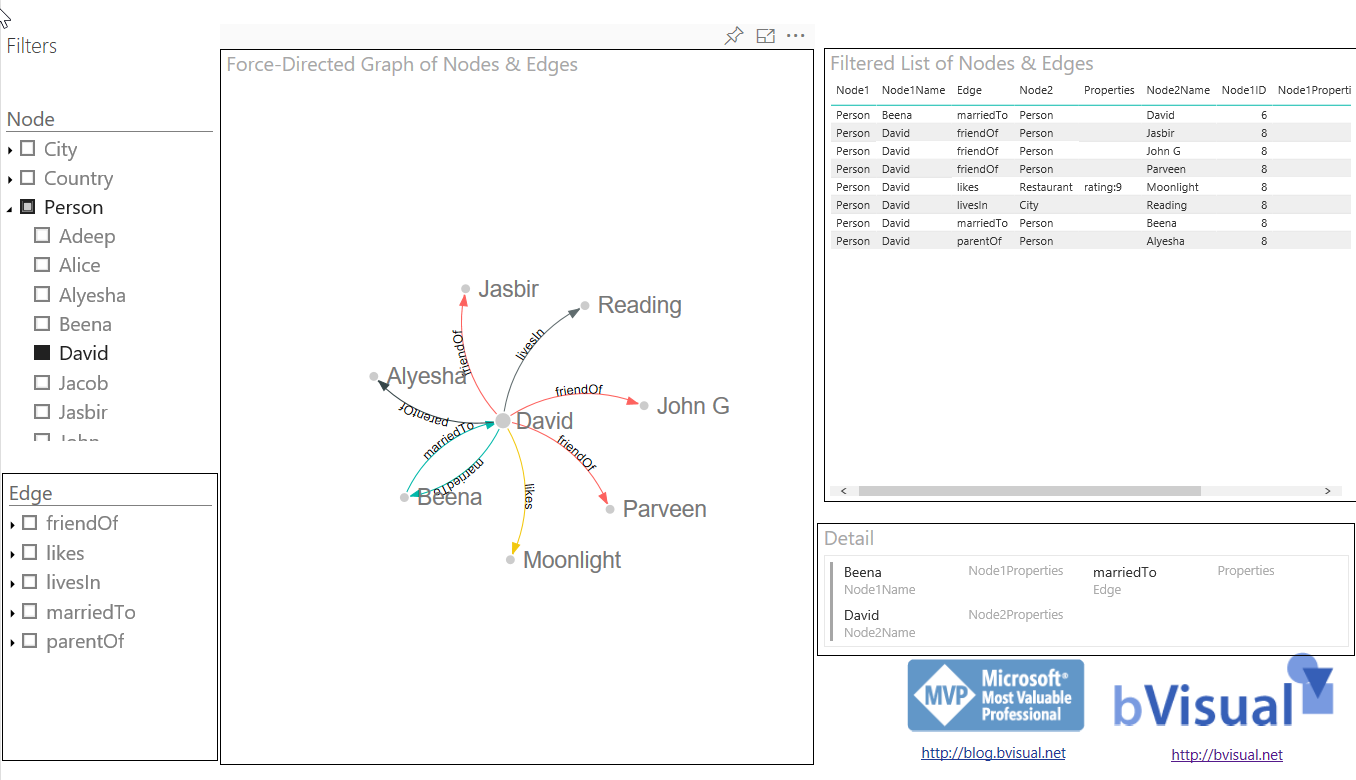

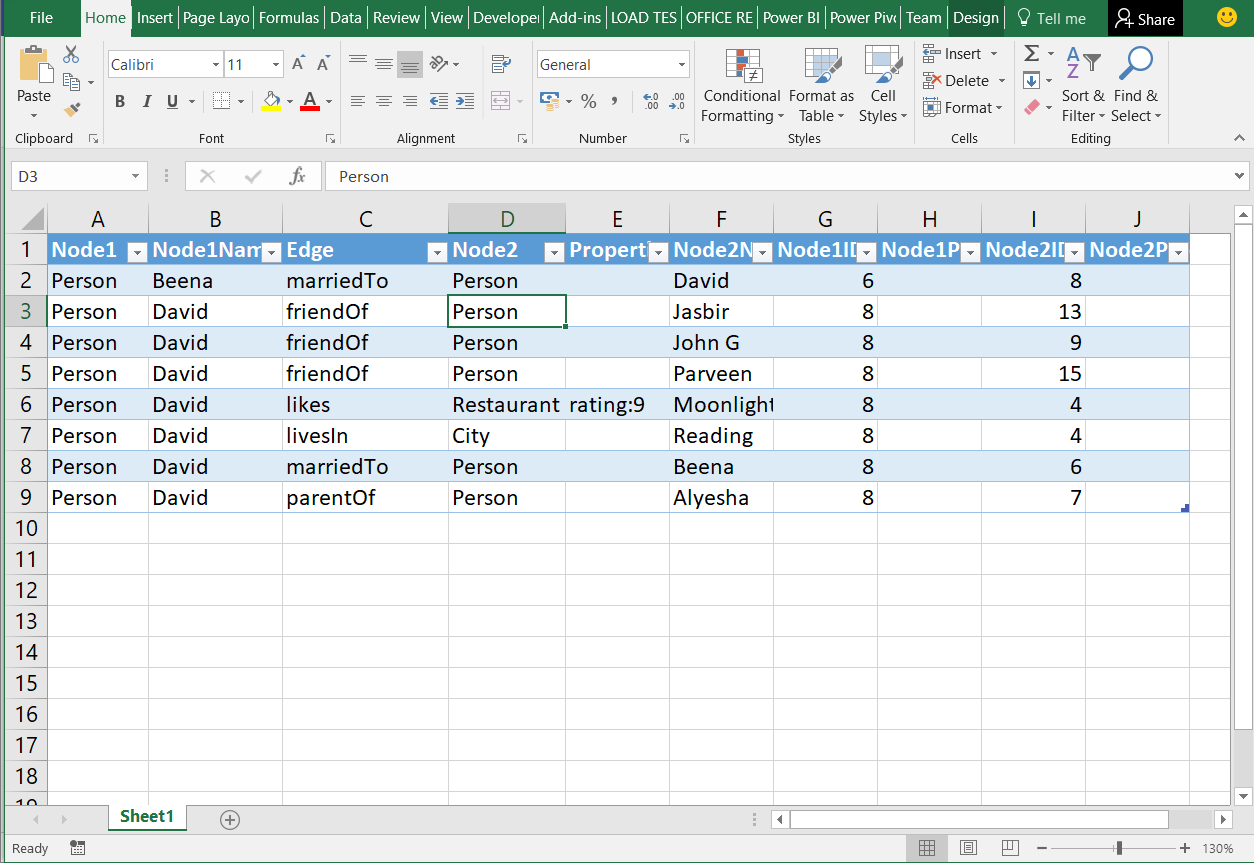

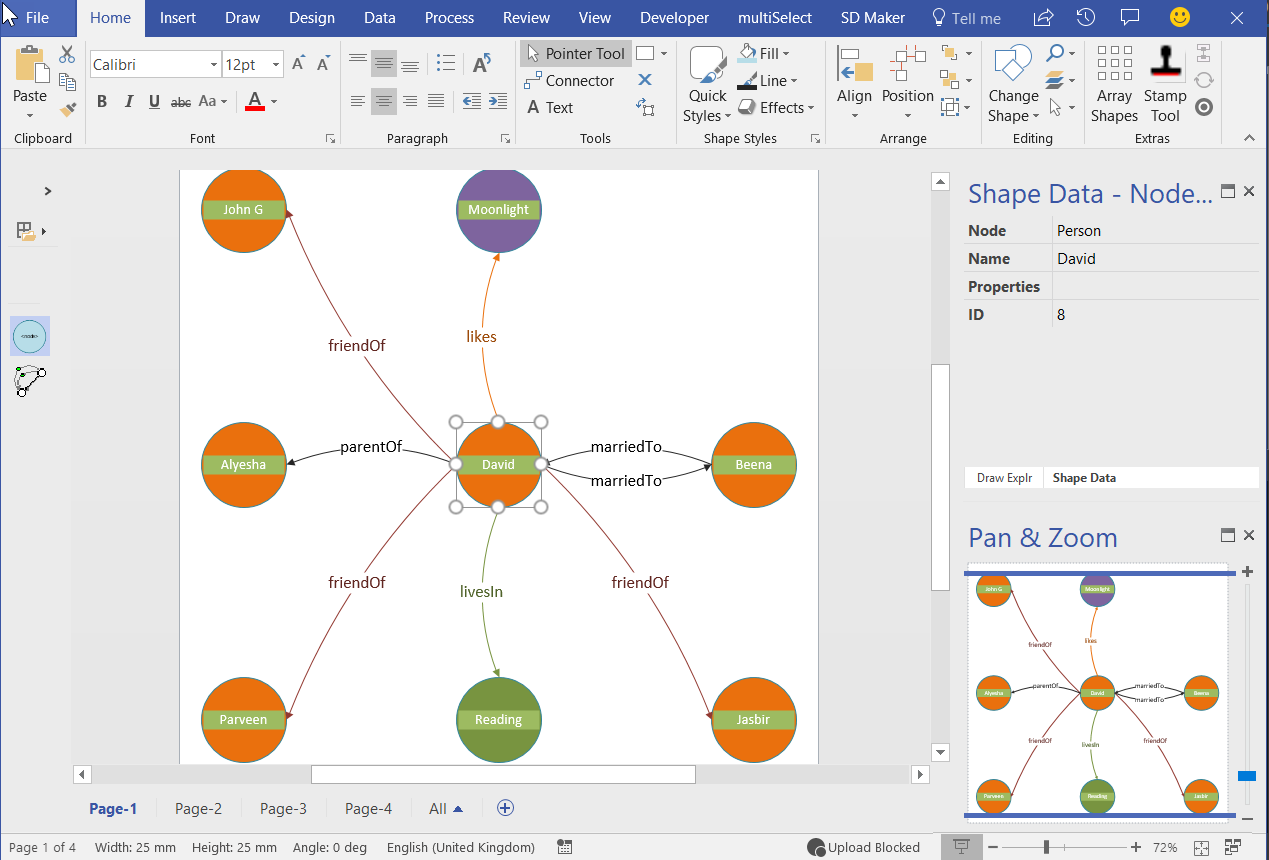
In the above example, the PowerBI table visual is filtered by the other visuals to provide a list of Nodes and Edges. The PowerBI web app can then export this table to Excel, which can then be read by some code in LinqPad (as this is just a prototype), and the Nodes and Edges can then be automatically added to the active Visio page. As this is just a proof of concept, I left the code un-optimised so that the progress of the shapes being added to the page and being connected can be seen. This would, of course, be much quicker in a finished application. Also, I have not bothered with any nice icons either, but this could also be a simple enhancement.

Although I have used a Force-Directional visual in Power BI, I am sure there are others that would also be useful. All I was interested in for this example was to be able to create a filtered list in a suitable form for use as a source for creating a partial graph diagram in Visio. In fact, Cypher Queries can also be written to produce tables of Nodes and Edges that could be used to create Visio diagrams too.
Deleting Nodes & Edges

Of course, now that I have created a simple way to create Nodes & Edges, then I can more easily create mistakes. So, it is also necessary to be able to delete them.
To do this safely, I assumed that no Node should be deleted if it has any Edges. Therefore, selected Edges need to be deleted first, and then the Nodes can be deleted if there are no remaining Edges. I also decided that, rather than delete the shapes, that I would simply remove the Data Graphic. Thus it is easier to re-insert the shapes back into the database, if desired. A possible enhancement is to add a Status shape data row to each shape, so that this could be changed between, say, In DB and Not in DB. These values could then be used to Color by Value or apply a Data Graphic Icon Set.
I could not find an example of deleting Edge rows, but I managed to write some dynamic SQL in LinqPad, eg:
 var results = ExecuteQueryDynamic($"DELETE FROM [{ens.Edge}] " +
 $"Where $from_id = (SELECT $node_id FROM {ens.Node1} WHERE id = {ens.Node1ID})" +
 $"And $to_id = (SELECT $node_id FROM {ens.Node2} WHERE id = {ens.Node2ID})");
In this example, my ens object is the values read from the selected Visio Dynamic connector/Edge shape. So, ens.Edge is the Edge table where the row is stored.
There are some limitations to the current SQL Server implementation of Graph objects, such as Edges are mono-dimensional, but I think it is an exciting progression. I also think that a little custom code for Visio can create an effective tool for entering, deleting and displaying information within the database. All I need now is a real project to develop a proper solution for!