

It is time to talk about the new Visio custom visual for PowerBI. You may have read about it at Visio Power BI example and Add Visio visualizations to Power BI reports, but I wanted to add my findings. First, it is great to see this feature, but it is not yet the finished article. However, I hope I can show that it can be an extremely useful addition to the business intelligence toolset from Microsoft. I think that the existing Link Data to Shapes and Data Graphics features in Visio desktop are considered to be Operational Intelligence capabilities, whereas this new custom visual for PowerBI is definitely Business Intelligence. This is a different discipline, and I have been developing some guidelines for good practice when using Visio with PowerBI. In this article, I will demonstrate how I created a PowerBI dashboard using graphics and data from last years Microsoft Ignite conference.

Let me set the expectations because I am working with a preview of the Visio custom visual.
- It uses Visio Online to display Visio documents, but some features are restricted, such as the tabs for multiple pages.
- PowerBI data rows and Visio shapes can be automatically linked with shape text or Shape Data values.
- PowerBI data rows and shapes can be manually linked.
- The Visio custom visual can apply multiple rows of text, with or without labels.
- The Visio custom visual can apply a single color by value, which must be numeric.
- There is a Visio file size limit and number of shapes (2,000) limit currently.
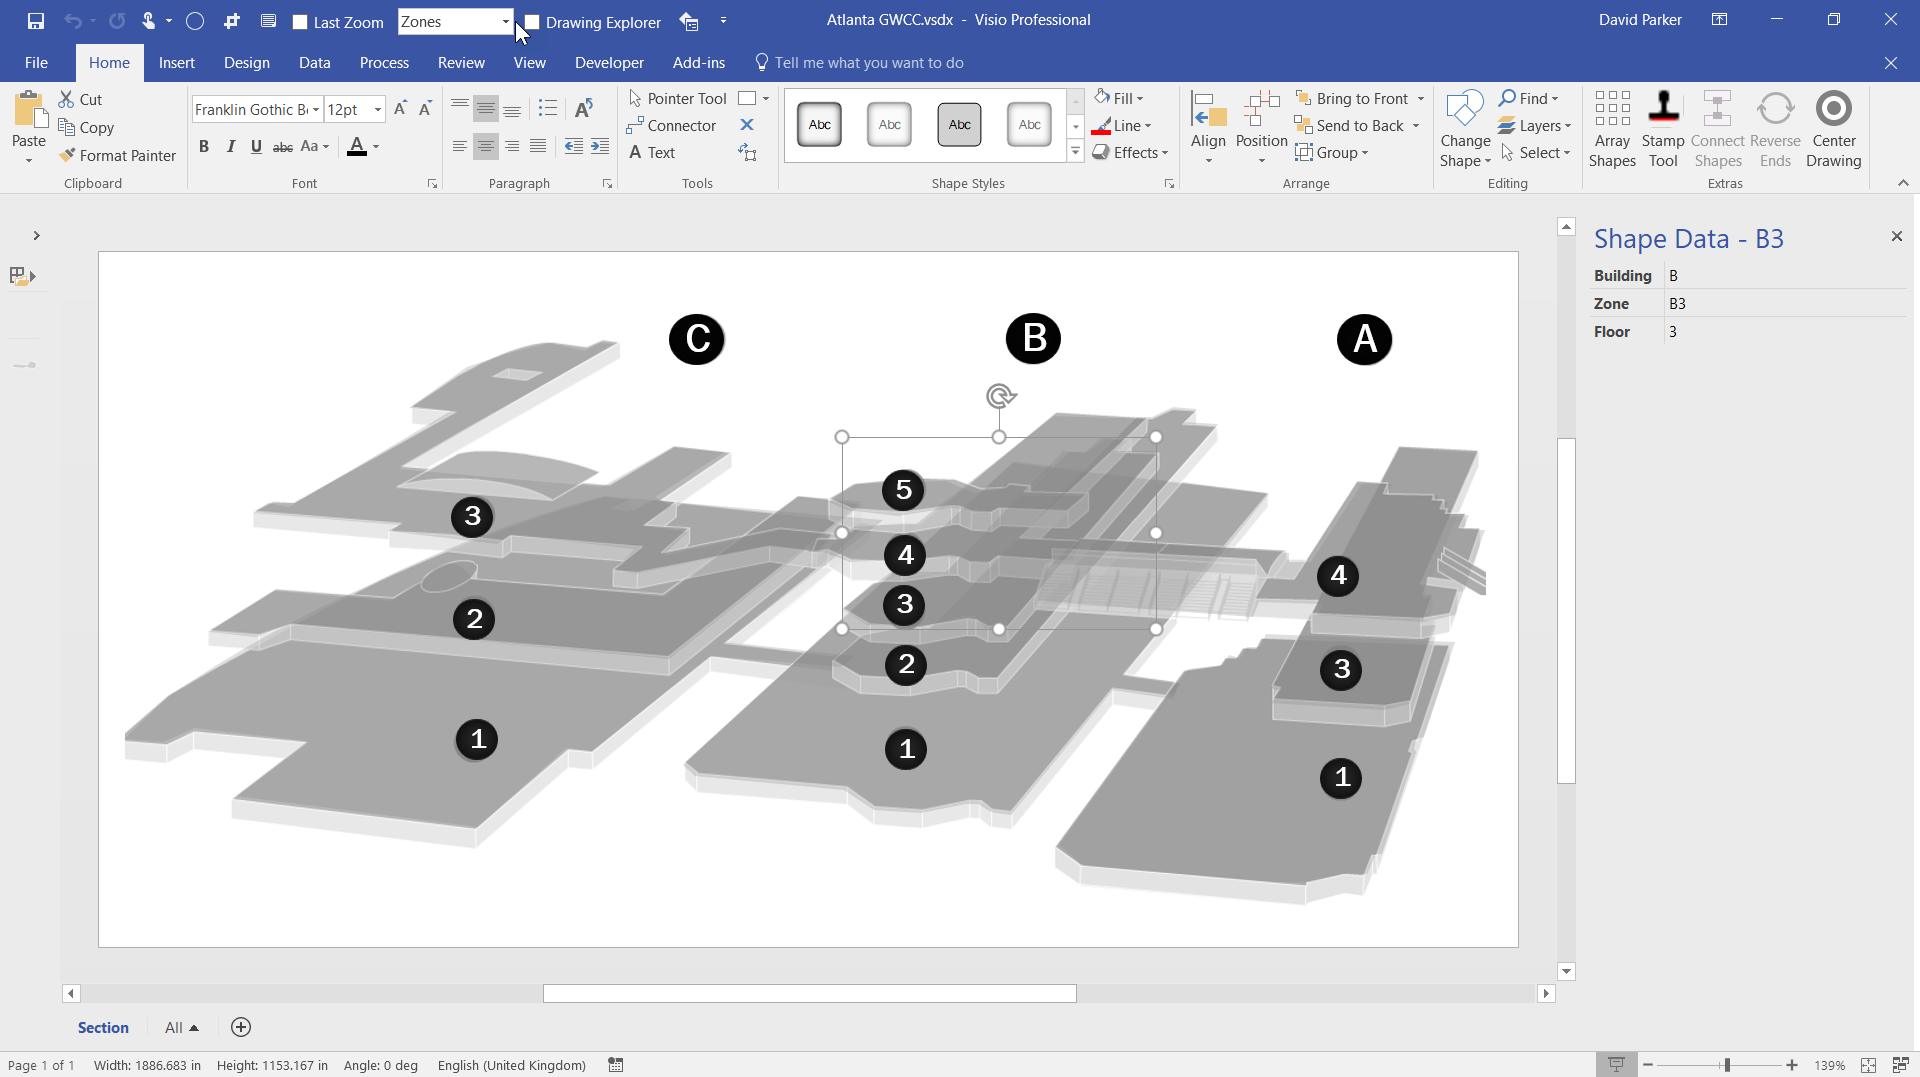
I was a speaker and Visio booth attendant at MS Ignite in Atlanta last year, and I created some demonstrations using the floor plans and session data (see Updates to #MSIgnite #Visio Session Documents). Microsoft have been busy developing new capabilities in Visio and PowerBI since then, so there is much more that can be done with the data and diagrams since then.
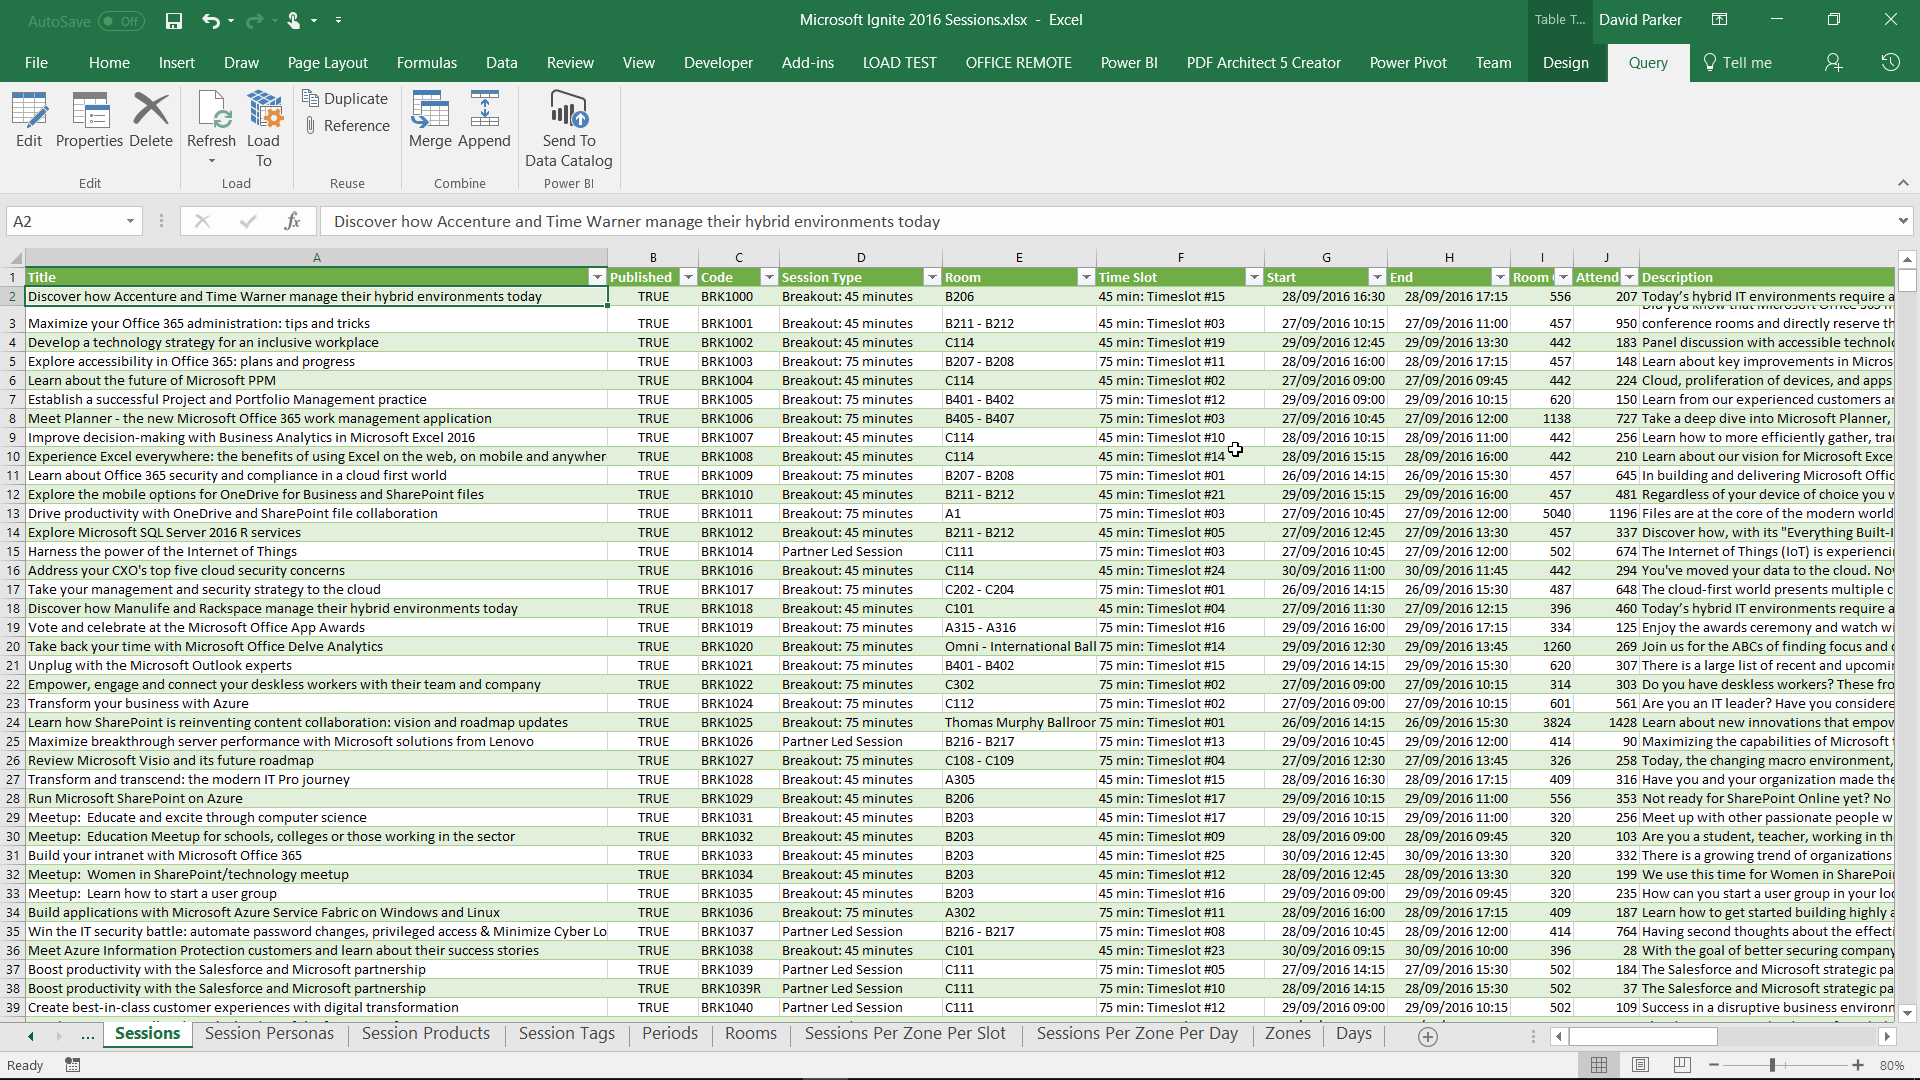
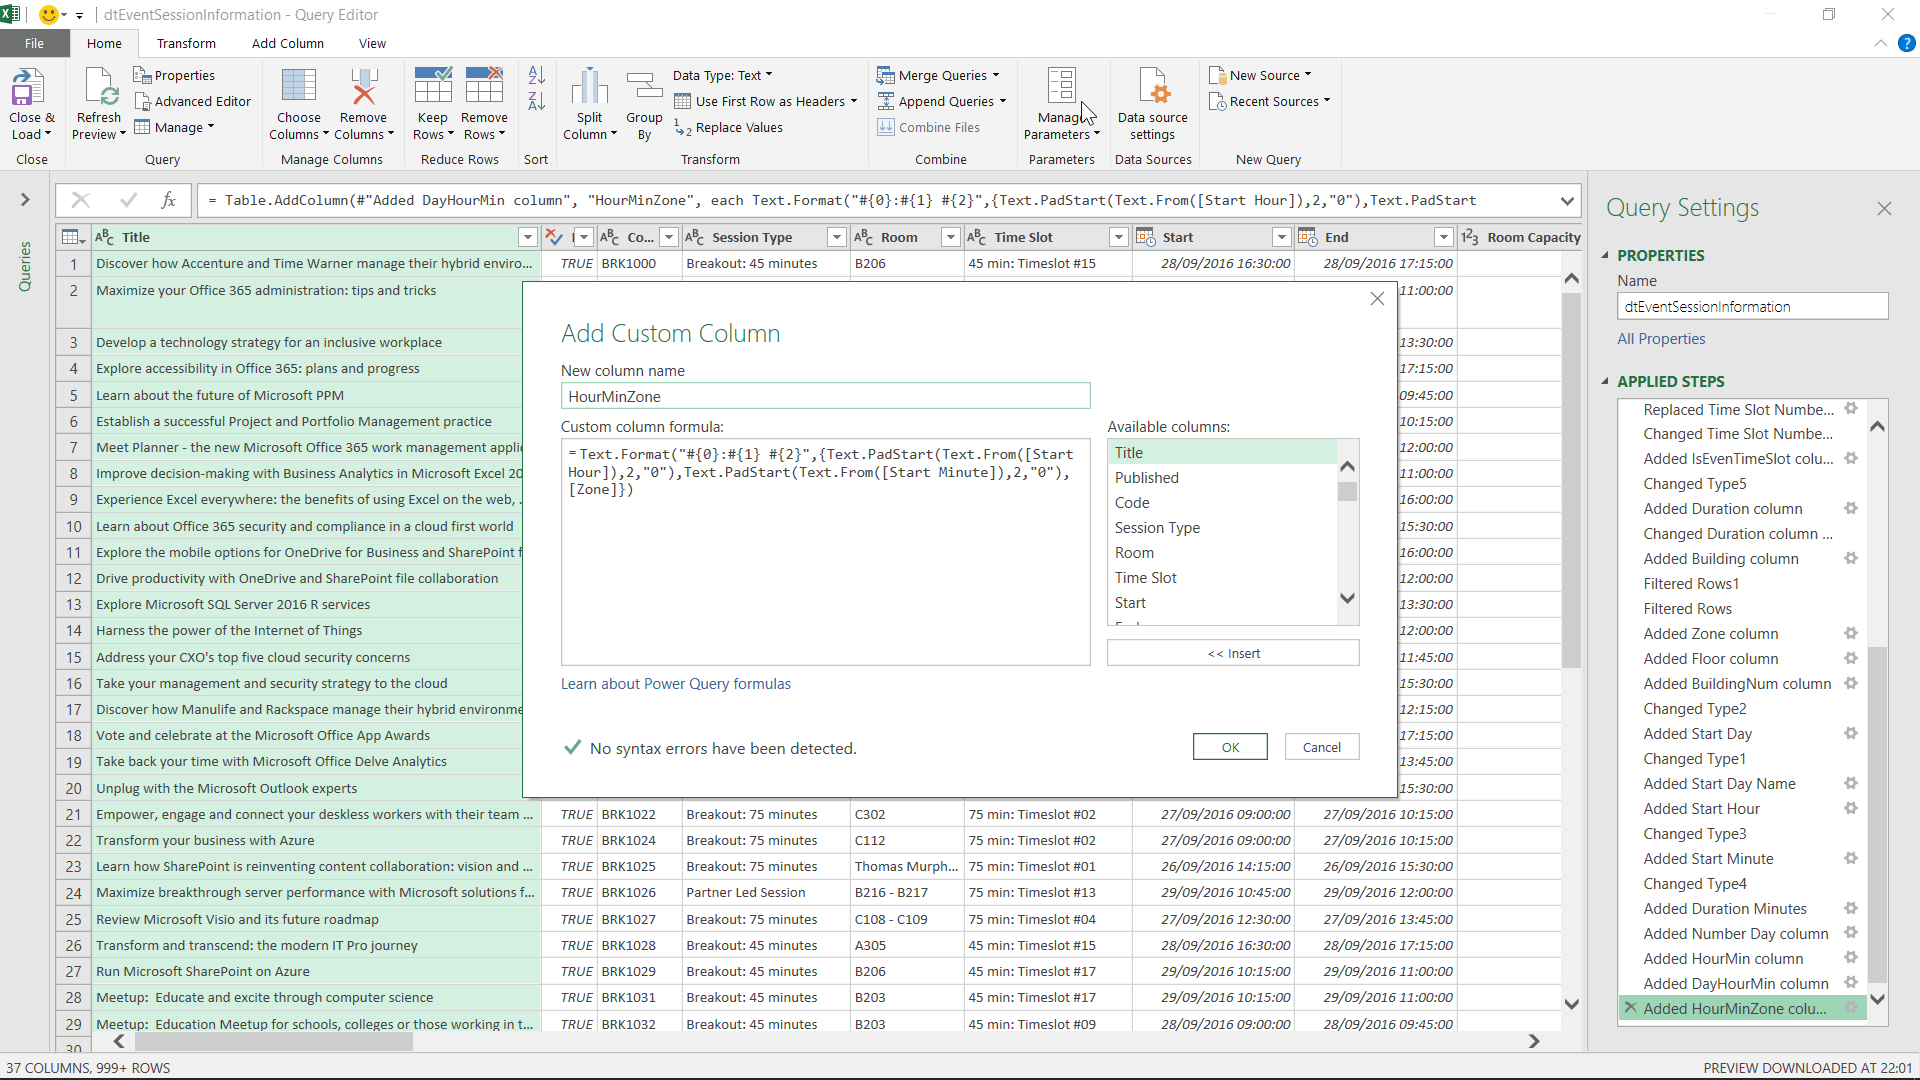
I took the base EventSessionInformation table, kindly provided by the MS Ignite team, and created an Excel workbook full of queries using the fantastic Power Query M Formulas. I did have to amend my queries as I learnt more about how I need to my data to present itself in Power Query. In particular, I created multiple columns to create hierarchies from the room and start time data. This meant that Building, Floor, and Zone were separated out from Room, as was Day, Hour and Minute from Start. I was also able to split out Personas, Products, and Tags into linked tables.
One great advantage of using Excel to create the queries, rather than going direct into PowerBI Desktop, is that the queries can be used by Visio as data sources! I know I said that the older linked data is for OI rather than BI, but it is a great way to create, and update, Shape Data rows in Visio shapes. Any Data Graphics will be suppressed when used in PowerBI, but there is no harm in keeping shapes updated directly. I should add that the Visio custom visual for PowerBI uses Visio Online, but the automatic data refresh capability is not currently available when used in PowerBI, so it is necessary to open the Visio document in Visio desktop to refresh it.
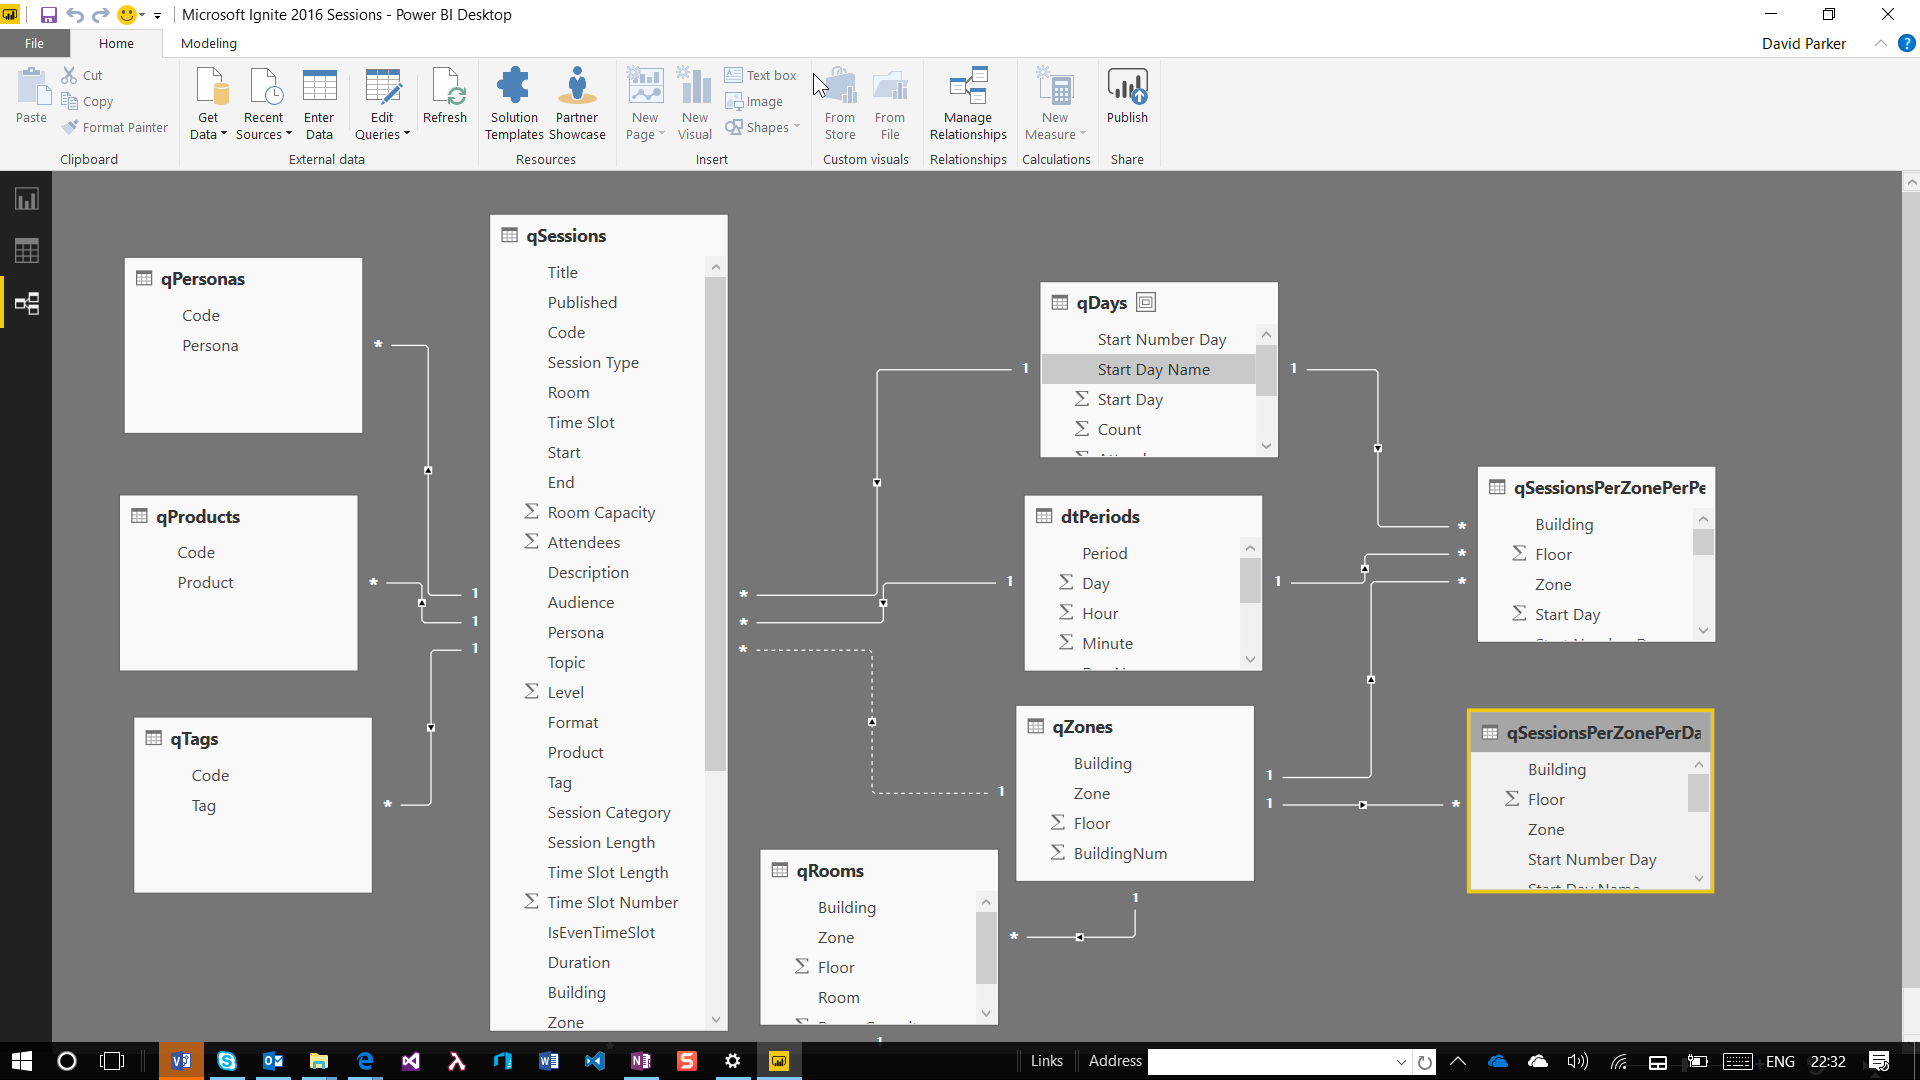
The next step I took was to take the Excel workbook into PowerBI Desktop to check the relationships, data types and how the data worked with the other visuals. Unfortunately, the Visio custom visual does not work with PowerBI Desktop yet (coming soon), and PowerBI web editor does not provide data modeling, so the PowerBI Desktop step is useful currently. When I was happy that the data model was correct, then I could save the model to a pbix file.
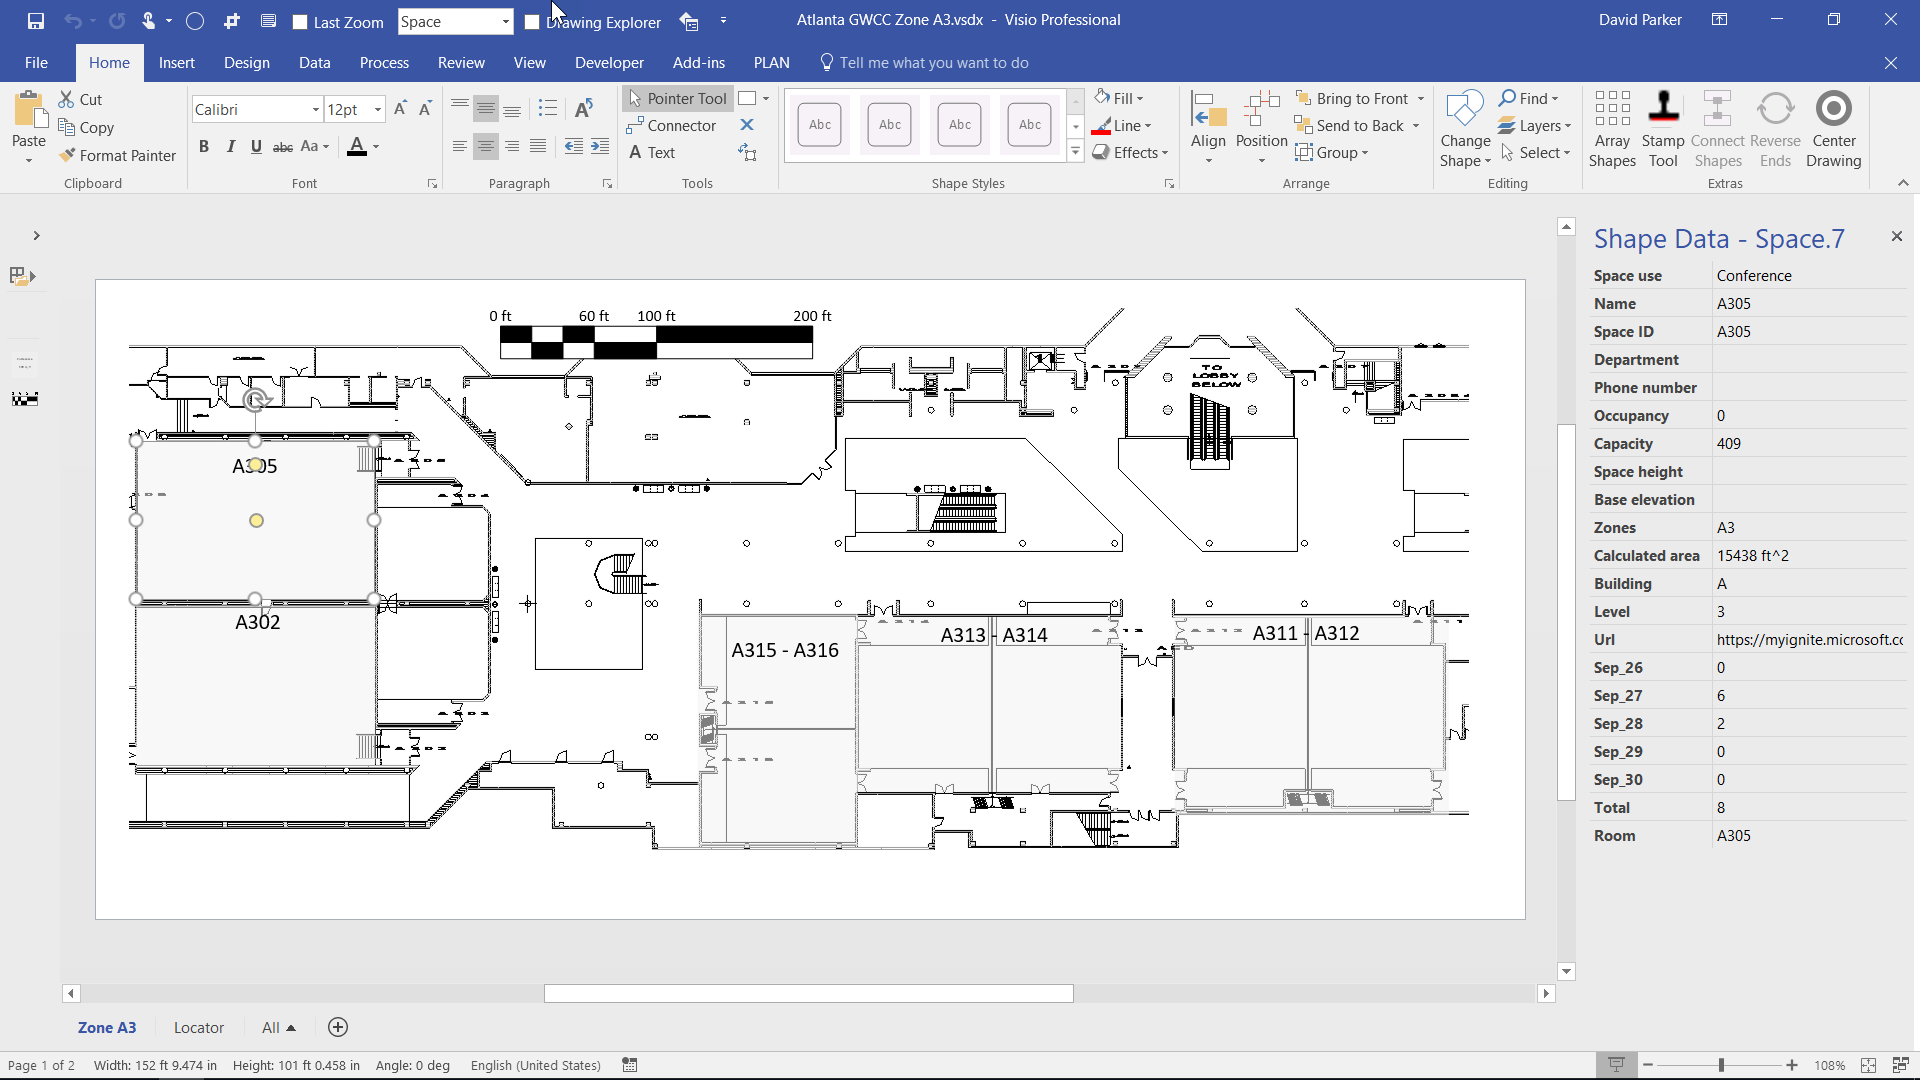
When it came to the Visio drawings that I had previously created, and used with macros within Visio desktop, it soon became clear to me that they were far too busy and colorful. I broke them down into smaller, more focused pages, and reduced them to greyscale.


There are two purposes of a Visio custom visual in PowerBI:
- Filter data in related other visuals when a shape is selected.
- Display text and color in multiple shapes for related data of a value selected in another visual.
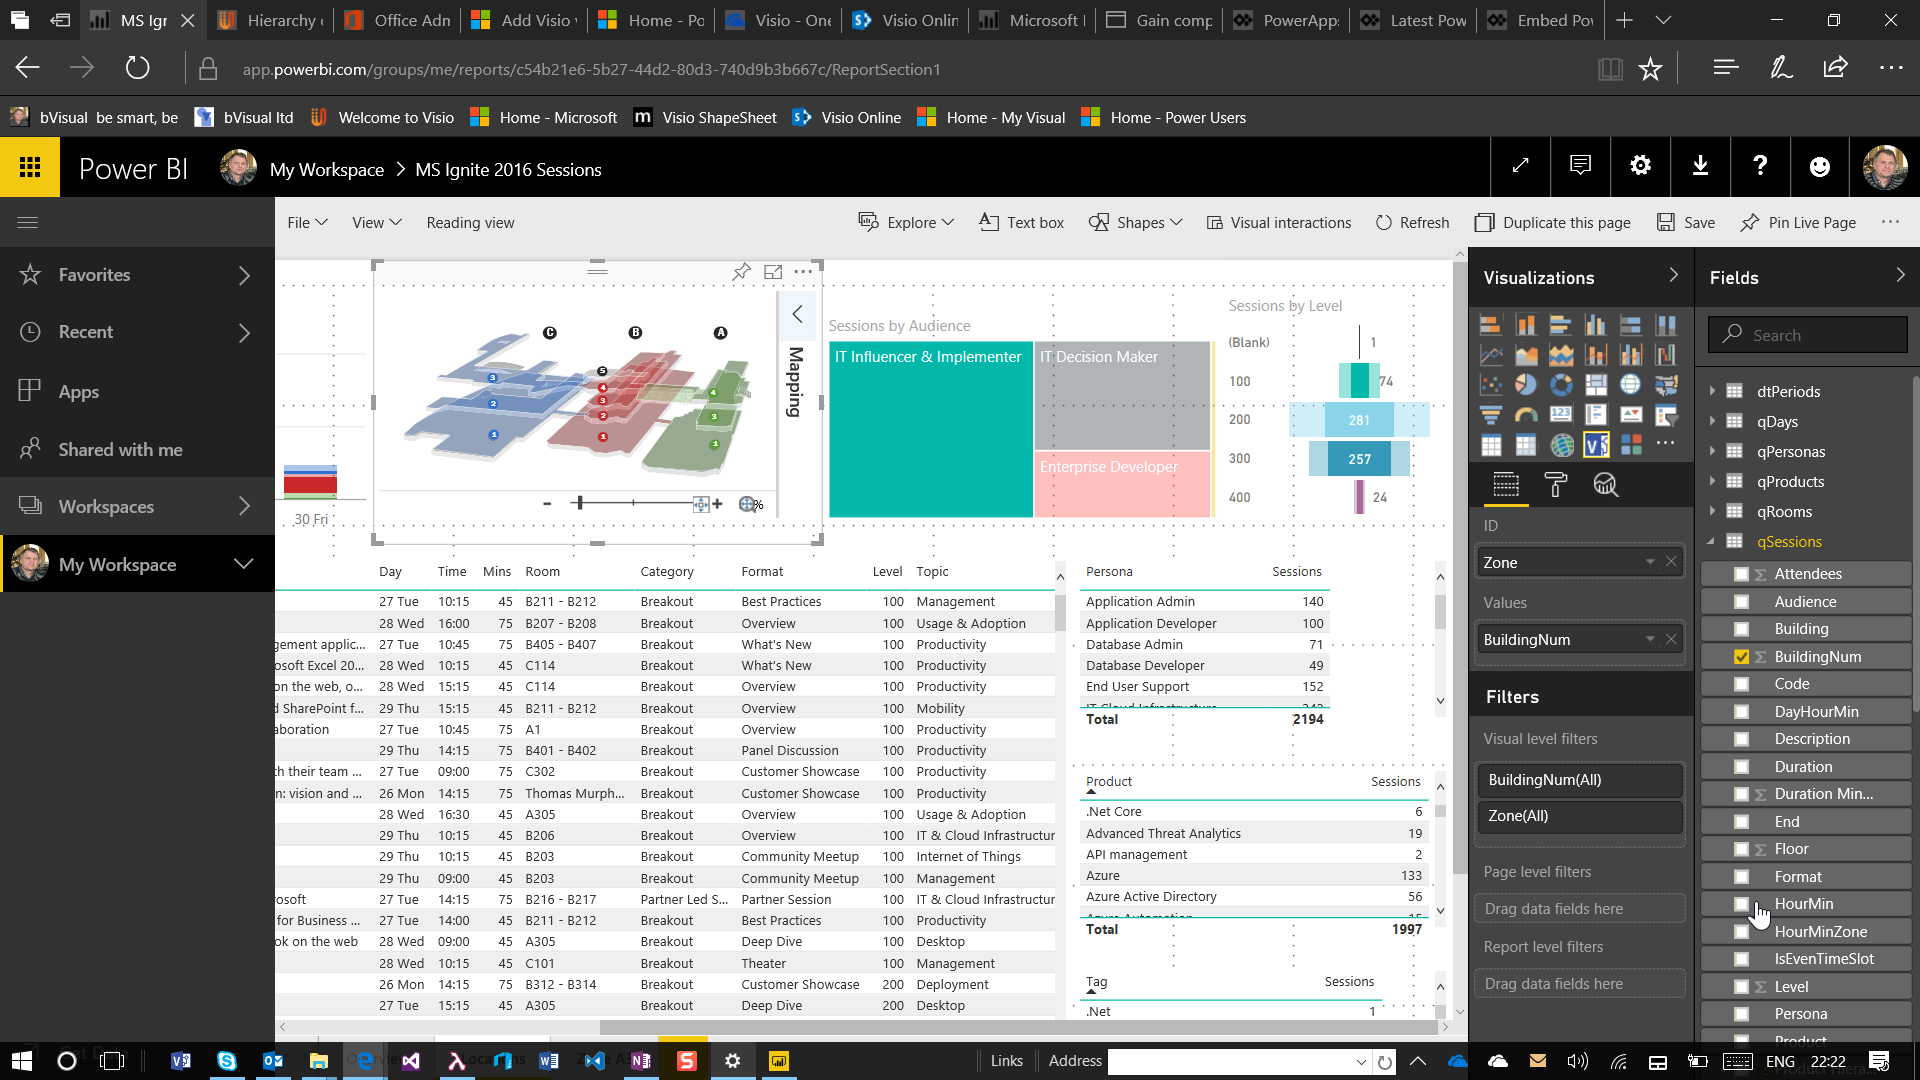
The first of my videos shows the first filter action admirably.
The second video shows that the color and text of each room shape can be changed according to the day and time is selected
These are my current guidelines for Visio documents that are to be used in PowerBI:
| # | Advice | Reason |
| 1 | Reduce file size as much as possible | Speeds up loading |
| 2 | Reduce numbers of colors – preferably grey scale | Let the data overlays apply the color |
| 3 | Remove hyperlinks | They will be followed as soon as the shape is selected |
| 4 | Single page documents | Only the active page when last saved is displayed |
| 5 | Resize page to fit contents | Removes unnecessary white space |
| 6 | Ensure shapes have tightly enclosing bounding rectangles | They will be zoomed to on selection |
| 7 | Ensure shapes have suitable Shape Data values | Links are created to text or Shape Data |
| 8 | Remove Data Graphics | They will be suppressed anyway |
These could change over time, as the Visio custom visual develops.
I would like to thank two fellow MVPs for their inspirational blog posts:
- Chris Webb – Chris Webb’s BI Blog
- John P White – The White Pages
Other inspirational pages:
Microsoft Visio team – 6 Visio Power BI examples
Great work guys! Keep it up!