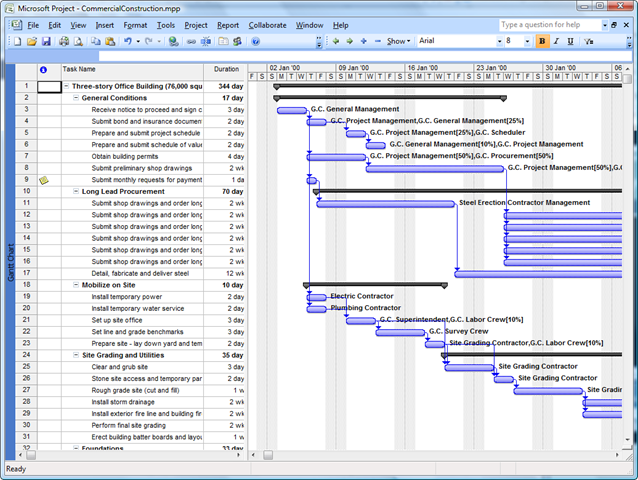
A recent newsgroup question asked if it is possible to create shapes in Visio 2007 that are linked to tasks in a timeline in Project …. without lots of coding! Well, that sounds like a challenge that I can’t resist, so here goes!
First, I am using Microsoft Project 2007 and I have loaded the Commercial Construction sample project that is in the Visio SDK.
The first part of the process is to export the project to a suitable format that can be used as a data source in Visio 2007 Pro. I chose to Save As a Microsoft Excel Pivot Table, and selected the Tasks type of data. I then chose to Base on Table … Rollup Table:
- Print Setup / Printer paper = Landscape
- Drawing Scale / Pre-defined scale = Metric / 1 : 2.5
- Page Properties / Measurement units = Days
I then selected Data / Link Data to Shapes, and selected the Excel Workbook that I just created, and chose Task_Table1$ as the range. I selected Next, accepting the default for the Columns and Rows, but I added Resource_Names to the Unique Identifier, as well as the ID …
After selecting Finish on the Data Selector, I dragged the first record onto the empty page, and dropped it.
I ensured that I had Developer Mode ticked in Tools / Options / Advanced. Then I defined a new Shape Data row, called EarliestDate, for the page. This needs to be set as a Date Type row.
I then opened the ShapeSheet of the rectangle, and amended the following cell formulas:
- LocPinX = 0
- PinX=GUARD((Prop._VisDM_Start_Date-ThePage!Prop.EarliestDate)*(ThePage!PageScale/ThePage!DrawingScale))
I then altered the X fomulas in the second and third rows of the Geomtery1 section with the following:
=GUARD((Prop._VisDM_Finish_Date-Prop._VisDM_Start_Date)*(ThePage!PageScale/ThePage!DrawingScale))
This has the effect of altering the width of the coloured rectangle, without changing the width of the shape. This is important because the width of the Visio 2007 Data Graphic is linked to the width of the shape …. something that has been fixed in Visio 2010.
I then opened the Shapes Document Stencil so that I could drag the Data Linked rectangle onto it.
I then deleted the existing Rectangle master … it is no longer needed.
I could then select the new Master, and drag and drop rows from the External Data window onto the page, knowing that the horizontal position is linked to the start date, and the width of the coloured rectangle is linked to the duration.
