


Learn how to visualize information with Visio desktop
Get full details on the powerful features of Microsoft Office Visio 2007 inside this comprehensive volume. Written by Visio expert David Parker, Visualizing Information with Microsoft Office Visio 2007 demonstrates how to effectively visualize, explore, and communicate complex business information. Learn to use Pivot Diagrams, Data Graphics, and Smart Tags, as well as link data to shapes and create meaningful Visio documents and reports. Plus, you’ll get vital security information, time-saving tips, troubleshooting techniques, and downloadable macros and code samples.
Who this book is written for:
This book is aimed at the departmental-level operational or business intelligence professional or Microsoft Office power-user who wants to create data diagrams with Microsoft Visio that can accurately represent business information visually.
What you will learn from this book:
- Create shapes and link them to data
- Summarize and analyze information using PivotDiagrams
- Use Data Graphics, Smart Tags, and SmartShapes to reinforce information
- Generate robust Excel, HTML, and XML reports
- Create custom, reusable templates, stencils, and masters
- Update and enhance diagrams with Reviewer’s comments and markups
- Integrate Visio diagrams with other Windows applications
- Publish and securely distribute Visio documents and summaries
- Extend functionality using VBA macros, add-ins, and wrapper applications
More Information
Table of contents
- Chapter 1. Review of Basics
- Chapter 2. Shape Data and User-Defined Cells
- Chapter 3. Data Linking to Shapes
- Chapter 4. Connecting Items to Each Other
- Chapter 5. Summarizing Information with PivotDiagrams
- Chapter 6. Database Wizard
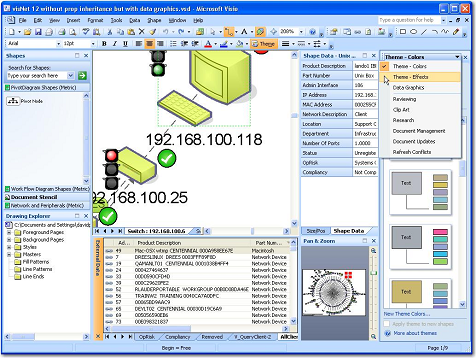
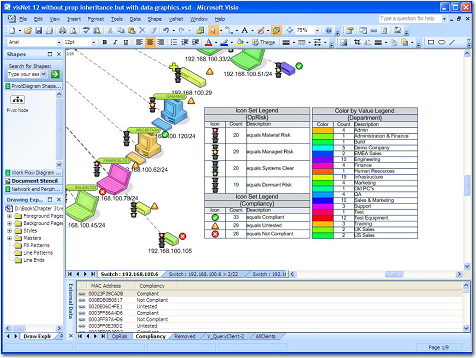
- Chapter 7. Using Data Graphics to Reinforce Information
- Chapter 8. Using Smart Tags and Actions
- Chapter 9. Creating Reports
- Chapter 10. Themes, Backgrounds, Borders, and Titles
- Chapter 11. Creating Custom Templates, Stencils, and Masters
- Chapter 12. Reviewer’s Comments
- Chapter 13. Preparing for Publication
- Chapter 14. Using Code to Enhance Functionality
- Chapter 15. Document Management and Security
- Chapter 16. Scenarios
- Chapter 17: Epilogue
- Index
Chapter 1. Review of Basics

In this chapter
- The Visio Installation
- Different Editions of Microsoft Visio
- The User Interface
- Types of Visio Documents
- Types of Visio Pages
- Mastering Visio Shapes
- To Scale or Not to
Microsoft Visio is a data diagramming application that can be used for schematic or measured drawings. Visio is a general purpose tool that can be customised for particular tasks to focus the user’s attention. It can also be programmed to create diagrams automatically from data supplied to it. The user can create many different categories of drawings with Microsoft Visio, but the ones I am interested in are those that contain data. Visio can provide a graphical representation of data, and it can be used to create it. This book is neither a beginner’s guide to Visio—plenty of them should be around—nor is it a tutorial for graphic artists. Instead, it is intended for those who want to represent or model data visually, and for the myriad of budding developers who want to set up categories of drawings for others to use.
Before we get into the nitty-gritty of this, we should take a moment to check that you have a basic understanding of the anatomy of Visio. Without this, you may go off on a road to nowhere.
Chapter 2 : Shape Data and User-Defined Cells

In this chapter
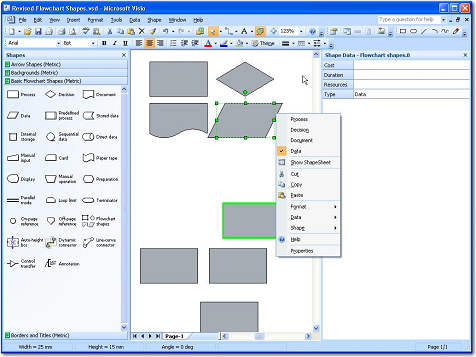
- Creating Shape Data
- User-Defined Cells for Data
- Using ShapeSheet Formulae
- Creating Intershape References
- Right-Mouse Menu Items from Shape Data Lists
Shape data, or custom properties, as it used to be called, is the key to visualising information with Microsoft Visio. If you want to see the information stored in a shape, or to use the built-in reporting, then you need to become familiar with shape data. If you want to have hidden information or to build in formulae that change shape data or parts of the graphics, then use User-defined cells. You can even use the right mouse menu to change shape data values by using the Action cells.
At times, you need to be able to edit shape data but, at other times, you need only to view it, or you may even want to make selected shape data invisible. You may want to have drop-down lists to select from, with the content of the list changed, depending on the value selected in another list. You can change the color of all or parts of a shape, or even change the appearance of a shape, in response to the value in a shape datarow.
Customizing Visio shapes to suit your requirements reduces the time needed to create data diagrams, provides you with your corporate look and feel, and increases the insight of your audience.
Some tools within Microsoft Visio can create shape data automatically, so you need to understand what they are doing, so you can use them to your best advantage. Somesections in the ShapeSheet are always there because they are required for every shape but, others, such as Shape Data, User-defined cells, or Actions are only created when they are required. Every cell can be identified by name or its Section Row Column (SRC) value.
Chapter 3 : Linking Data to Shapes
In this chapter
- Creating Linked Data
- Labeling Shapes from Shape Data
- Enhancing Shapes with Color, Icons, and Data Bars
The Link Data to Shapes tool is the backbone of the new features in Microsoft Visio 2007. It may not have the immediate impact of the flashy Data Graphics tool, but they are of no use without the data in the shapes in the first place. The data in Visio is what makes it so suitable for use as a corporate tool. The Link Data to Shapes tool is only for viewing information from a data source—it does not let you edit the data, and then update the data source. The older tool, Database Wizard, has that capability, but Link Data also allows a shape to be linked to multiple data sources. This is a crucial difference because it means you can overlay, say, a list of designated fire marshals from a departmental spreadsheet on personnel shapes from the corporate HR database. Then, if your personnel are laid out on a floor plan, you could use the new Data Graphics tool to highlight the fire marshals, and you can visually check that their distribution is satisfactory. Similarly, you could identify PCs that are missing a required software patch.
The list of useful scenarios for simple visualization of data is endless, but their usefulness is constrained by the veracity of the supplied data.A variety of types of data can be linked to Visio, including Microsoft Excel, Microsoft Access, Microsoft SQL Server and SharePoint Services Lists, or any suitable OLEDB or ODBC data source. Although you can easily link to Microsoft Excel, I prefer to use a data source that can identify the data type in each column explicitly. In particular, I have had trouble where a few numbers, as well as text, were in a single column.