bVisual Blog by David Parker
From Seattle to Orlando in 21 years


I was going through my wardrobe the other day, and found my speaker shirt from the Visio Solutions Conference in 1997. This was the first time that I spoke about my use of Visio in the workplace. Back then I was automatically creating dealer desk layouts from a Sybase database for a major bank in London. Next week, I will be at MS Ignite in Orlando, demonstrating how Visio and PowerBI can provide a searchable, updatable dashboard of a data center. If you are there, then I would be delighted to meet you.
Adding clicks to infographics with Visio visual for PowerBI
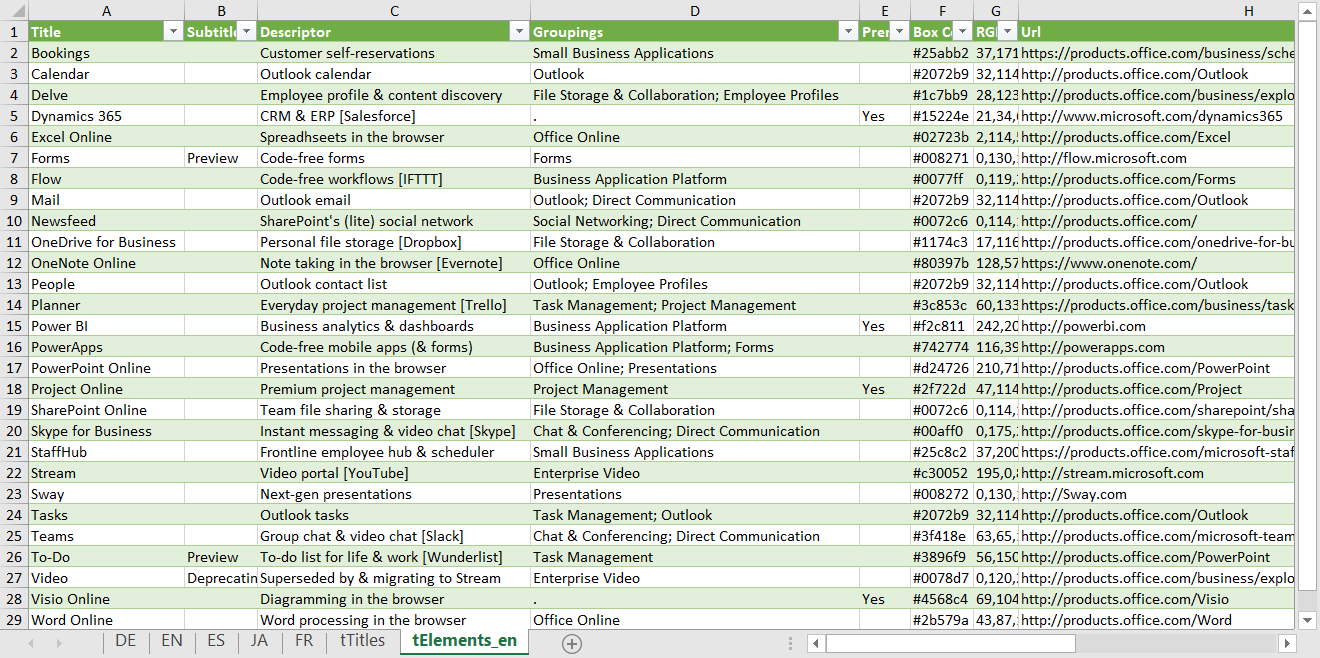
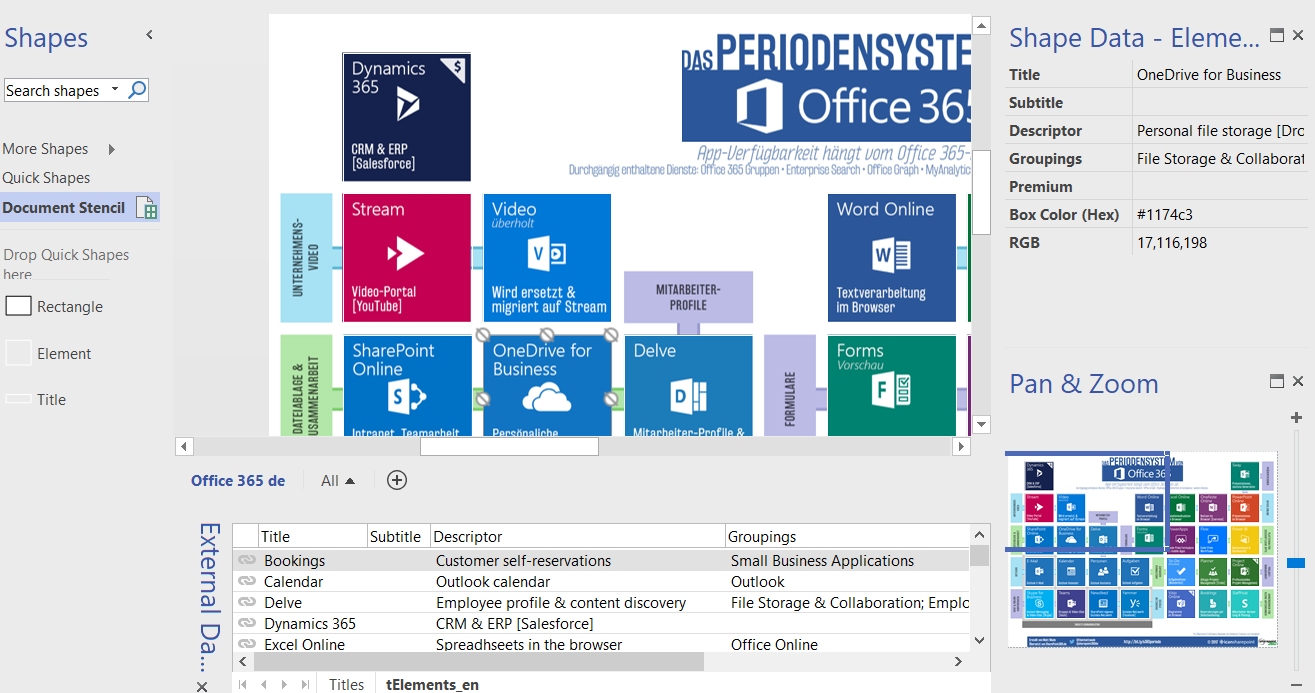
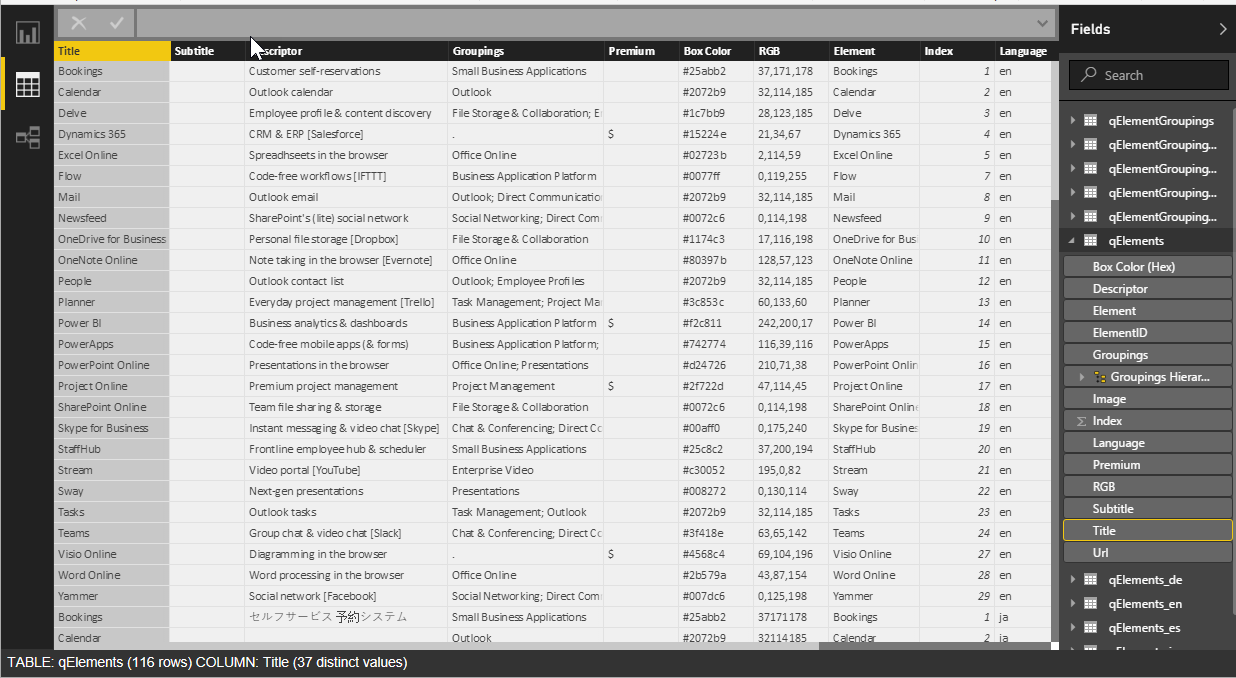
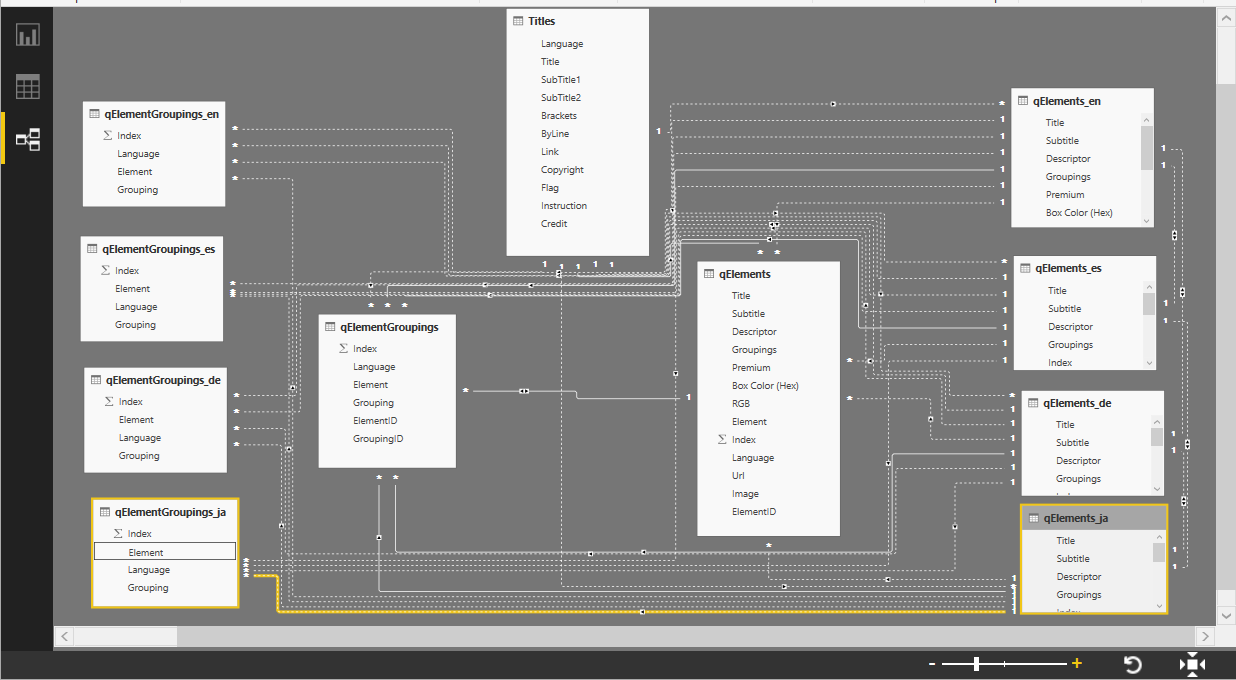
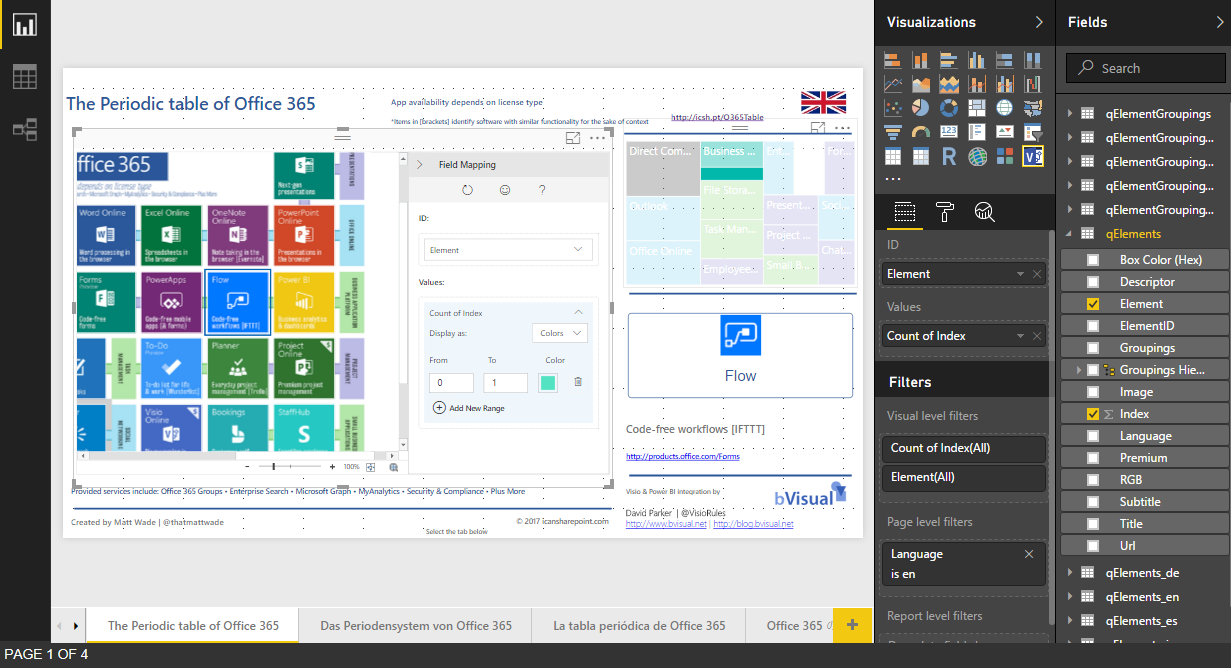
Office 365 is a truly remarkable success story, but it is often difficult to understand what each of the parts actually do, or what it is actually in each edition. Microsoft are always adding applications and services to the various editions, or retiring ones that have been superseded. If I can’t see it, I can’t understand it, so I was very interested to see the Periodic Table of Office 365 infographic created by Matt Wade, a SharePoint guru who keeps an eye on these changes ( see http://icsh.pt/O365Table ). It really helps in comprehending the current Office 365 applications and their purpose. Indeed, I have seen his graphic go through many iterations over the last few months, and it will continue to change. However, it was not clickable, and I am a visual data guy, so I contacted him, and offered to integrate his infographic into a Power BI now that the Visio custom visual is available. I then found out that there are several different language versions of his infographic out there on the web, translated by other SharePoint professionals in his network.
[Read more…] about Adding clicks to infographics with Visio visual for PowerBI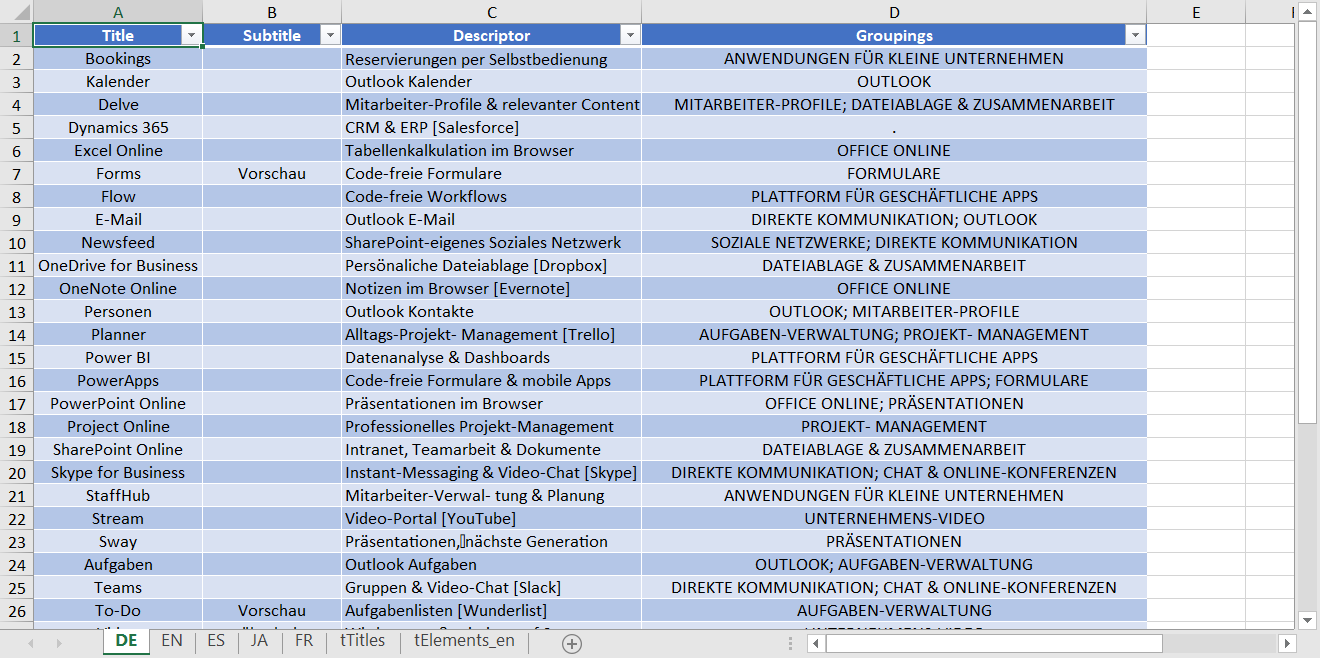
Updating data sources from Visio using MSFlow … easily!
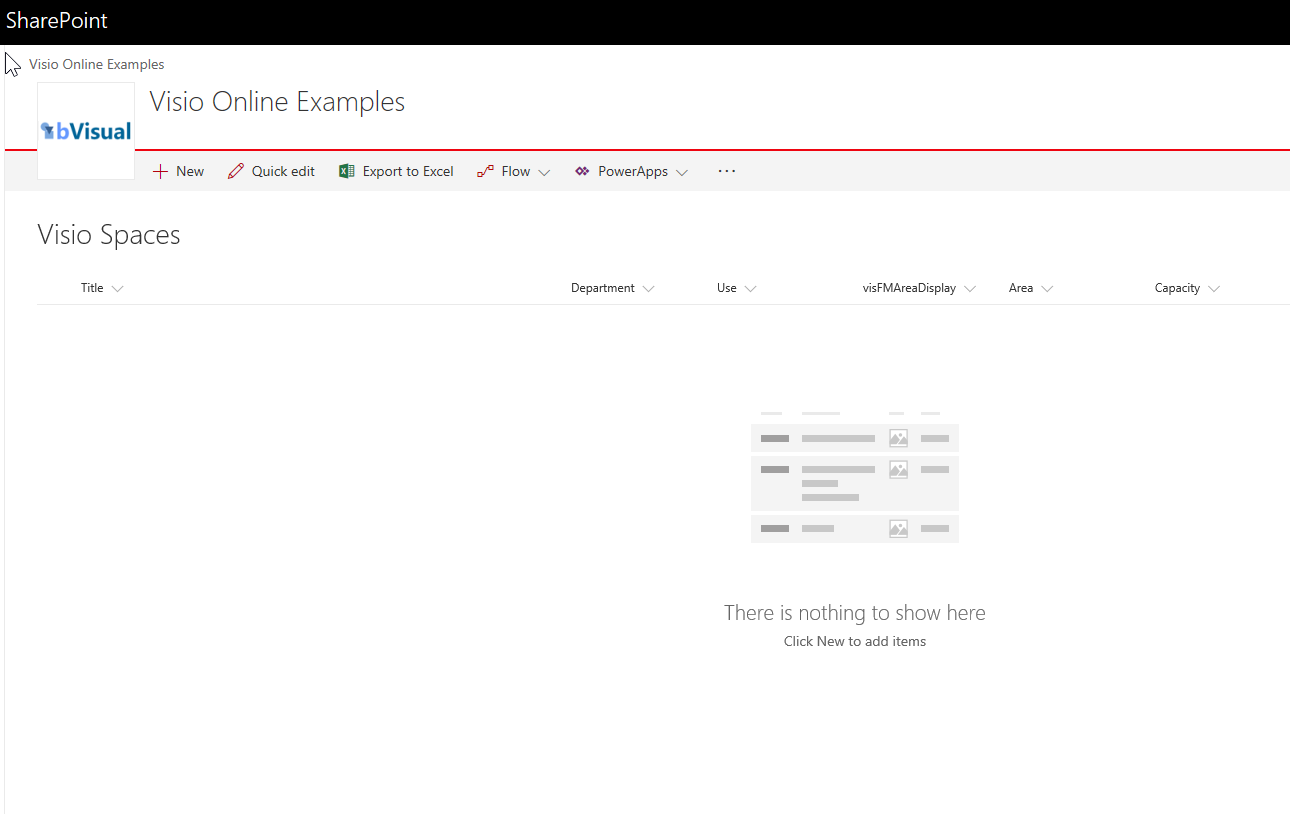
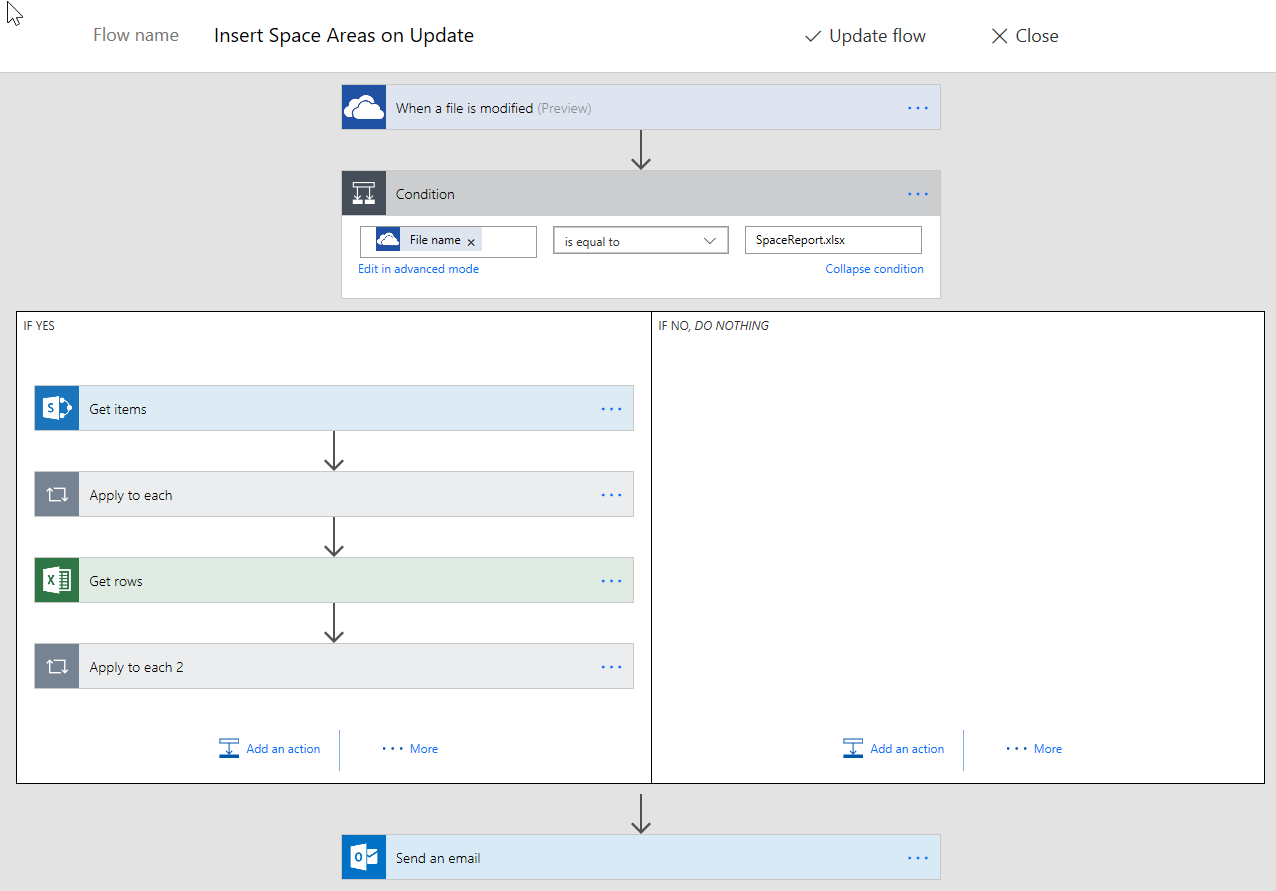
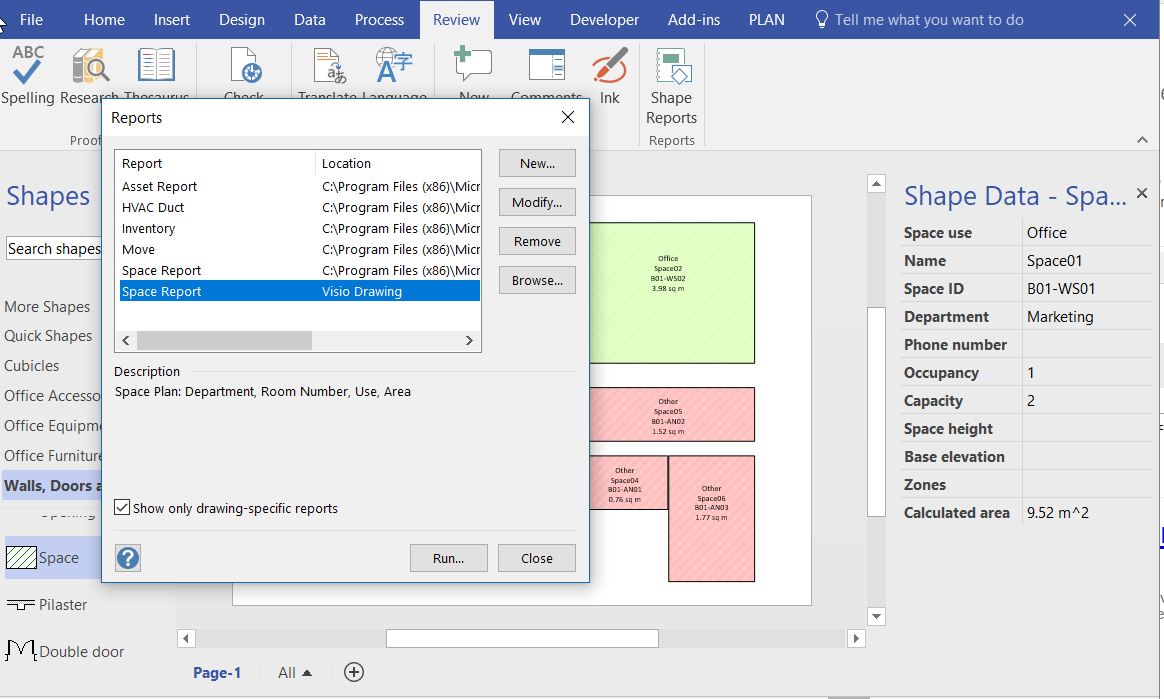
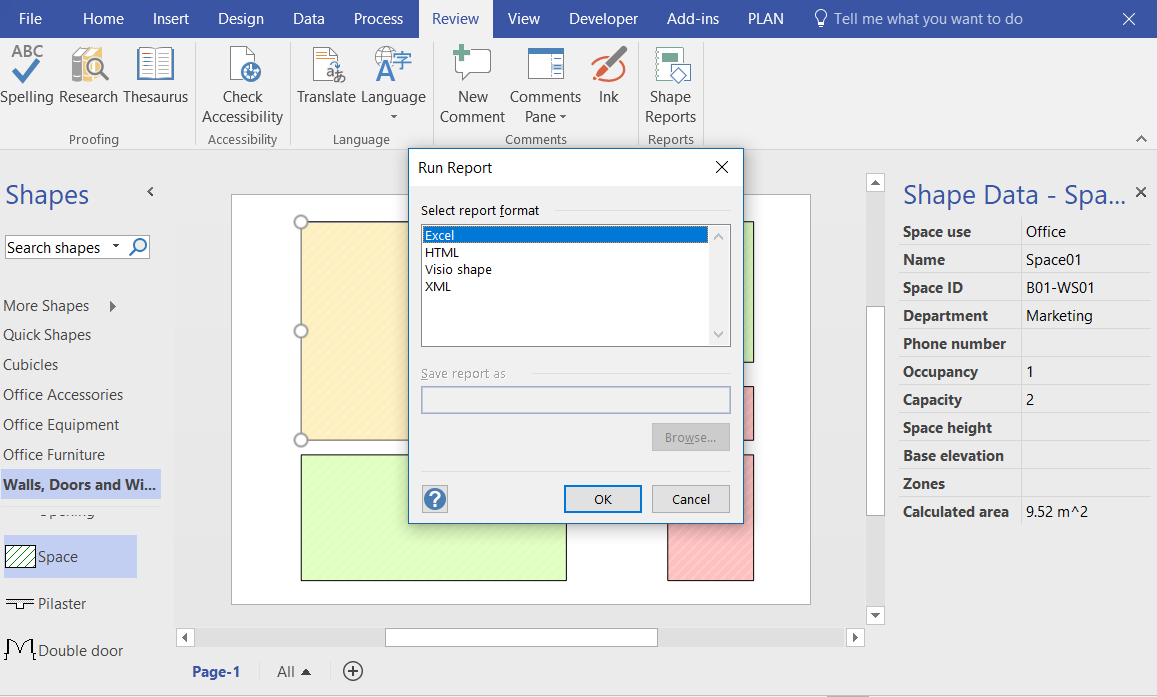
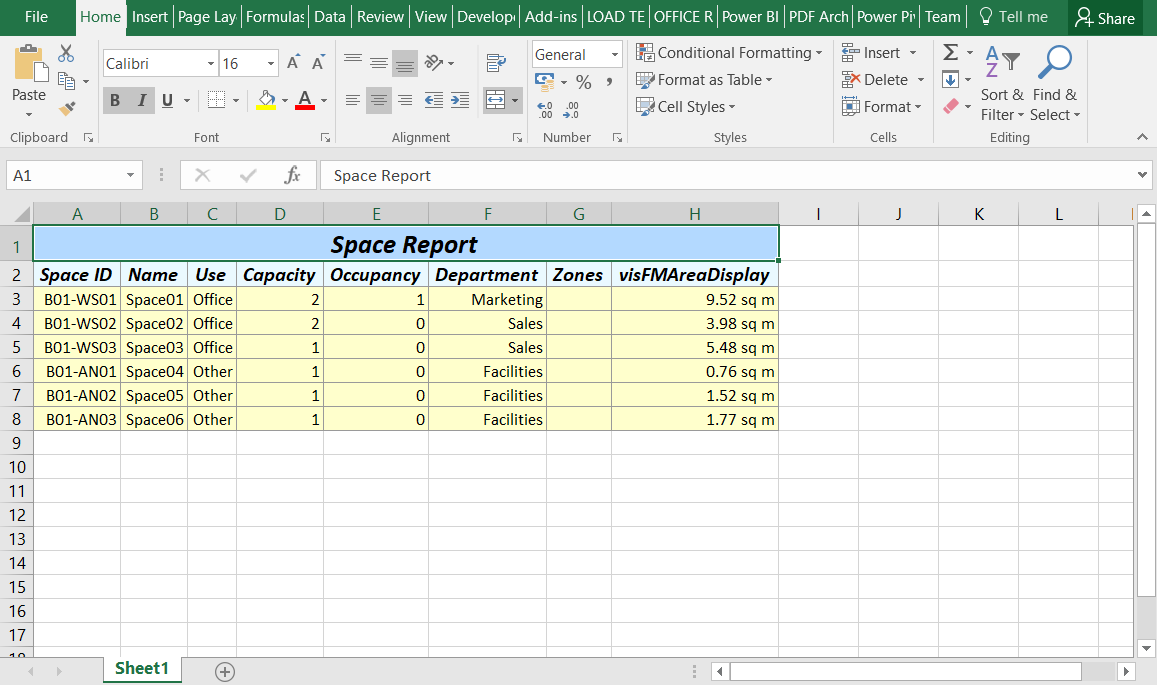
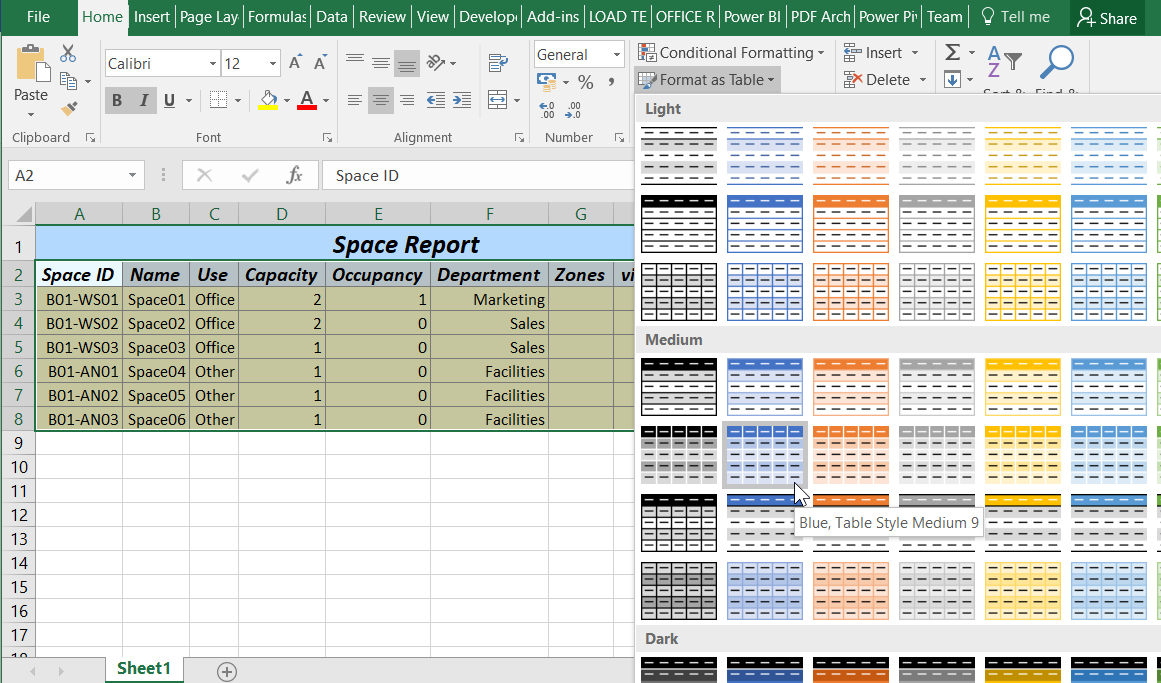
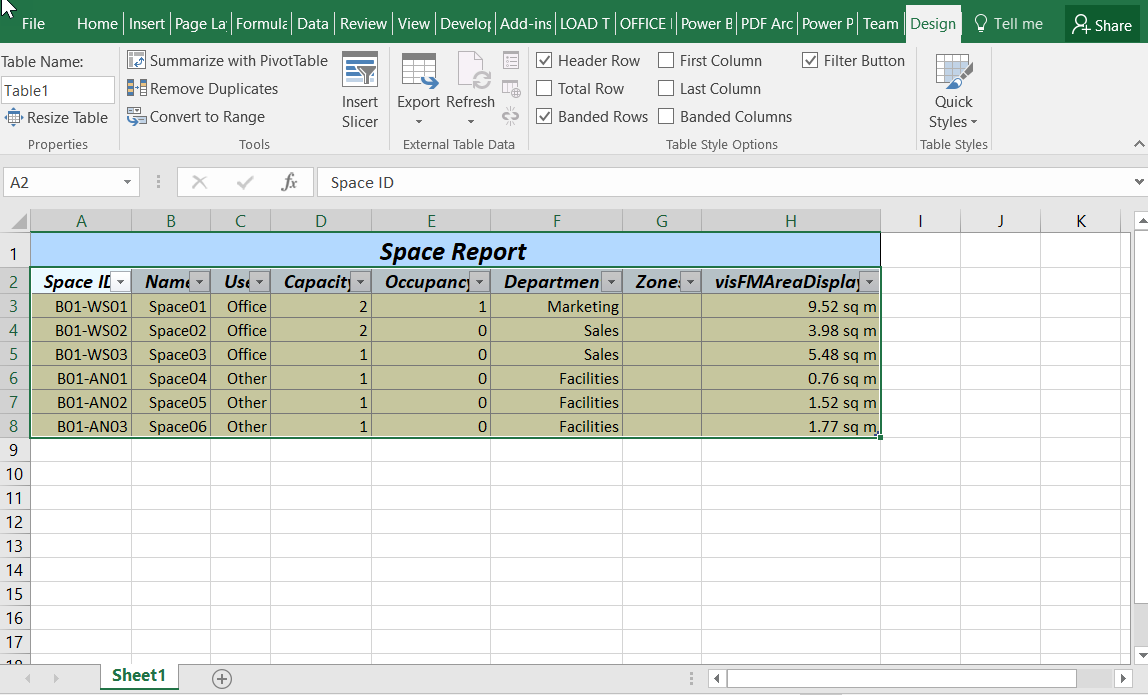
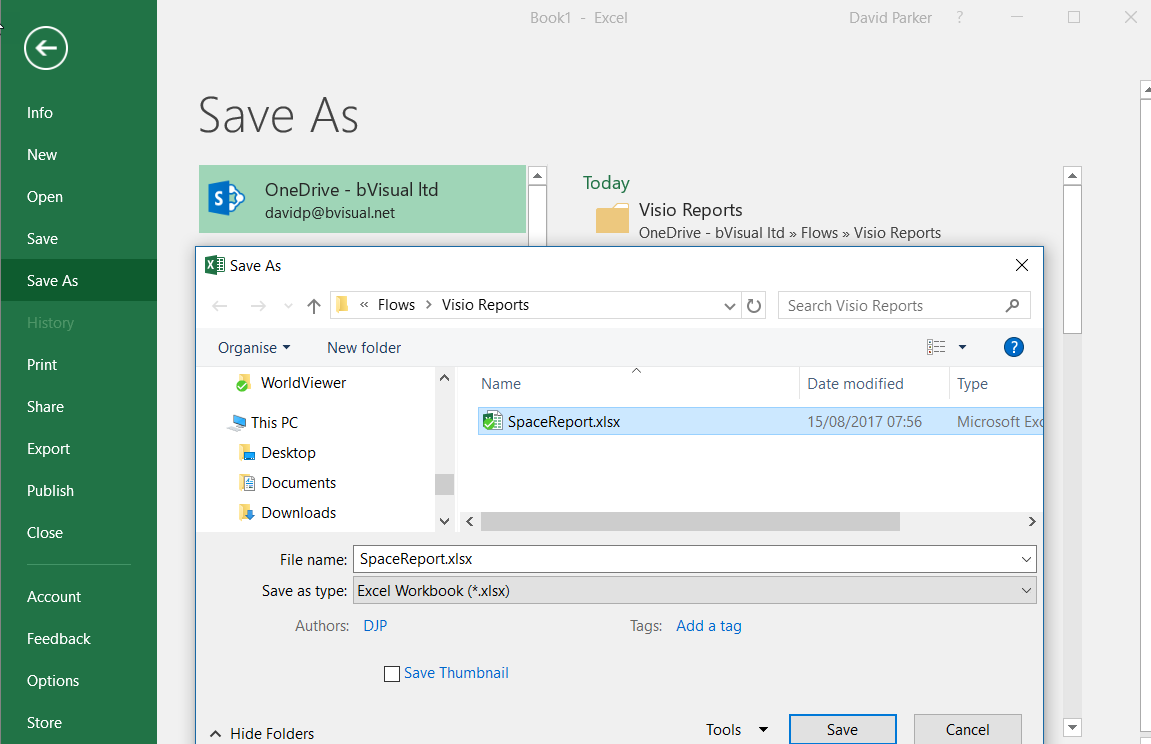
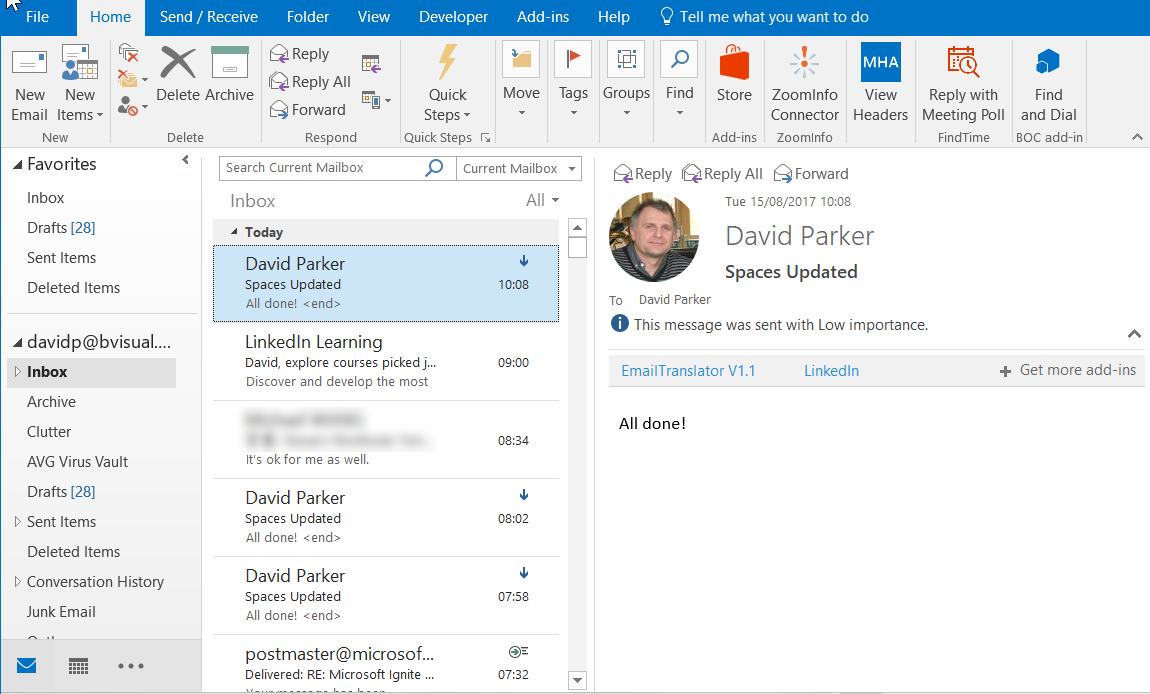
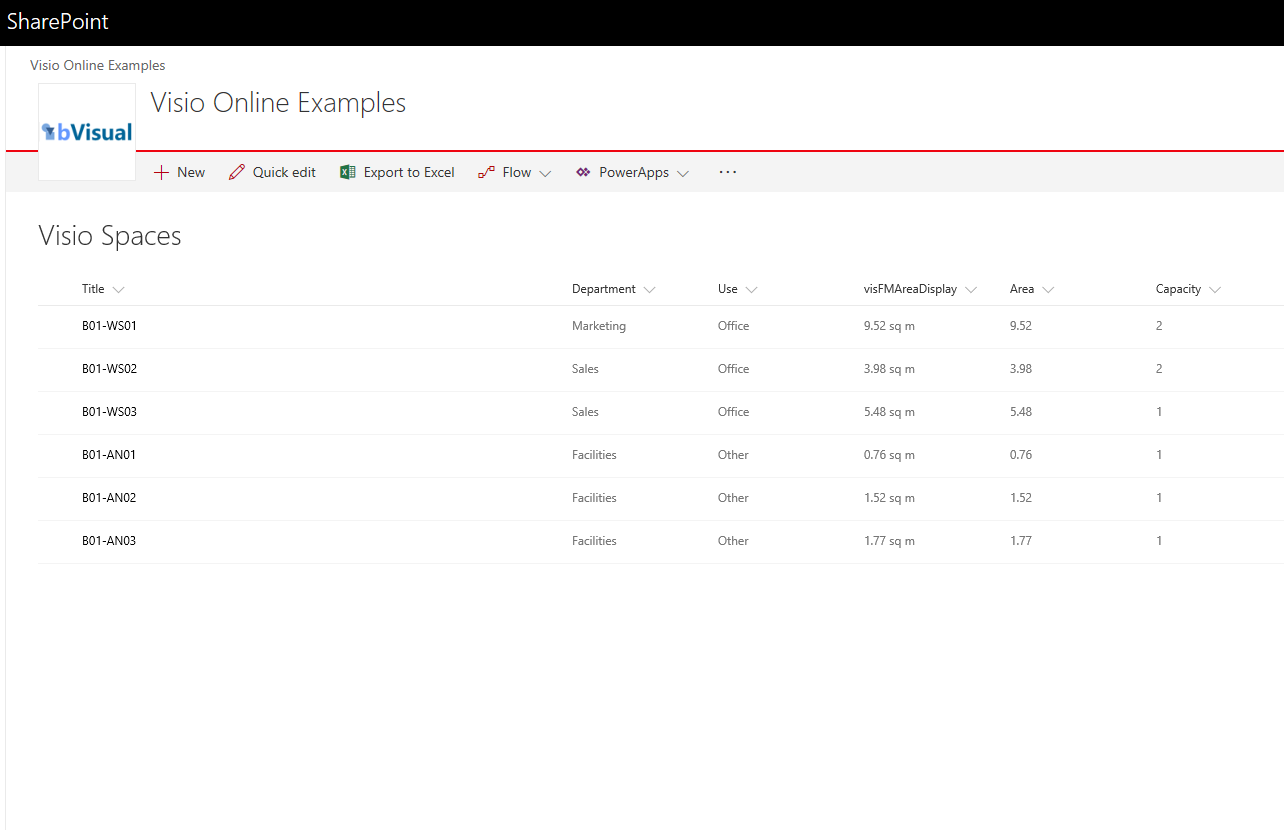
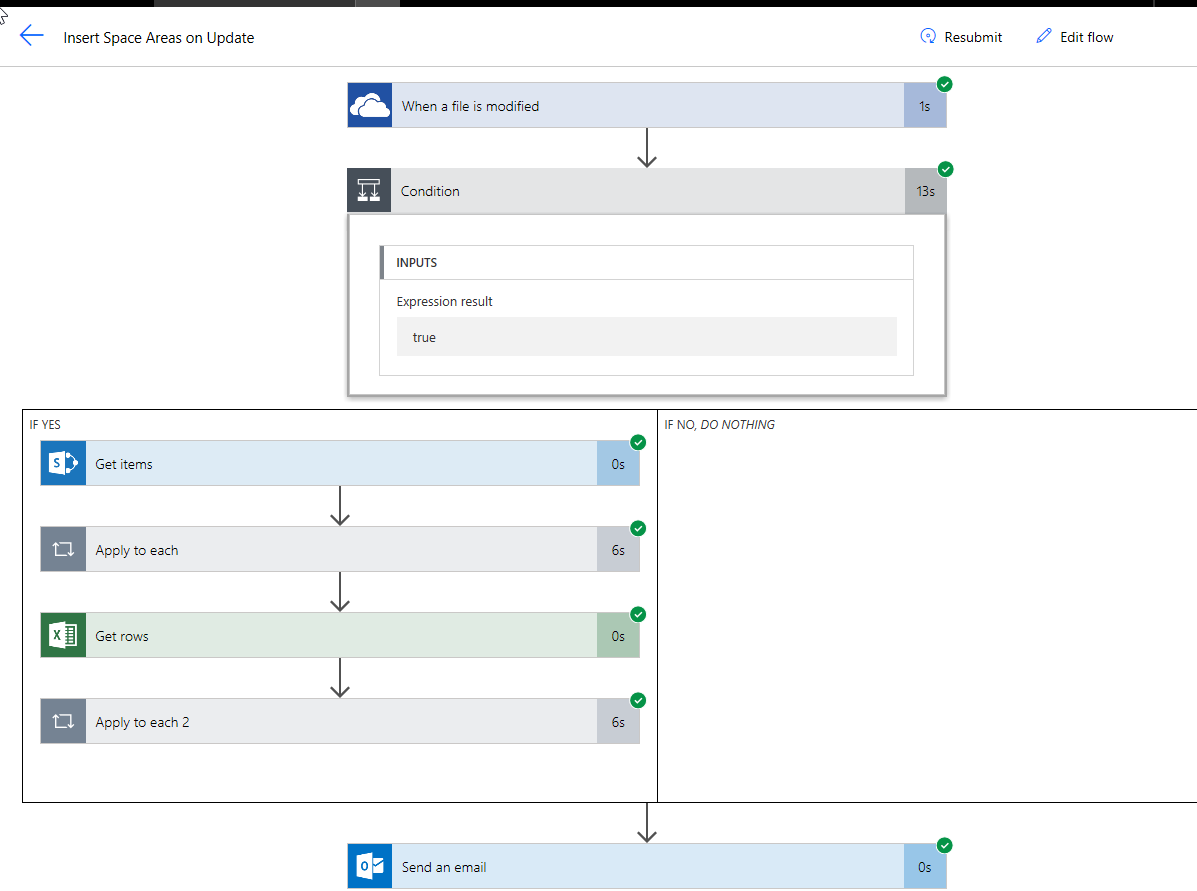
Most of my posts have been about using Visio as a data consumer by linking Visio shapes to data, but Visio can be the best place to create some data from. For example, an office layout can have personnel or equipment shapes within a workstation area, or space shapes are used to define areas which are used for calculating the space usage chargeback reports. There are non-facilities management related examples too, as the only consideration is what is the best way to create relationships, measure lengths, or calculate areas. These are all tasks that are best done by just moving, resizing, connecting or containing shapes interactively in the Visio interface. In this article I will explain how Microsoft Flow can be used update a data source simply from a Visio document.
[Read more…] about Updating data sources from Visio using MSFlow … easily!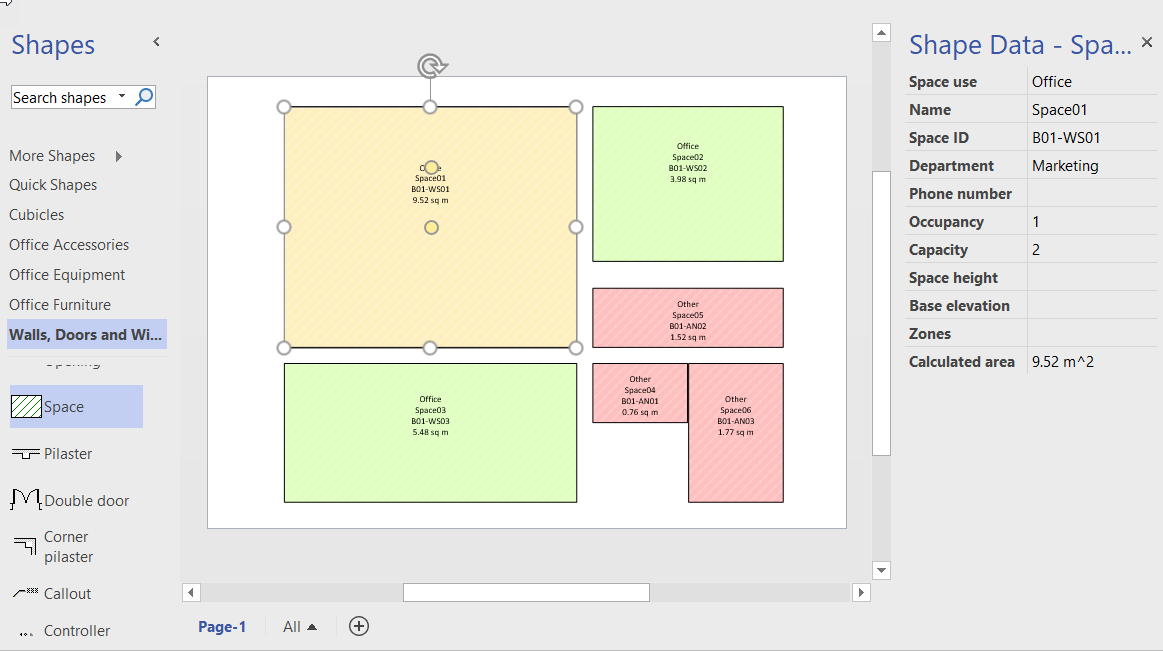
Previewing the Visio Custom Visual in PowerBI
It is time to talk about the new Visio custom visual for PowerBI. You may have read about it at Visio Power BI example and Add Visio visualizations to Power BI reports, but I wanted to add my findings. First, it is great to see this feature, but it is not yet the finished article. However, I hope I can show that it can be an extremely useful addition to the business intelligence toolset from Microsoft. I think that the existing Link Data to Shapes and Data Graphics features in Visio desktop are considered to be Operational Intelligence capabilities, whereas this new custom visual for PowerBI is definitely Business Intelligence. This is a different discipline, and I have been developing some guidelines for good practice when using Visio with PowerBI. In this article, I will demonstrate how I created a PowerBI dashboard using graphics and data from last years Microsoft Ignite conference.
Let me set the expectations because I am working with a preview of the Visio custom visual.
[Read more…] about Previewing the Visio Custom Visual in PowerBIMS TechDays Sweden 2016 – Visio and SharePoint BPM portals
I am on my way home after presenting and demoing Visio and SharePoint BPM portals at Kistamassan near Stockholm. I was staying at the Scandic Victoria Tower right next door. Very handy, and very tall. It is a striking building, as can be seen in my photos below, however, speaking as an ex-architect, I was disappointed to find the modern interior spoilt by large, but inadequate, curtains that took several minutes to draw over the large number of triangular windows in my room. I really think it would have been worth installing electric auto-tinting glass.
[Read more…] about MS TechDays Sweden 2016 – Visio and SharePoint BPM portals