

Well it is over for another year, and what a year it has been for Microsoft Visio! I am exhausted from making 3 presentations and being on the Visio booth for the last 4 days, but it has been worth it just to hear the love people have for Visio, and to see their faces when they see the new features and capabilities!


Key highlights of new features:
- Visio custom visual for Power BI – this is going to open up lots of business scenarios
- Visio Online with basic diagram creation and lots of templates launching next month
- Data Visualizer to automatically create various types of diagrams automatically from Excel, including refresh
- Slide Snippets providing automatic PowerPoint presentations with morphing transformations
The last two features are in Visio Pro for Office 365 only, but a new perpetual Visio version, Visio 2019, was also announced, and it will be available in fall 2018.
Many users were delighted that Visio Online viewer now provides free visibility of Visio files (if stored on OneDrive for Business or SharePoint Online). It was clarified for me that the Visio Web Access control remains the Visio document viewer for SharePoint on Premise.
A few users had complaints that they had upgraded to Office 365 and their copies of Visio with perpetual licences are not compatible. Well, apparently, there is a way to upgrade to the Click 2 Run version, so these users should contact their Microsoft rep if slide 20 in PowerPoint presentation doesn’t help.
Finger Foods demonstrated Visio diagrams with HoloLens … looks very interesting! In this case, the demo was a piping and instrumentation diagram highlighting where problems arose.
Visio Sessions
These are the key Visio presentations:
Achieve Digital Transformation with Microsoft Visio: Innovations and Roadmap
Today, the changing macro environment, shorter innovation cycles and silos of knowledge present tremendous challenges that require every business to transform. Leverage Microsoft Visio as your change agent to drive successful digital transformation. Learn how Visio can help your organization visualize and align on future blueprint, stay on top of operational insights, and collaboratively define processes and drive change management.
Dive into data visualization with Microsoft Visio
We share best practices to visualize complex information using data-driven diagrams that business users can relate to, present KPIs on top of real-world processes and plans, and set up layered dashboards decision-makers can drilldown for actions. With the operational insights, you can track process KPIs, understand team capacity and production outages at one glance.

Build data-driven solutions using Microsoft Visio
Learn to create data-driven solutions using Microsoft Visio, one of the most advanced diagramming and vector graphics tools for desktop and the web. Key features include additional templates for more advanced diagrams and layouts, as well as capabilities intended to make it easy for users to connect their diagrams to data sources and to display their data graphically.
PowerPoint presentation
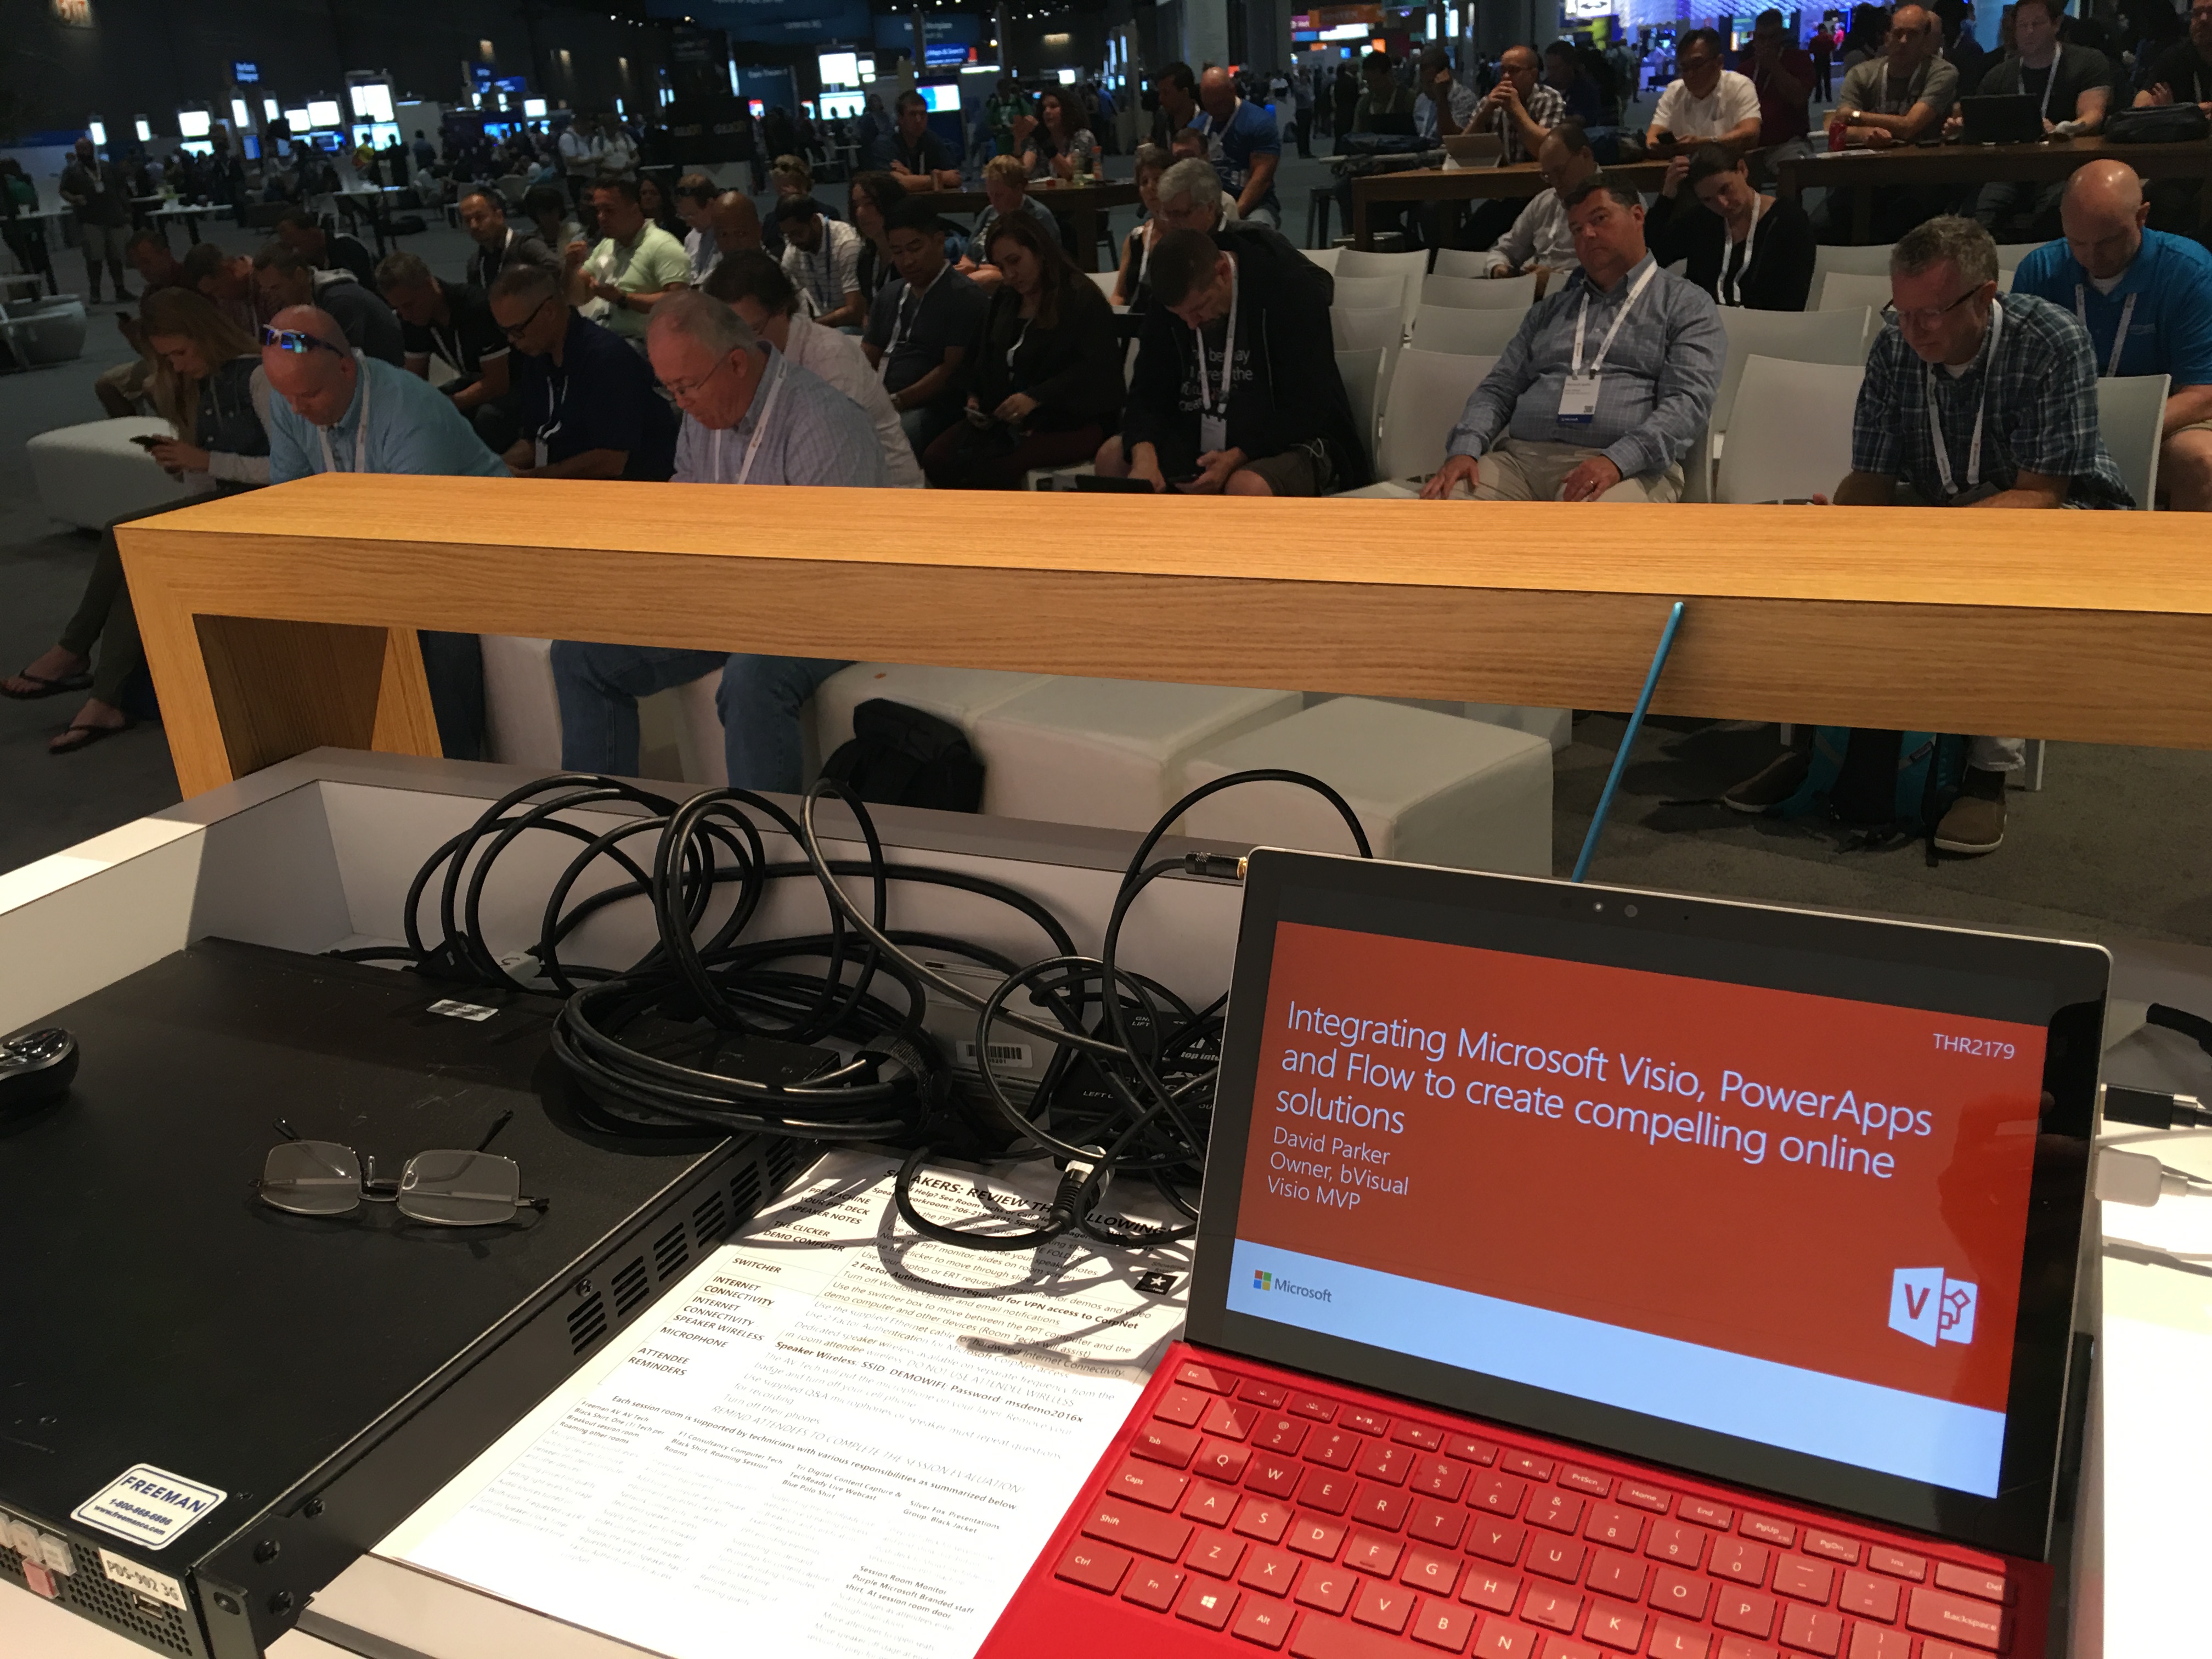
Integrating Microsoft Visio, PowerApps and Flow to create compelling online solutions
We’ve been creating graphical data solutions with Visio and many different data sources over the past 21 years, because of its programmability and data linking capabilities. Now, Visio can be combined with Microsoft PowerApps and Microsoft Flow to create compelling online applications quickly and simply for a variety of business uses. See how these three components of Office 365 can be blended together as a powerful triumvirate.
PowerPoint presentation
Managing Space and Time with Visio and Power BI
You’re attending Ignite. You’ve registered for 15 sessions. The sessions are located in more than 300 meeting rooms. The meeting rooms are spread across nearly three million square feet in the Orange County Convention Center. What tools do you have that can help you to maximize your time and minimize unnecessary walking?
PowerPoint presentation
Support your infrastructure with data-driven network diagrams
Many people use Visio to create network diagrams, but only a small percentage leverage Visio’s data linking and data visualization capabilities to turn their diagrams into dynamic network dashboards. Which servers are performing below their SLAs? How much disk capacity is available in each location? Who’s the admin for the failed server in Chicago? Can I view infrastructure status on my phone when I’m not in the office? You will learn tips that will help you build diagrams to do all this and more.
PowerPoint presentation