

Microsoft Visio Professional has had the ability to quickly visualize shape data with data graphics for a while now. This data can be displayed as Text, Data Bar, Icon Set or Color By Value. In an earlier article ( see http://blog.bvisual.net/2014/08/21/using-icon-sets-shapes-to-display-shape-data-values/ ), I showed how to enable the shapes in the Icon Sets stencil to be linked to data. Well, I had a similar request recently for the Data Bar shapes. However, Microsoft did not package the Data Bar shapes into a handy stencil, so I have done this for you.
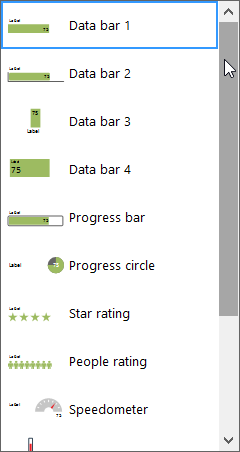
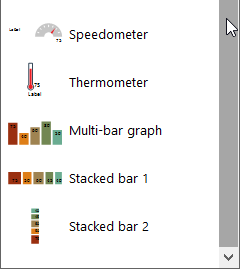
Firstly, a reminder of the thirteen built-in Data Bar shapes that are available to you when you choose to display data as a Data Graphics / Data Bar:
|
|
|
In fact, these shapes are stored in a hidden stencil called DVCALL_[UM].vssx in the Microsoft Office/Office15/Visio Content \ folder, but they are not usable directly as separate shapes because of some particular settings:
Firstly, they are all marked as hidden, and secondly, the presence of the User.msvCalloutShape cell prevents Link Data to Shapes from working, and lastly, all of the Shape Data rows are marked as invisible.
I have changed these settings and put the masters, with a leading underscore in their names, into a Data Bars stencil which can be downloaded from Data Bars.vssx

Simply place the file in you My Shapes folder to make it available for use within your Visio interface. The msvCalloutField data row is the value that you need to update to see the graphics change.
Reviewing these shapes should also inspire you to make your own custom Data Bar shapes.
Note : Only license holders of Microsoft Visio Professional 2013+ have the rights to use this stencil.